The United States has some of the highest levels of income and wealth inequality in the world. U.S. Federal Reserve data shows that the wealthiest 10% of Americans control $93.8 trillion, more than double the $40.3 trillion in the hands of the remaining 90% of Americans.
The income and wealth divide only appears to be growing wider. A January 2020 report published by the Pew Research Center found that over the last four decades, income growth for the top 5% of families by earnings has far outpaced income growth for families in the lower income strata.
In a nation as large as the U.S., varied levels of income inequality may be expected. While some parts have wide income gaps, other parts of the country are defined, at least in part, by their relative income equality.
Using data from the U.S. Census Bureau’s 2019 American Community Survey, 24/7 Wall St. identified the ZIP code with the smallest income gap in each state. ZIP codes are ranked by their Gini coefficient, a measure of income inequality based on the distribution of income across a population on a 0 to 1 scale — 0 representing perfect equality and 1 representing the highest possible level of inequality.
Though each ZIP code on this list has the smallest degree of income inequality in its state, Gini scores vary — from 0.225 to 0.354. Nationwide, the Gini coefficient stands at 0.482.
Causes behind rising inequality in the United States are complex and varied. A report published by the National Bureau of Economic Research ties the rising disparity to a range of economic factors, including globalization, technological advancement, a stagnant minimum wage, and the decline of labor unions.
Click here to see the zip code with the smallest income gaps in every state
Click here to read our detailed methodology

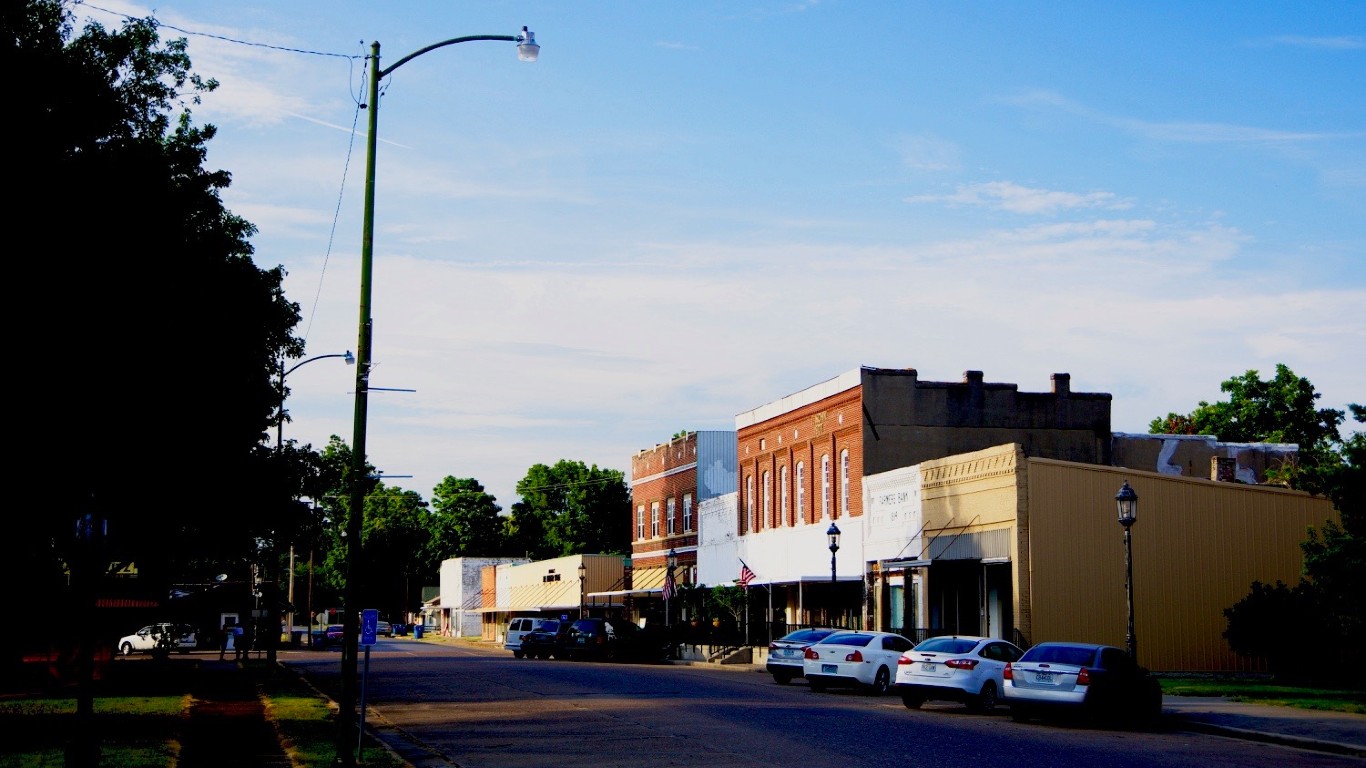
Alabama: 36362
> Location: Fort Rucker
> Gini index: 0.28 (Alabama: 0.479)
> Avg. household income, top 20%: $121,531 (Alabama: $177,811)
> Avg. household income, bottom 20%: $24,677 (Alabama: $10,538)
> Share of all income in 36362 that went to top 20%: 34.8% (Alabama: 50.9%)
> Share of all income in 36362 that went to bottom 20%: 7.1% (Alabama: 3.0%)
> Median household income: $70,024 (Alabama: $50,536)
[in-text-ad]
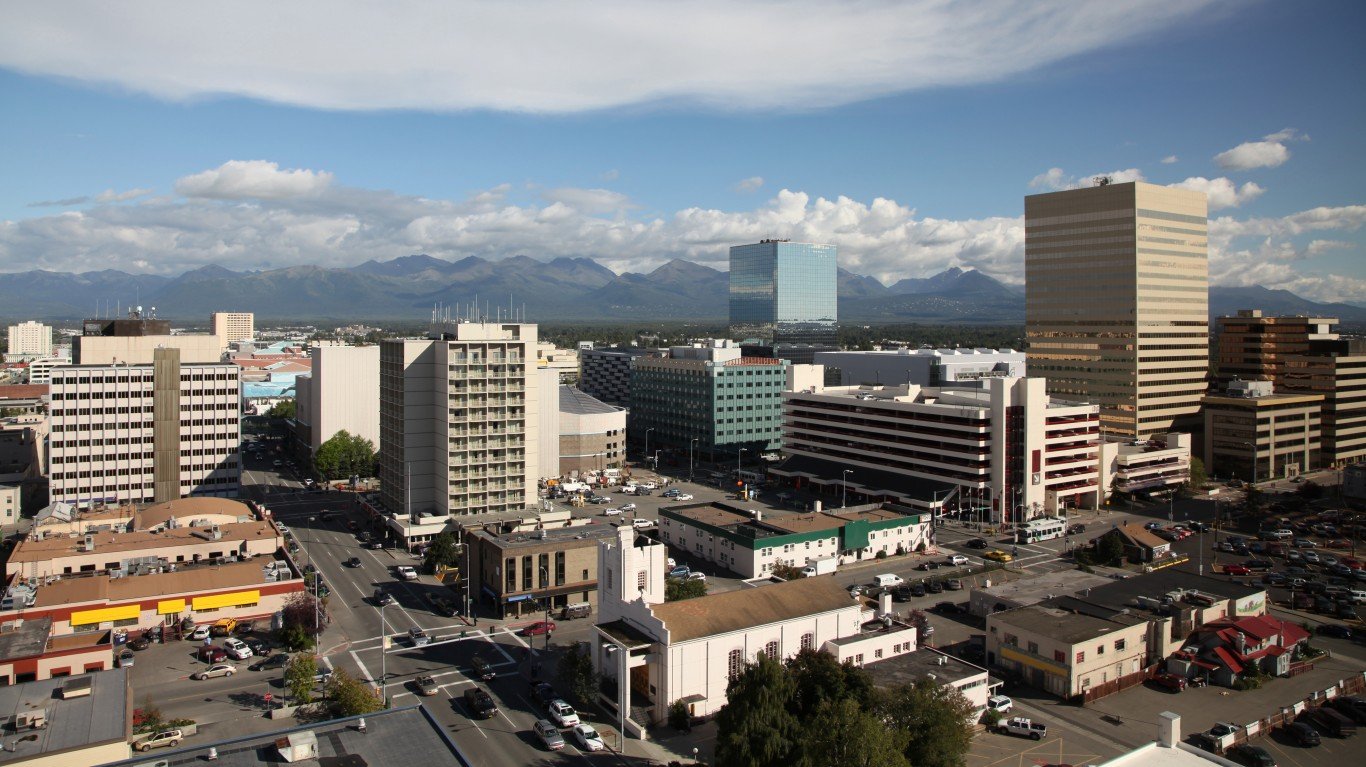
Alaska: 99506
> Location: Anchorage
> Gini index: 0.331 (Alaska: 0.428)
> Avg. household income, top 20%: $129,589 (Alaska: $230,147)
> Avg. household income, bottom 20%: $20,434 (Alaska: $18,977)
> Share of all income in 99506 that went to top 20%: 39.6% (Alaska: 46.7%)
> Share of all income in 99506 that went to bottom 20%: 6.2% (Alaska: 3.8%)
> Median household income: $58,851 (Alaska: $77,640)
[recirclink id=887395]

Arizona: 85540
> Location: Morenci
> Gini index: 0.225 (Arizona: 0.466)
> Avg. household income, top 20%: $139,213 (Arizona: $202,970)
> Avg. household income, bottom 20%: $43,941 (Arizona: $13,587)
> Share of all income in 85540 that went to top 20%: 33.1% (Arizona: 50.3%)
> Share of all income in 85540 that went to bottom 20%: 10.4% (Arizona: 3.4%)
> Median household income: $72,934 (Arizona: $58,945)

Arkansas: 72718
> Location: Cave Springs
> Gini index: 0.335 (Arkansas: 0.477)
> Avg. household income, top 20%: $316,637 (Arkansas: $170,176)
> Avg. household income, bottom 20%: $48,004 (Arkansas: $11,049)
> Share of all income in 72718 that went to top 20%: 41.0% (Arkansas: 51.1%)
> Share of all income in 72718 that went to bottom 20%: 6.2% (Arkansas: 3.3%)
> Median household income: $132,230 (Arkansas: $47,597)
[in-text-ad-2]

California: 92310
> Location: Fort Irwin
> Gini index: 0.283 (California: 0.489)
> Avg. household income, top 20%: $111,004 (California: $278,638)
> Avg. household income, bottom 20%: $25,333 (California: $15,827)
> Share of all income in 92310 that went to top 20%: 36.7% (California: 52.1%)
> Share of all income in 92310 that went to bottom 20%: 8.4% (California: 3.0%)
> Median household income: $54,787 (California: $75,235)

Colorado: 81615
> Location: Snowmass Village
> Gini index: 0.246 (Colorado: 0.457)
> Avg. household income, top 20%: N/A (Colorado: $239,479)
> Avg. household income, bottom 20%: N/A (Colorado: $17,187)
> Share of all income in 81615 that went to top 20%: N/A (Colorado: 49.4%)
> Share of all income in 81615 that went to bottom 20%: N/A (Colorado: 3.5%)
> Median household income: $70,634 (Colorado: $72,331)
[in-text-ad]
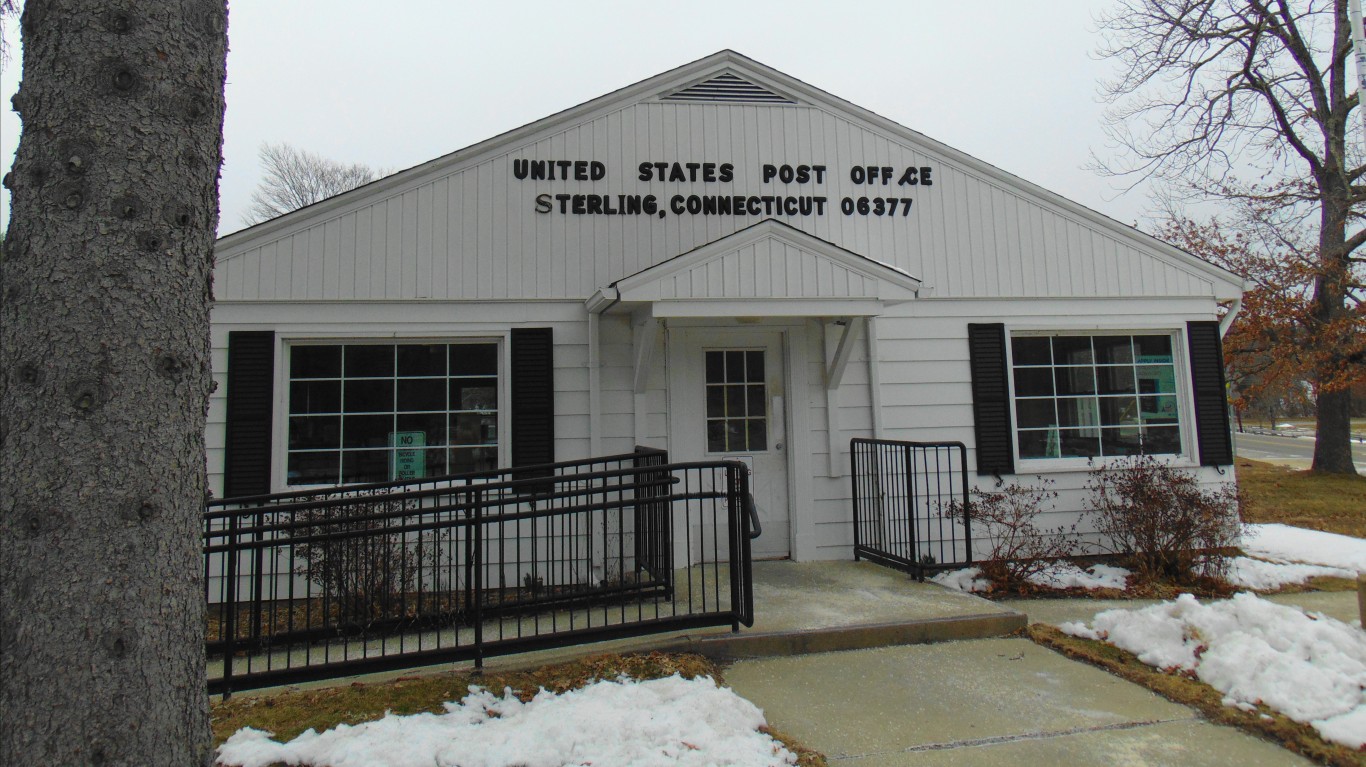
Connecticut: 06377
> Location: Sterling
> Gini index: 0.307 (Connecticut: 0.496)
> Avg. household income, top 20%: $150,293 (Connecticut: $298,915)
> Avg. household income, bottom 20%: $24,147 (Connecticut: $16,569)
> Share of all income in 06377 that went to top 20%: 35.8% (Connecticut: 52.9%)
> Share of all income in 06377 that went to bottom 20%: 5.8% (Connecticut: 2.9%)
> Median household income: $83,102 (Connecticut: $78,444)
[recirclink id=848904]

Delaware: 19960
> Location: Milford
> Gini index: 0.337 (Delaware: 0.454)
> Avg. household income, top 20%: $128,893 (Delaware: $221,085)
> Avg. household income, bottom 20%: $18,995 (Delaware: $15,768)
> Share of all income in 19960 that went to top 20%: 39.5% (Delaware: 49.1%)
> Share of all income in 19960 that went to bottom 20%: 5.8% (Delaware: 3.5%)
> Median household income: $58,872 (Delaware: $68,287)

Florida: 32798
> Location: Zellwood
> Gini index: 0.286 (Florida: 0.486)
> Avg. household income, top 20%: $103,751 (Florida: $209,841)
> Avg. household income, bottom 20%: $24,011 (Florida: $13,086)
> Share of all income in 32798 that went to top 20%: 36.7% (Florida: 52.3%)
> Share of all income in 32798 that went to bottom 20%: 8.5% (Florida: 3.3%)
> Median household income: $48,086 (Florida: $55,660)
[in-text-ad-2]

Georgia: 31807
> Location: Ellerslie
> Gini index: 0.242 (Georgia: 0.482)
> Avg. household income, top 20%: $152,066 (Georgia: $212,411)
> Avg. household income, bottom 20%: $40,333 (Georgia: $12,798)
> Share of all income in 31807 that went to top 20%: 32.3% (Georgia: 51.5%)
> Share of all income in 31807 that went to bottom 20%: 8.6% (Georgia: 3.1%)
> Median household income: $93,632 (Georgia: $58,700)
Hawaii: 96706
> Location: Ewa Gentry
> Gini index: 0.34 (Hawaii: 0.441)
> Avg. household income, top 20%: $230,772 (Hawaii: $247,294)
> Avg. household income, bottom 20%: $32,492 (Hawaii: $17,890)
> Share of all income in 96706 that went to top 20%: 39.5% (Hawaii: 47.7%)
> Share of all income in 96706 that went to bottom 20%: 5.6% (Hawaii: 3.5%)
> Median household income: $105,161 (Hawaii: $81,275)
[in-text-ad]
Idaho: 83341
> Location: Kimberly
> Gini index: 0.346 (Idaho: 0.446)
> Avg. household income, top 20%: $160,279 (Idaho: $178,921)
> Avg. household income, bottom 20%: $25,234 (Idaho: $13,921)
> Share of all income in 83341 that went to top 20%: 40.9% (Idaho: 48.5%)
> Share of all income in 83341 that went to bottom 20%: 6.4% (Idaho: 3.8%)
> Median household income: $64,554 (Idaho: $55,785)
[recirclink id=920281]

Illinois: 60586
> Location: Joliet
> Gini index: 0.313 (Illinois: 0.482)
> Avg. household income, top 20%: $214,261 (Illinois: $237,616)
> Avg. household income, bottom 20%: $36,225 (Illinois: $14,052)
> Share of all income in 60586 that went to top 20%: 37.7% (Illinois: 51.4%)
> Share of all income in 60586 that went to bottom 20%: 6.4% (Illinois: 3.0%)
> Median household income: $105,597 (Illinois: $65,886)

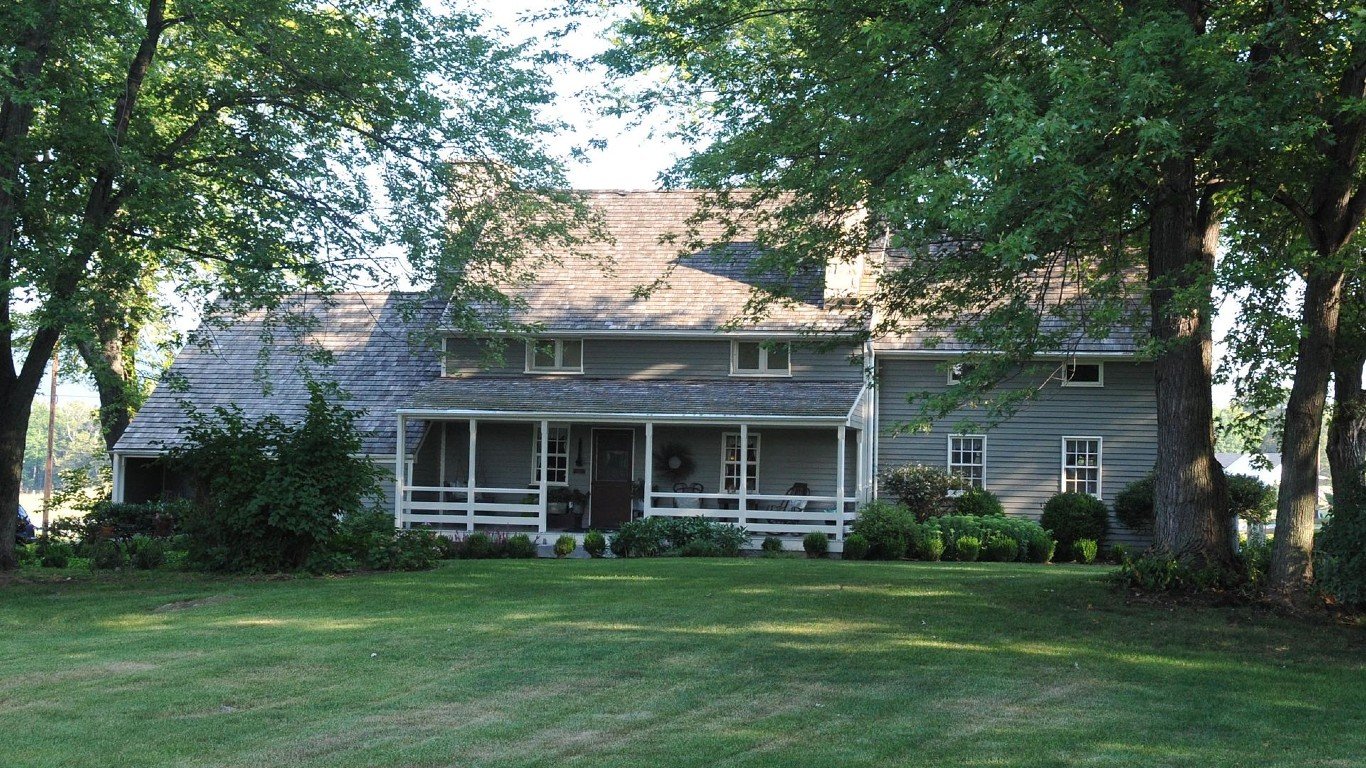
Indiana: 46130
> Location: Fountaintown
> Gini index: 0.315 (Indiana: 0.453)
> Avg. household income, top 20%: $155,612 (Indiana: $183,445)
> Avg. household income, bottom 20%: $23,563 (Indiana: $13,570)
> Share of all income in 46130 that went to top 20%: 37.5% (Indiana: 48.9%)
> Share of all income in 46130 that went to bottom 20%: 5.7% (Indiana: 3.6%)
> Median household income: $79,415 (Indiana: $56,303)
[in-text-ad-2]
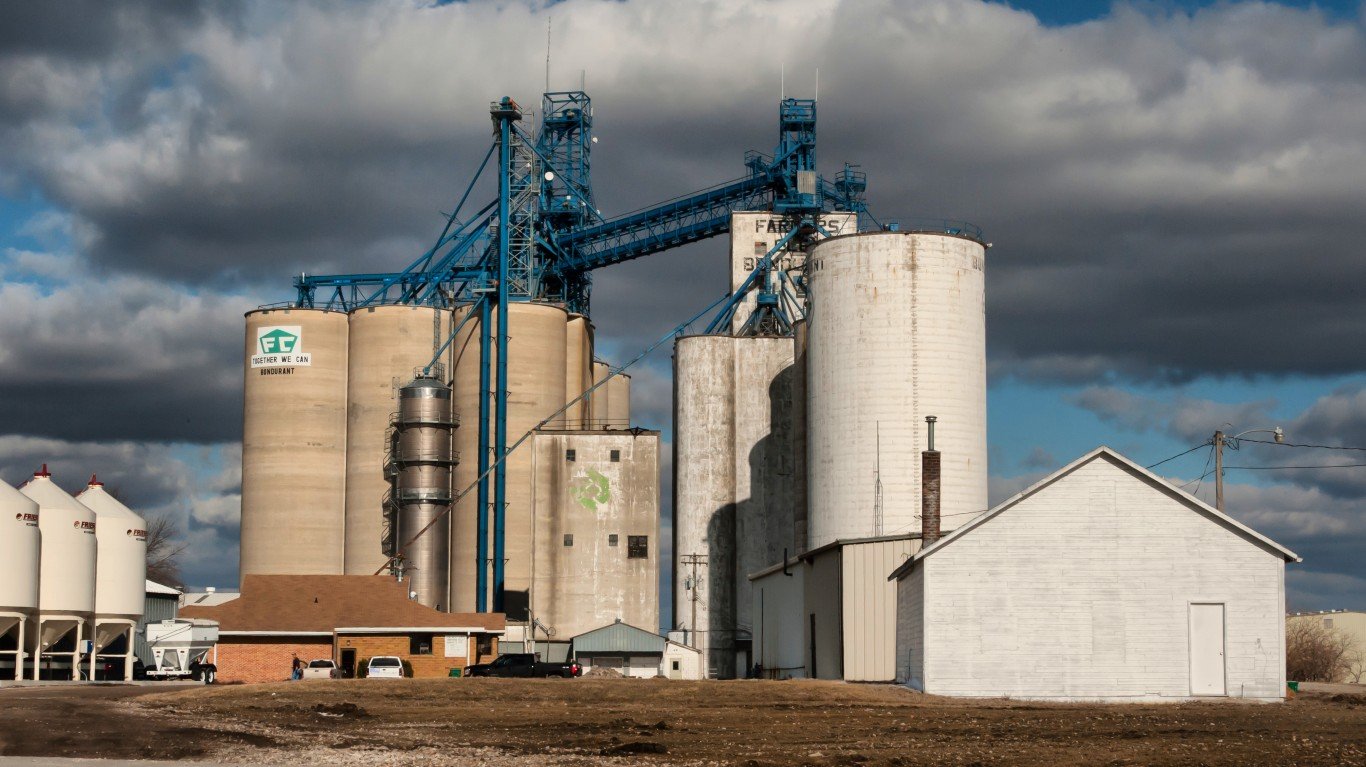
Iowa: 50035
> Location: Bondurant
> Gini index: 0.296 (Iowa: 0.442)
> Avg. household income, top 20%: $198,723 (Iowa: $187,874)
> Avg. household income, bottom 20%: $40,908 (Iowa: $14,836)
> Share of all income in 50035 that went to top 20%: 37.3% (Iowa: 47.9%)
> Share of all income in 50035 that went to bottom 20%: 7.7% (Iowa: 3.8%)
> Median household income: $99,115 (Iowa: $60,523)

Kansas: 66218
> Location: Shawnee
> Gini index: 0.309 (Kansas: 0.456)
> Avg. household income, top 20%: $291,713 (Kansas: $197,458)
> Avg. household income, bottom 20%: $57,485 (Kansas: $14,449)
> Share of all income in 66218 that went to top 20%: 39.2% (Kansas: 49.4%)
> Share of all income in 66218 that went to bottom 20%: 7.7% (Kansas: 3.6%)
> Median household income: $129,973 (Kansas: $59,597)
[in-text-ad]

Kentucky: 41051
> Location: Independence
> Gini index: 0.318 (Kentucky: 0.479)
> Avg. household income, top 20%: $168,173 (Kentucky: $178,883)
> Avg. household income, bottom 20%: $26,542 (Kentucky: $10,912)
> Share of all income in 41051 that went to top 20%: 37.6% (Kentucky: 51.0%)
> Share of all income in 41051 that went to bottom 20%: 5.9% (Kentucky: 3.1%)
> Median household income: $83,537 (Kentucky: $50,589)
[recirclink id=920281]

Louisiana: 71459
> Location: Fort Polk South
> Gini index: 0.354 (Louisiana: 0.495)
> Avg. household income, top 20%: $109,600 (Louisiana: $185,481)
> Avg. household income, bottom 20%: $15,952 (Louisiana: $9,757)
> Share of all income in 71459 that went to top 20%: 40.8% (Louisiana: 52.3%)
> Share of all income in 71459 that went to bottom 20%: 5.9% (Louisiana: 2.8%)
> Median household income: $46,530 (Louisiana: $49,469)

Maine: 04076
> Location: Shapleigh
> Gini index: 0.279 (Maine: 0.451)
> Avg. household income, top 20%: $124,028 (Maine: $185,447)
> Avg. household income, bottom 20%: $24,455 (Maine: $13,702)
> Share of all income in 04076 that went to top 20%: 34.2% (Maine: 48.7%)
> Share of all income in 04076 that went to bottom 20%: 6.7% (Maine: 3.6%)
> Median household income: $72,955 (Maine: $57,918)
[in-text-ad-2]
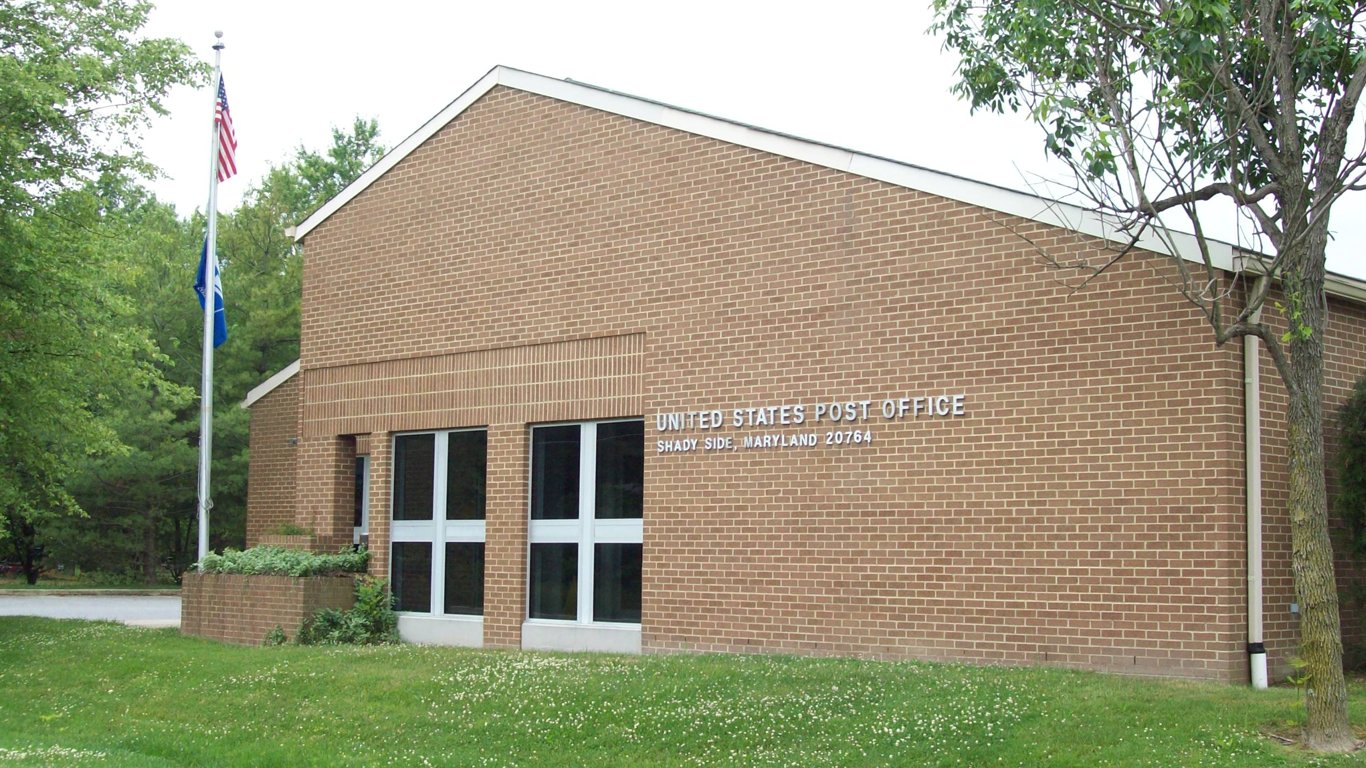
Maryland: 20764
> Location: Shady Side
> Gini index: 0.293 (Maryland: 0.454)
> Avg. household income, top 20%: $194,767 (Maryland: $272,042)
> Avg. household income, bottom 20%: $37,929 (Maryland: $18,854)
> Share of all income in 20764 that went to top 20%: 36.8% (Maryland: 48.8%)
> Share of all income in 20764 that went to bottom 20%: 7.2% (Maryland: 3.4%)
> Median household income: $100,491 (Maryland: $84,805)
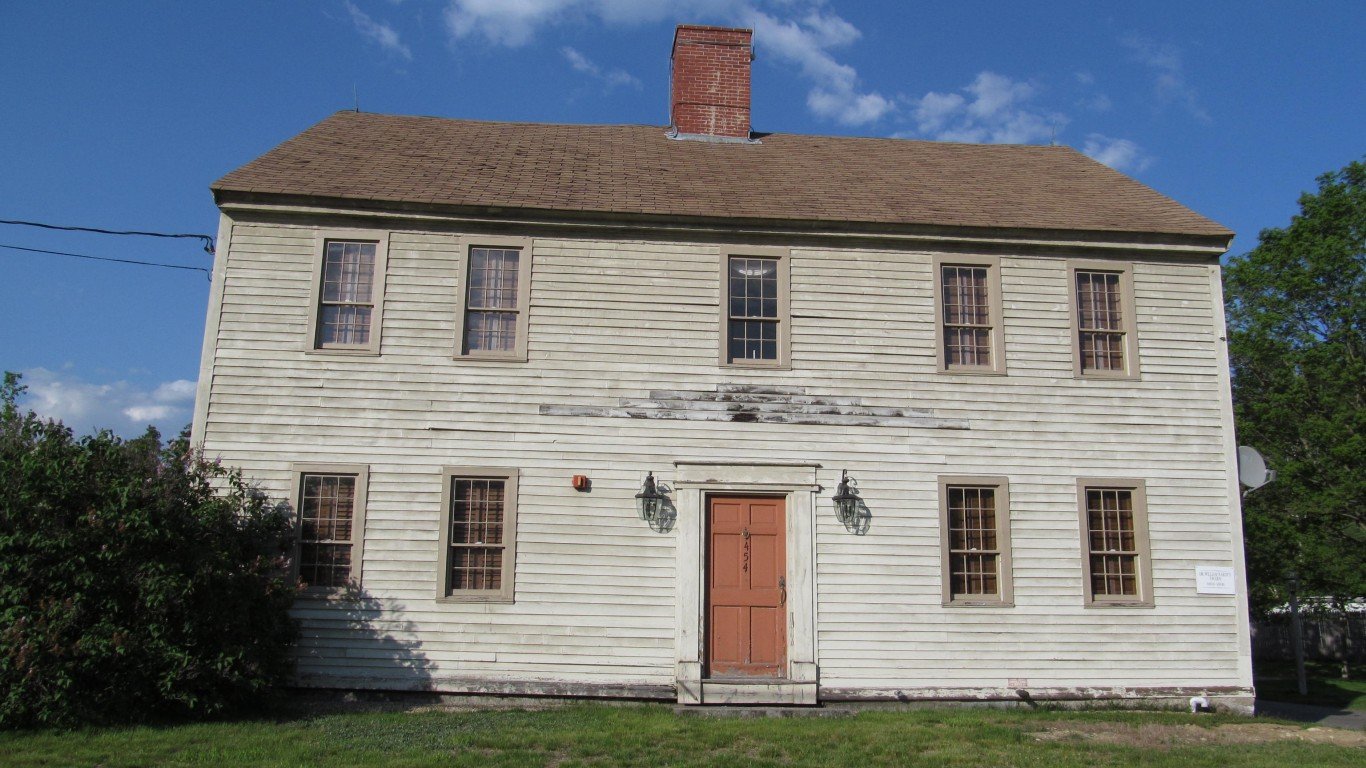
Massachusetts: 02032
> Location: East Walpole
> Gini index: 0.331 (Massachusetts: 0.483)
> Avg. household income, top 20%: $324,413 (Massachusetts: $284,857)
> Avg. household income, bottom 20%: $52,992 (Massachusetts: $15,520)
> Share of all income in 02032 that went to top 20%: 38.7% (Massachusetts: 51.1%)
> Share of all income in 02032 that went to bottom 20%: 6.3% (Massachusetts: 2.8%)
> Median household income: $155,474 (Massachusetts: $81,215)
[in-text-ad]

Michigan: 49650
> Location: Hardwood Acres
> Gini index: 0.291 (Michigan: 0.467)
> Avg. household income, top 20%: $140,899 (Michigan: $196,731)
> Avg. household income, bottom 20%: $24,054 (Michigan: $13,156)
> Share of all income in 49650 that went to top 20%: 34.7% (Michigan: 50.2%)
> Share of all income in 49650 that went to bottom 20%: 5.9% (Michigan: 3.4%)
> Median household income: $81,731 (Michigan: $57,144)
[recirclink id=970377]

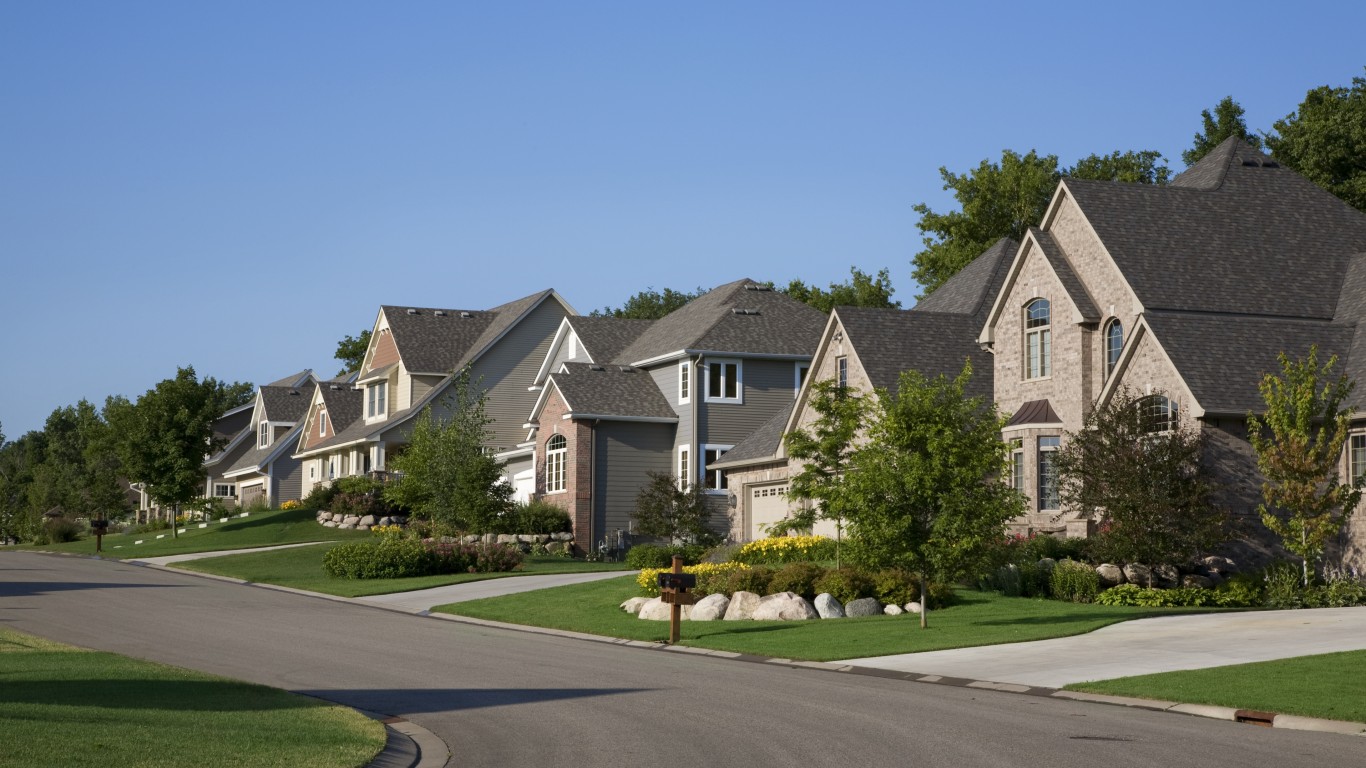
Minnesota: 55011
> Location: East Bethel
> Gini index: 0.298 (Minnesota: 0.449)
> Avg. household income, top 20%: $195,670 (Minnesota: $228,793)
> Avg. household income, bottom 20%: $36,386 (Minnesota: $17,300)
> Share of all income in 55011 that went to top 20%: 36.3% (Minnesota: 48.7%)
> Share of all income in 55011 that went to bottom 20%: 6.8% (Minnesota: 3.7%)
> Median household income: $104,438 (Minnesota: $71,306)

Mississippi: 39272
> Location: Byram
> Gini index: 0.325 (Mississippi: 0.481)
> Avg. household income, top 20%: $137,046 (Mississippi: $160,084)
> Avg. household income, bottom 20%: $21,263 (Mississippi: $9,367)
> Share of all income in 39272 that went to top 20%: 38.5% (Mississippi: 51.0%)
> Share of all income in 39272 that went to bottom 20%: 6.0% (Mississippi: 3.0%)
> Median household income: $65,931 (Mississippi: $45,081)
[in-text-ad-2]

Missouri: 64029
> Location: Grain Valley
> Gini index: 0.308 (Missouri: 0.464)
> Avg. household income, top 20%: $156,822 (Missouri: $190,290)
> Avg. household income, bottom 20%: $27,969 (Missouri: $13,281)
> Share of all income in 64029 that went to top 20%: 37.7% (Missouri: 50.0%)
> Share of all income in 64029 that went to bottom 20%: 6.7% (Missouri: 3.5%)
> Median household income: $78,320 (Missouri: $55,461)

Montana: 59635
> Location: Helena Valley Southeast
> Gini index: 0.347 (Montana: 0.459)
> Avg. household income, top 20%: $136,055 (Montana: $184,017)
> Avg. household income, bottom 20%: $18,944 (Montana: $13,337)
> Share of all income in 59635 that went to top 20%: 38.9% (Montana: 49.6%)
> Share of all income in 59635 that went to bottom 20%: 5.4% (Montana: 3.6%)
> Median household income: $63,750 (Montana: $54,970)
[in-text-ad]
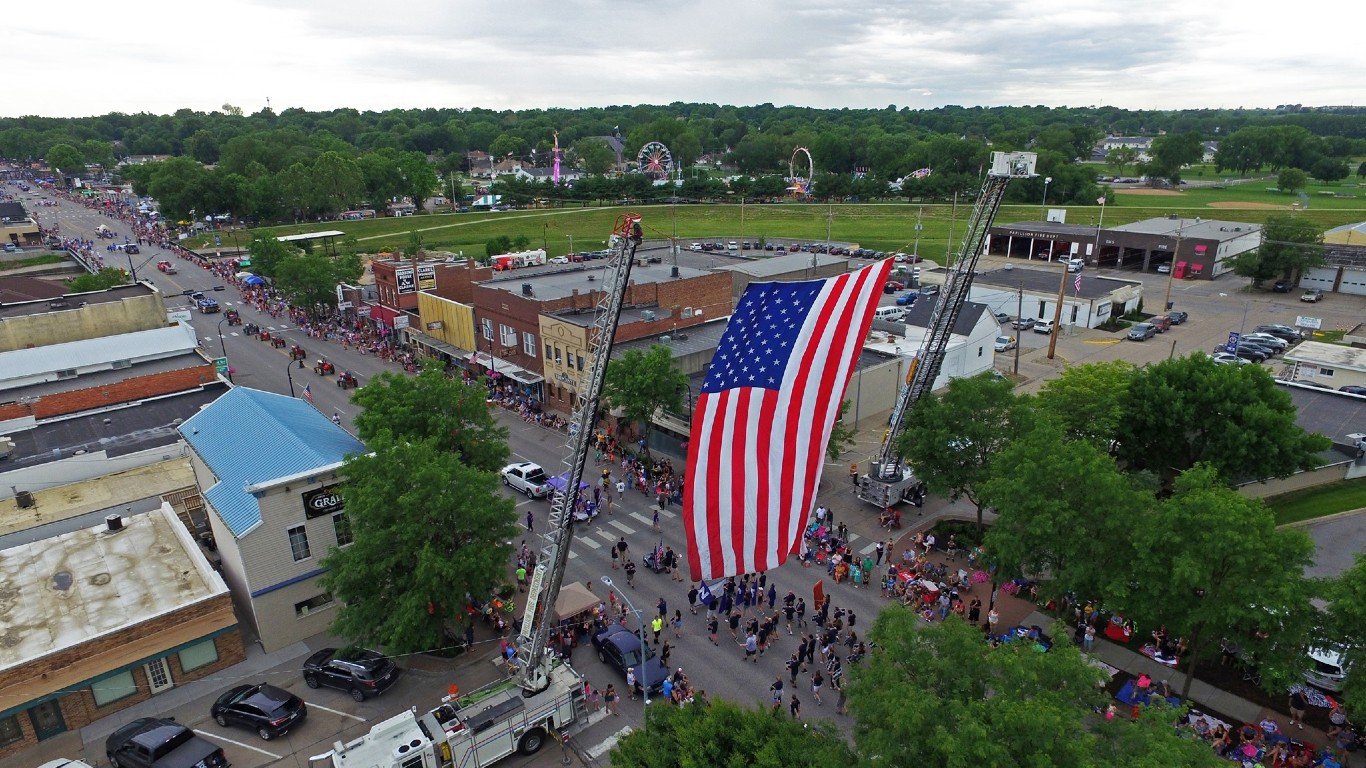
Nebraska: 68133
> Location: Papillion
> Gini index: 0.316 (Nebraska: 0.444)
> Avg. household income, top 20%: $247,773 (Nebraska: $193,357)
> Avg. household income, bottom 20%: $41,941 (Nebraska: $15,168)
> Share of all income in 68133 that went to top 20%: 38.8% (Nebraska: 48.2%)
> Share of all income in 68133 that went to bottom 20%: 6.6% (Nebraska: 3.8%)
> Median household income: $114,310 (Nebraska: $61,439)
[recirclink id=887395]
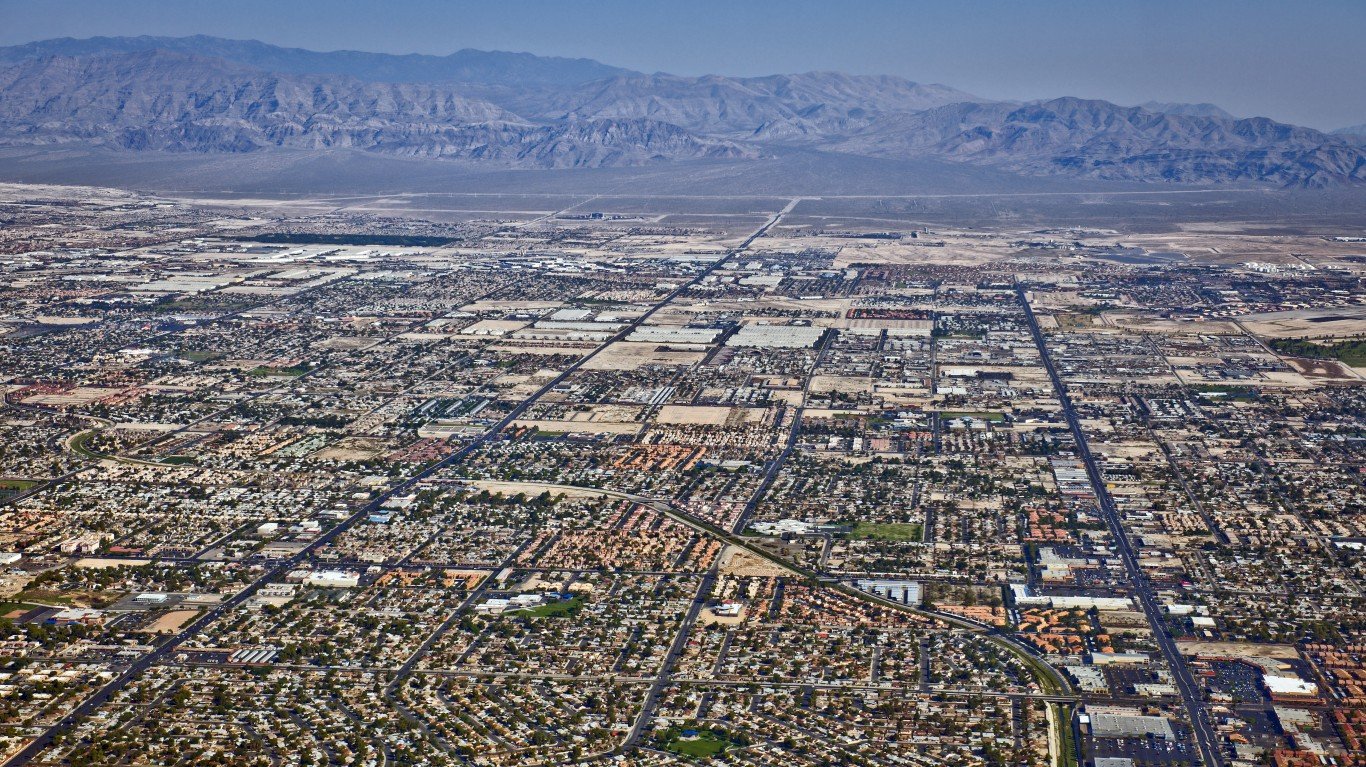
Nevada: 89085
> Location: North Las Vegas
> Gini index: 0.271 (Nevada: 0.462)
> Avg. household income, top 20%: $187,979 (Nevada: $203,124)
> Avg. household income, bottom 20%: $39,730 (Nevada: $14,239)
> Share of all income in 89085 that went to top 20%: 33.6% (Nevada: 49.8%)
> Share of all income in 89085 that went to bottom 20%: 7.1% (Nevada: 3.5%)
> Median household income: $120,194 (Nevada: $60,365)
New Hampshire: 03044
> Location: Fremont
> Gini index: 0.302 (New Hampshire: 0.438)
> Avg. household income, top 20%: $215,806 (New Hampshire: $236,675)
> Avg. household income, bottom 20%: $40,477 (New Hampshire: $18,862)
> Share of all income in 03044 that went to top 20%: 37.2% (New Hampshire: 47.7%)
> Share of all income in 03044 that went to bottom 20%: 7.0% (New Hampshire: 3.8%)
> Median household income: $110,344 (New Hampshire: $76,768)
[in-text-ad-2]

New Jersey: 08641
> Location: McGuire
> Gini index: 0.287 (New Jersey: 0.481)
> Avg. household income, top 20%: $139,745 (New Jersey: $294,079)
> Avg. household income, bottom 20%: $31,981 (New Jersey: $16,981)
> Share of all income in 08641 that went to top 20%: 36.9% (New Jersey: 51.3%)
> Share of all income in 08641 that went to bottom 20%: 8.4% (New Jersey: 3.0%)
> Median household income: $67,500 (New Jersey: $82,545)

New Mexico: 88330
> Location: Holloman
> Gini index: 0.333 (New Mexico: 0.478)
> Avg. household income, top 20%: $116,799 (New Mexico: $175,925)
> Avg. household income, bottom 20%: $21,075 (New Mexico: $10,558)
> Share of all income in 88330 that went to top 20%: 40.8% (New Mexico: 50.9%)
> Share of all income in 88330 that went to bottom 20%: 7.3% (New Mexico: 3.1%)
> Median household income: $47,240 (New Mexico: $49,754)
[in-text-ad]
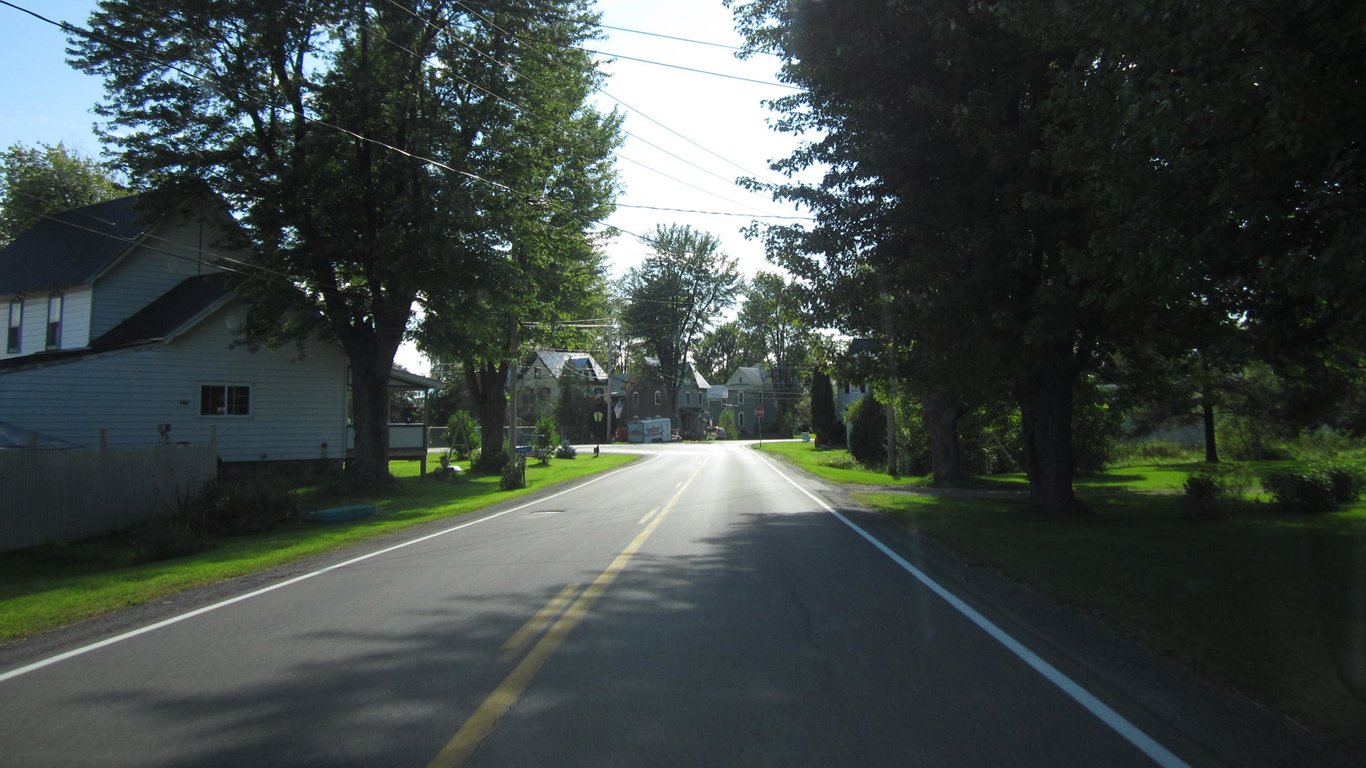
New York: 13637
> Location: Calcium
> Gini index: 0.302 (New York: 0.514)
> Avg. household income, top 20%: $126,163 (New York: $276,728)
> Avg. household income, bottom 20%: $26,601 (New York: $13,020)
> Share of all income in 13637 that went to top 20%: 38.7% (New York: 54.3%)
> Share of all income in 13637 that went to bottom 20%: 8.2% (New York: 2.6%)
> Median household income: $55,046 (New York: $68,486)
[recirclink id=848904]

North Carolina: 28543
> Location: Jacksonville
> Gini index: 0.282 (North Carolina: 0.476)
> Avg. household income, top 20%: $78,557 (North Carolina: $196,793)
> Avg. household income, bottom 20%: $18,212 (North Carolina: $12,761)
> Share of all income in 28543 that went to top 20%: 36.2% (North Carolina: 51.2%)
> Share of all income in 28543 that went to bottom 20%: 8.4% (North Carolina: 3.3%)
> Median household income: $39,229 (North Carolina: $54,602)
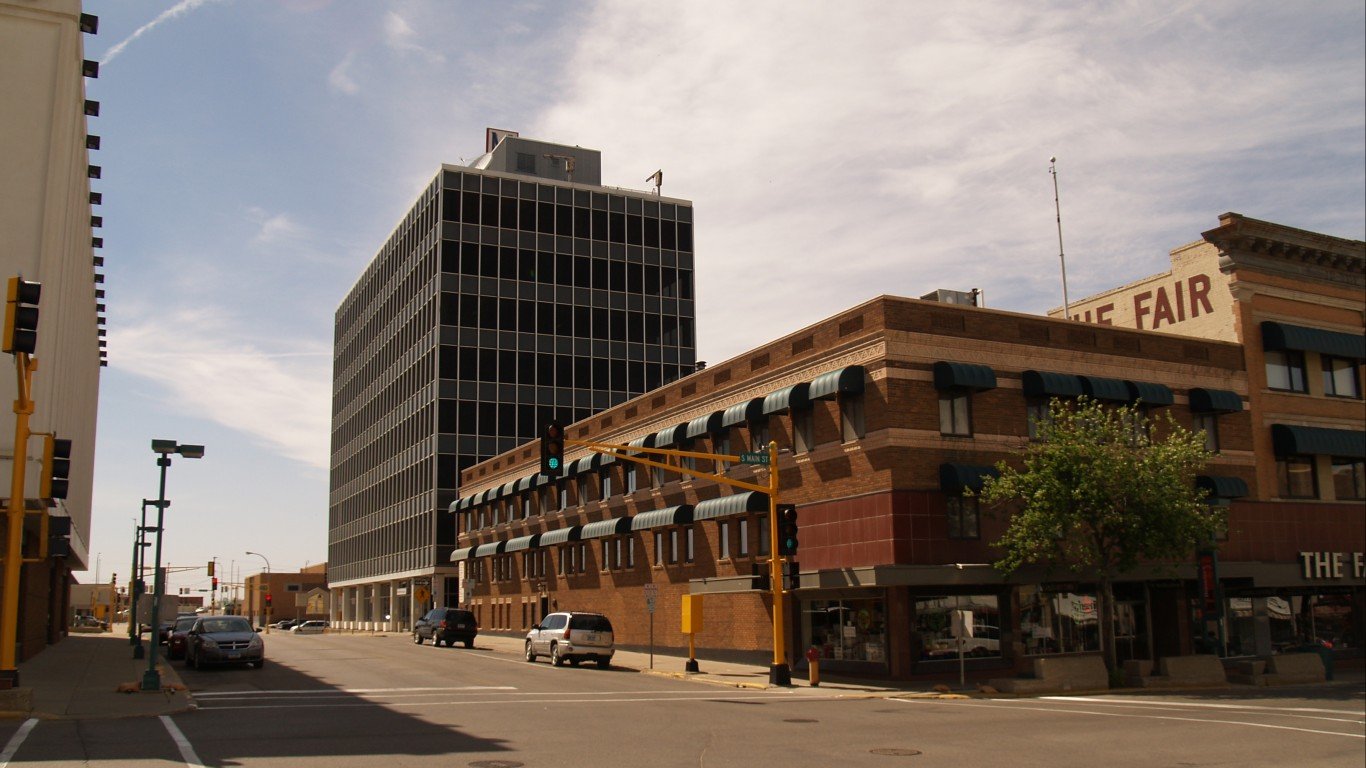
North Dakota: 58704
> Location: Minot
> Gini index: 0.332 (North Dakota: 0.454)
> Avg. household income, top 20%: $141,936 (North Dakota: $208,518)
> Avg. household income, bottom 20%: $23,832 (North Dakota: $14,804)
> Share of all income in 58704 that went to top 20%: 40.0% (North Dakota: 48.8%)
> Share of all income in 58704 that went to bottom 20%: 6.7% (North Dakota: 3.5%)
> Median household income: $60,242 (North Dakota: $64,894)
[in-text-ad-2]

Ohio: 43002
> Location: Columbus
> Gini index: 0.267 (Ohio: 0.465)
> Avg. household income, top 20%: $148,295 (Ohio: $192,225)
> Avg. household income, bottom 20%: $38,326 (Ohio: $12,861)
> Share of all income in 43002 that went to top 20%: 35.9% (Ohio: 50.0%)
> Share of all income in 43002 that went to bottom 20%: 9.3% (Ohio: 3.3%)
> Median household income: $70,303 (Ohio: $56,602)

Oklahoma: 73173
> Location: Oklahoma City
> Gini index: 0.329 (Oklahoma: 0.469)
> Avg. household income, top 20%: $258,226 (Oklahoma: $183,130)
> Avg. household income, bottom 20%: $41,266 (Oklahoma: $12,268)
> Share of all income in 73173 that went to top 20%: 40.0% (Oklahoma: 50.4%)
> Share of all income in 73173 that went to bottom 20%: 6.4% (Oklahoma: 3.4%)
> Median household income: $116,343 (Oklahoma: $52,919)
[in-text-ad]

Oregon: 97875
> Location: Stanfield
> Gini index: 0.318 (Oregon: 0.459)
> Avg. household income, top 20%: $127,111 (Oregon: $208,393)
> Avg. household income, bottom 20%: $21,505 (Oregon: $14,622)
> Share of all income in 97875 that went to top 20%: 38.2% (Oregon: 49.5%)
> Share of all income in 97875 that went to bottom 20%: 6.5% (Oregon: 3.5%)
> Median household income: $57,526 (Oregon: $62,818)
[recirclink id=920281]

Pennsylvania: 17532
> Location: Holtwood
> Gini index: 0.297 (Pennsylvania: 0.472)
> Avg. household income, top 20%: $144,869 (Pennsylvania: $214,725)
> Avg. household income, bottom 20%: $27,075 (Pennsylvania: $13,887)
> Share of all income in 17532 that went to top 20%: 36.1% (Pennsylvania: 50.6%)
> Share of all income in 17532 that went to bottom 20%: 6.8% (Pennsylvania: 3.3%)
> Median household income: $74,671 (Pennsylvania: $61,744)

Rhode Island: 02892
> Location: West Kingston
> Gini index: 0.325 (Rhode Island: 0.47)
> Avg. household income, top 20%: $241,888 (Rhode Island: $222,204)
> Avg. household income, bottom 20%: $41,744 (Rhode Island: $13,273)
> Share of all income in 02892 that went to top 20%: 38.6% (Rhode Island: 49.9%)
> Share of all income in 02892 that went to bottom 20%: 6.7% (Rhode Island: 3.0%)
> Median household income: $111,895 (Rhode Island: $67,167)
[in-text-ad-2]

South Carolina: 29229
> Location: Columbia
> Gini index: 0.347 (South Carolina: 0.474)
> Avg. household income, top 20%: $160,520 (South Carolina: $186,571)
> Avg. household income, bottom 20%: $22,061 (South Carolina: $11,736)
> Share of all income in 29229 that went to top 20%: 40.0% (South Carolina: 50.8%)
> Share of all income in 29229 that went to bottom 20%: 5.6% (South Carolina: 3.2%)
> Median household income: $71,803 (South Carolina: $53,199)

South Dakota: 57022
> Location: Dell Rapids
> Gini index: 0.322 (South Dakota: 0.444)
> Avg. household income, top 20%: $170,161 (South Dakota: $183,626)
> Avg. household income, bottom 20%: $29,064 (South Dakota: $14,543)
> Share of all income in 57022 that went to top 20%: 39.2% (South Dakota: 48.2%)
> Share of all income in 57022 that went to bottom 20%: 6.7% (South Dakota: 3.8%)
> Median household income: $74,712 (South Dakota: $58,275)
[in-text-ad]
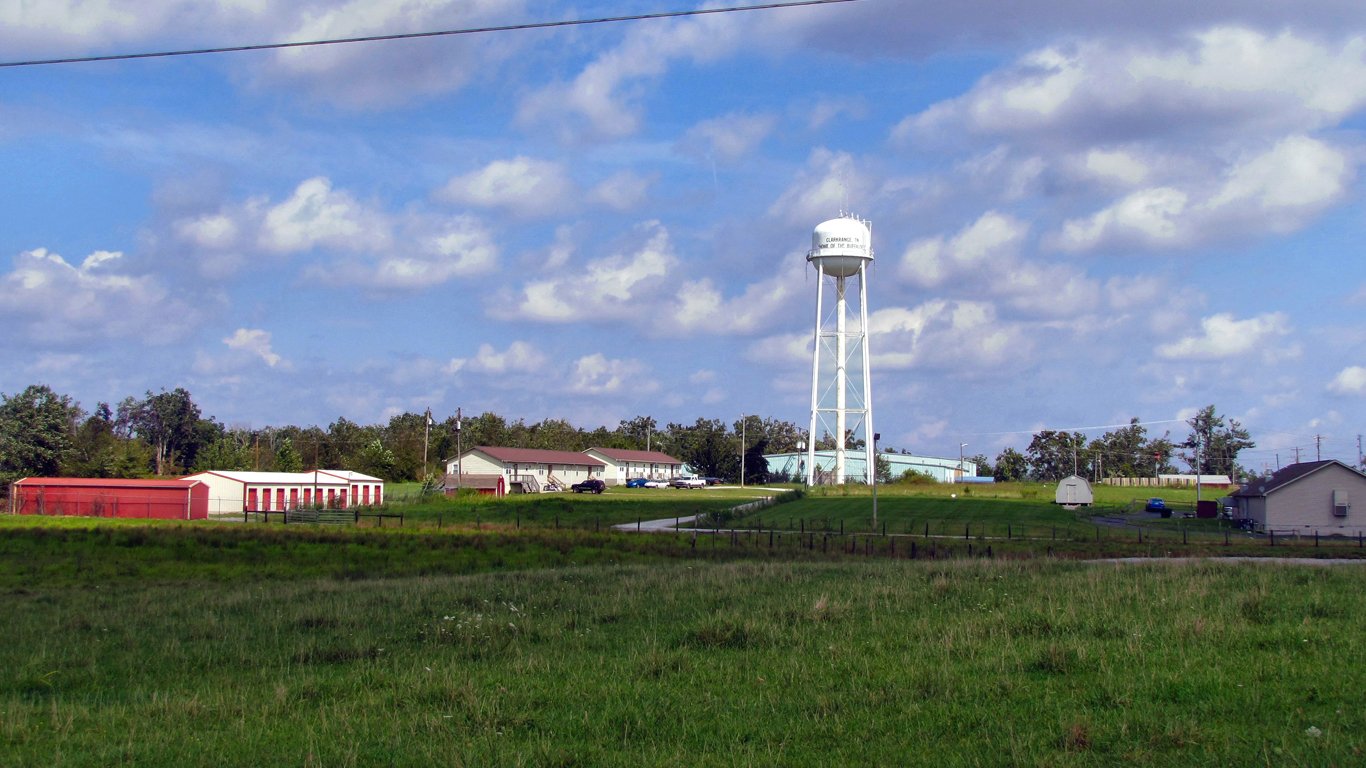
Tennessee: 38553
> Location: Clarkrange
> Gini index: 0.329 (Tennessee: 0.479)
> Avg. household income, top 20%: $95,815 (Tennessee: $191,924)
> Avg. household income, bottom 20%: $17,372 (Tennessee: $12,221)
> Share of all income in 38553 that went to top 20%: 38.9% (Tennessee: 51.3%)
> Share of all income in 38553 that went to bottom 20%: 7.1% (Tennessee: 3.3%)
> Median household income: $41,109 (Tennessee: $53,320)
[recirclink id=920281]

Texas: 75054
> Location: Grand Prairie
> Gini index: 0.287 (Texas: 0.479)
> Avg. household income, top 20%: $265,345 (Texas: $224,146)
> Avg. household income, bottom 20%: $54,768 (Texas: $14,034)
> Share of all income in 75054 that went to top 20%: 36.4% (Texas: 51.4%)
> Share of all income in 75054 that went to bottom 20%: 7.5% (Texas: 3.2%)
> Median household income: $133,802 (Texas: $61,874)

Utah: 84005
> Location: Eagle Mountain
> Gini index: 0.281 (Utah: 0.426)
> Avg. household income, top 20%: $165,265 (Utah: $214,437)
> Avg. household income, bottom 20%: $36,373 (Utah: $19,112)
> Share of all income in 84005 that went to top 20%: 36.4% (Utah: 47.0%)
> Share of all income in 84005 that went to bottom 20%: 8.0% (Utah: 4.2%)
> Median household income: $82,721 (Utah: $71,621)
[in-text-ad-2]

Vermont: 05477
> Location: Richmond
> Gini index: 0.344 (Vermont: 0.448)
> Avg. household income, top 20%: $212,461 (Vermont: $196,616)
> Avg. household income, bottom 20%: $29,507 (Vermont: $14,666)
> Share of all income in 05477 that went to top 20%: 39.4% (Vermont: 48.4%)
> Share of all income in 05477 that went to bottom 20%: 5.5% (Vermont: 3.6%)
> Median household income: $99,005 (Vermont: $61,973)
Virginia: 23665
> Location: Bethel Manor
> Gini index: 0.288 (Virginia: 0.469)
> Avg. household income, top 20%: $133,491 (Virginia: $256,360)
> Avg. household income, bottom 20%: $26,848 (Virginia: $16,508)
> Share of all income in 23665 that went to top 20%: 36.0% (Virginia: 50.4%)
> Share of all income in 23665 that went to bottom 20%: 7.3% (Virginia: 3.3%)
> Median household income: $66,350 (Virginia: $74,222)
[in-text-ad]

Washington: 98315
> Location: Bangor Base
> Gini index: 0.28 (Washington: 0.457)
> Avg. household income, top 20%: $100,175 (Washington: $244,742)
> Avg. household income, bottom 20%: $16,309 (Washington: $17,314)
> Share of all income in 98315 that went to top 20%: 33.4% (Washington: 49.5%)
> Share of all income in 98315 that went to bottom 20%: 5.4% (Washington: 3.5%)
> Median household income: $57,134 (Washington: $73,775)
[recirclink id=970377]
West Virginia: 25428
> Location: Inwood
> Gini index: 0.311 (West Virginia: 0.467)
> Avg. household income, top 20%: $131,997 (West Virginia: $158,941)
> Avg. household income, bottom 20%: $23,118 (West Virginia: $10,504)
> Share of all income in 25428 that went to top 20%: 36.8% (West Virginia: 49.9%)
> Share of all income in 25428 that went to bottom 20%: 6.4% (West Virginia: 3.3%)
> Median household income: $67,716 (West Virginia: $46,711)

Wisconsin: 54229
> Location: Green Bay
> Gini index: 0.309 (Wisconsin: 0.445)
> Avg. household income, top 20%: $159,196 (Wisconsin: $194,624)
> Avg. household income, bottom 20%: $28,718 (Wisconsin: $15,311)
> Share of all income in 54229 that went to top 20%: 37.7% (Wisconsin: 48.3%)
> Share of all income in 54229 that went to bottom 20%: 6.8% (Wisconsin: 3.8%)
> Median household income: $75,703 (Wisconsin: $61,747)
[in-text-ad-2]
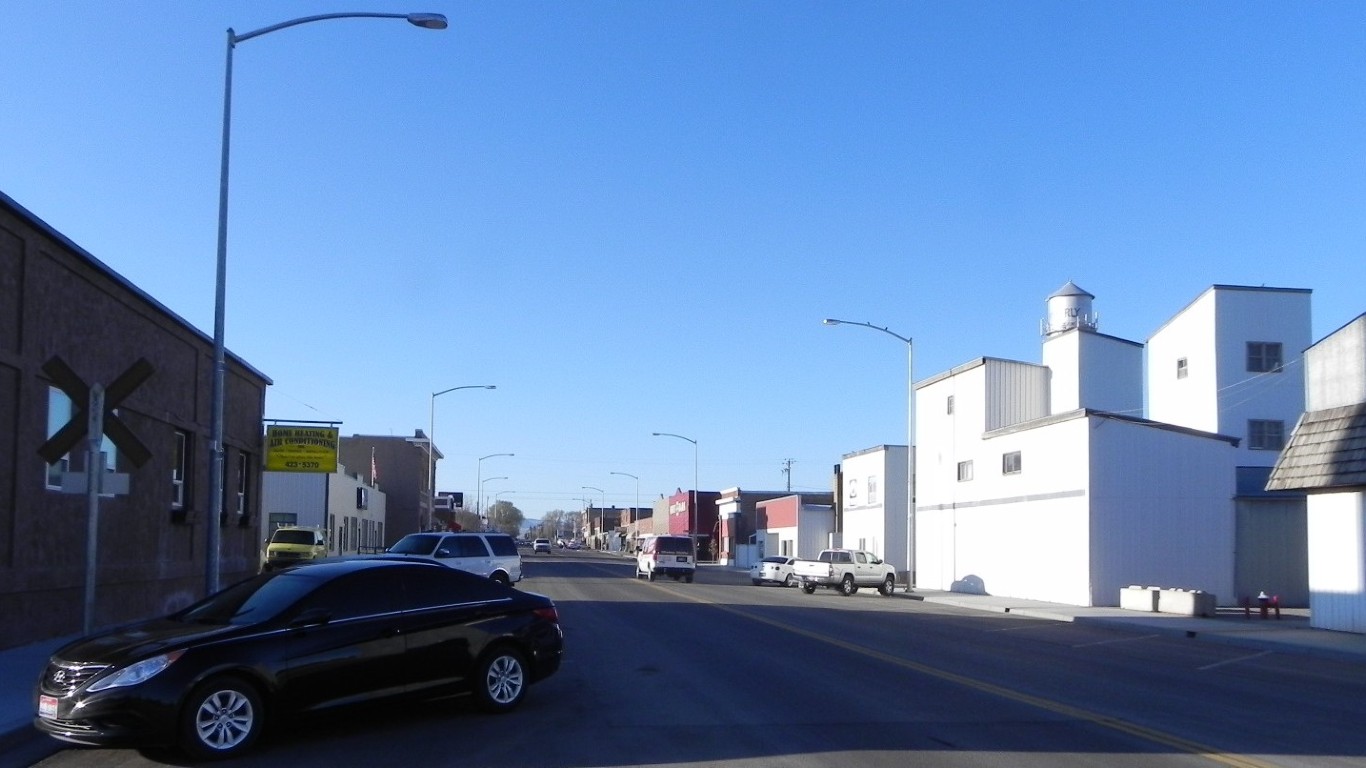
Wyoming: 82721
> Location: Moorcroft
> Gini index: 0.338 (Wyoming: 0.436)
> Avg. household income, top 20%: $158,515 (Wyoming: $193,249)
> Avg. household income, bottom 20%: $22,438 (Wyoming: $15,572)
> Share of all income in 82721 that went to top 20%: 38.2% (Wyoming: 47.2%)
> Share of all income in 82721 that went to bottom 20%: 5.4% (Wyoming: 3.8%)
> Median household income: $78,600 (Wyoming: $64,049)
Methodology
To determine the ZIP code with the smallest income gaps in every state, 24/7 Wall St. reviewed five-year estimates of the Gini Index of income inequality from the U.S. Census Bureau’s 2019 American Community Survey.
The Gini Index of income inequality summarizes income dispersion in an area on a scale from 0 to 1. A value of 0 indicates perfect equality — everyone in the area receives an equal share of income. A value of 1 indicates perfect inequality — only one recipient receives all the income.
We used ZIP Code Tabulation Areas — a census geography type which defines areal representations of United States Postal Service ZIP codes (USPS ZIP codes do not define geographic boundaries but instead are a network of mail delivery routes in a service area). We refer to Census ZCTAs as ZIP codes.
Of the 33,120 ZIP codes the Census publishes data for, 32,936 had boundaries that fell within one of the 50 states, while the rest were in the District of Columbia or Puerto Rico.
ZIP codes were excluded if the Gini Index was not available in the 2019 ACS, if there were fewer than 1,000 housing units, or if the sampling error associated with a ZIP code’s data was deemed too high.
The sampling error was defined as too high if the coefficient of variation — a statistical assessment of how reliable an estimate is — for a ZIP code’s Gini Index was above 15% and greater than two standard deviations above the mean CV for all ZIP codes’ Gini Indices. We similarly excluded ZIP codes that had a sampling error too high for their population, using the same definition.
The remaining 16,721 places were ranked within their state based on their Gini Index. To break ties, we used the share of aggregate household income earned by the top 20% of households.
Additional information on average household income by quintile, share of aggregate household income by quintile, and median household income are also five-year estimates from the 2019 ACS.
Contact [email protected] for any questions or corrections.