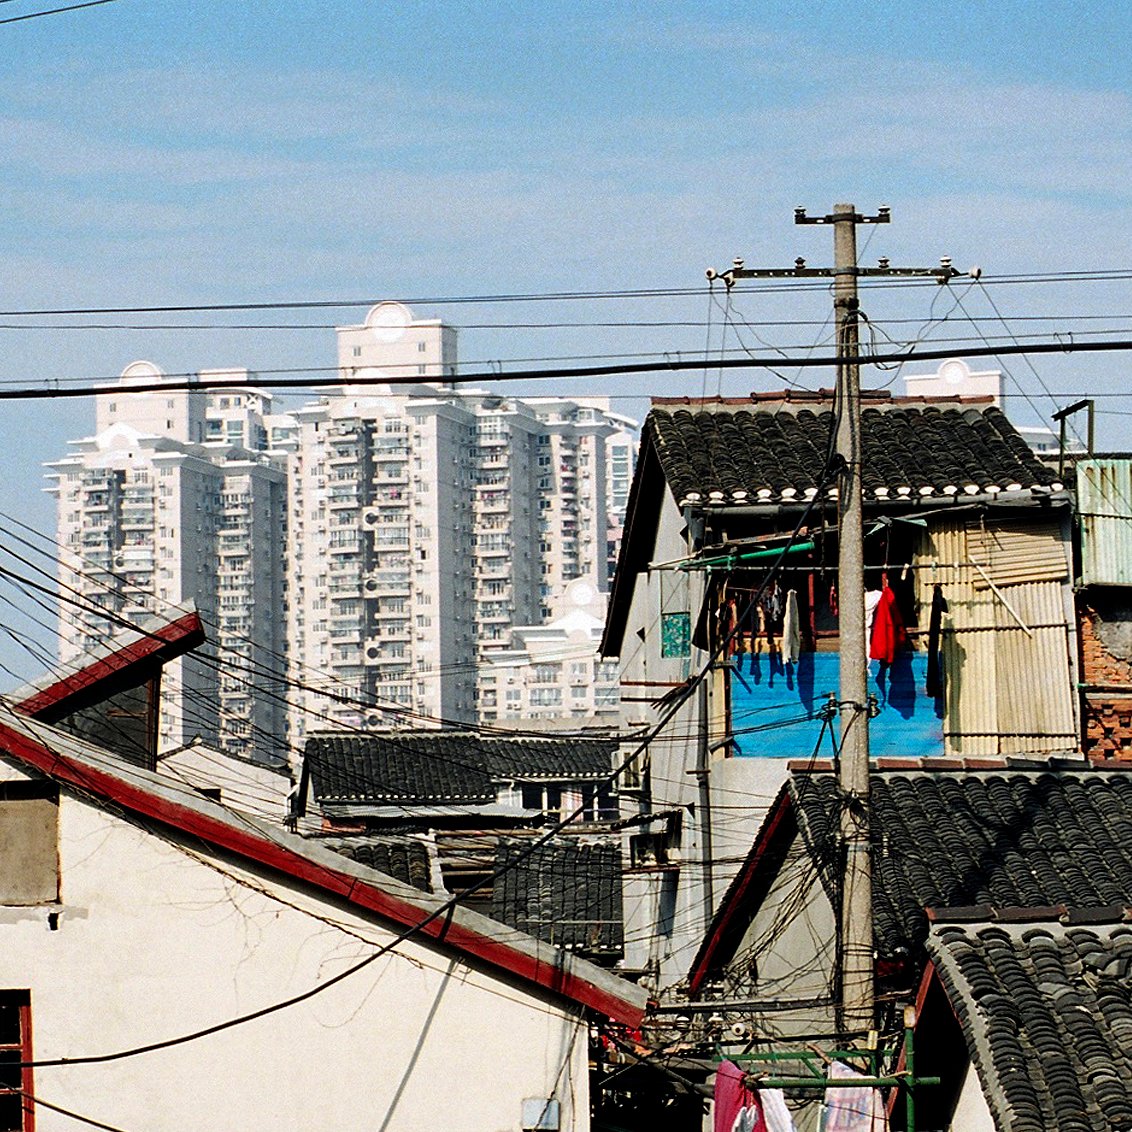
The wealth gap between the richest few and poorest many tends to widen whenever there is a dramatic change in the economy. The deficit began to expand in the middle of the 19th century at the dawn of the Industrial Revolution, and by the end of that century, had turned the famously rich – such figures as Andrew Carnegie, J.P. Morgan and John D. Rockefeller – into symbols of awe and scorn.
In our time, as technology has reformed the economy and made a select few wealthy beyond measure, such billionaires as Mark Zuckerberg, Jeff Bezos, and Elon Tesla have become household names – though those names are sometimes uttered with derision. (In the U.S., these are the 25 cities with the most billionaires.)
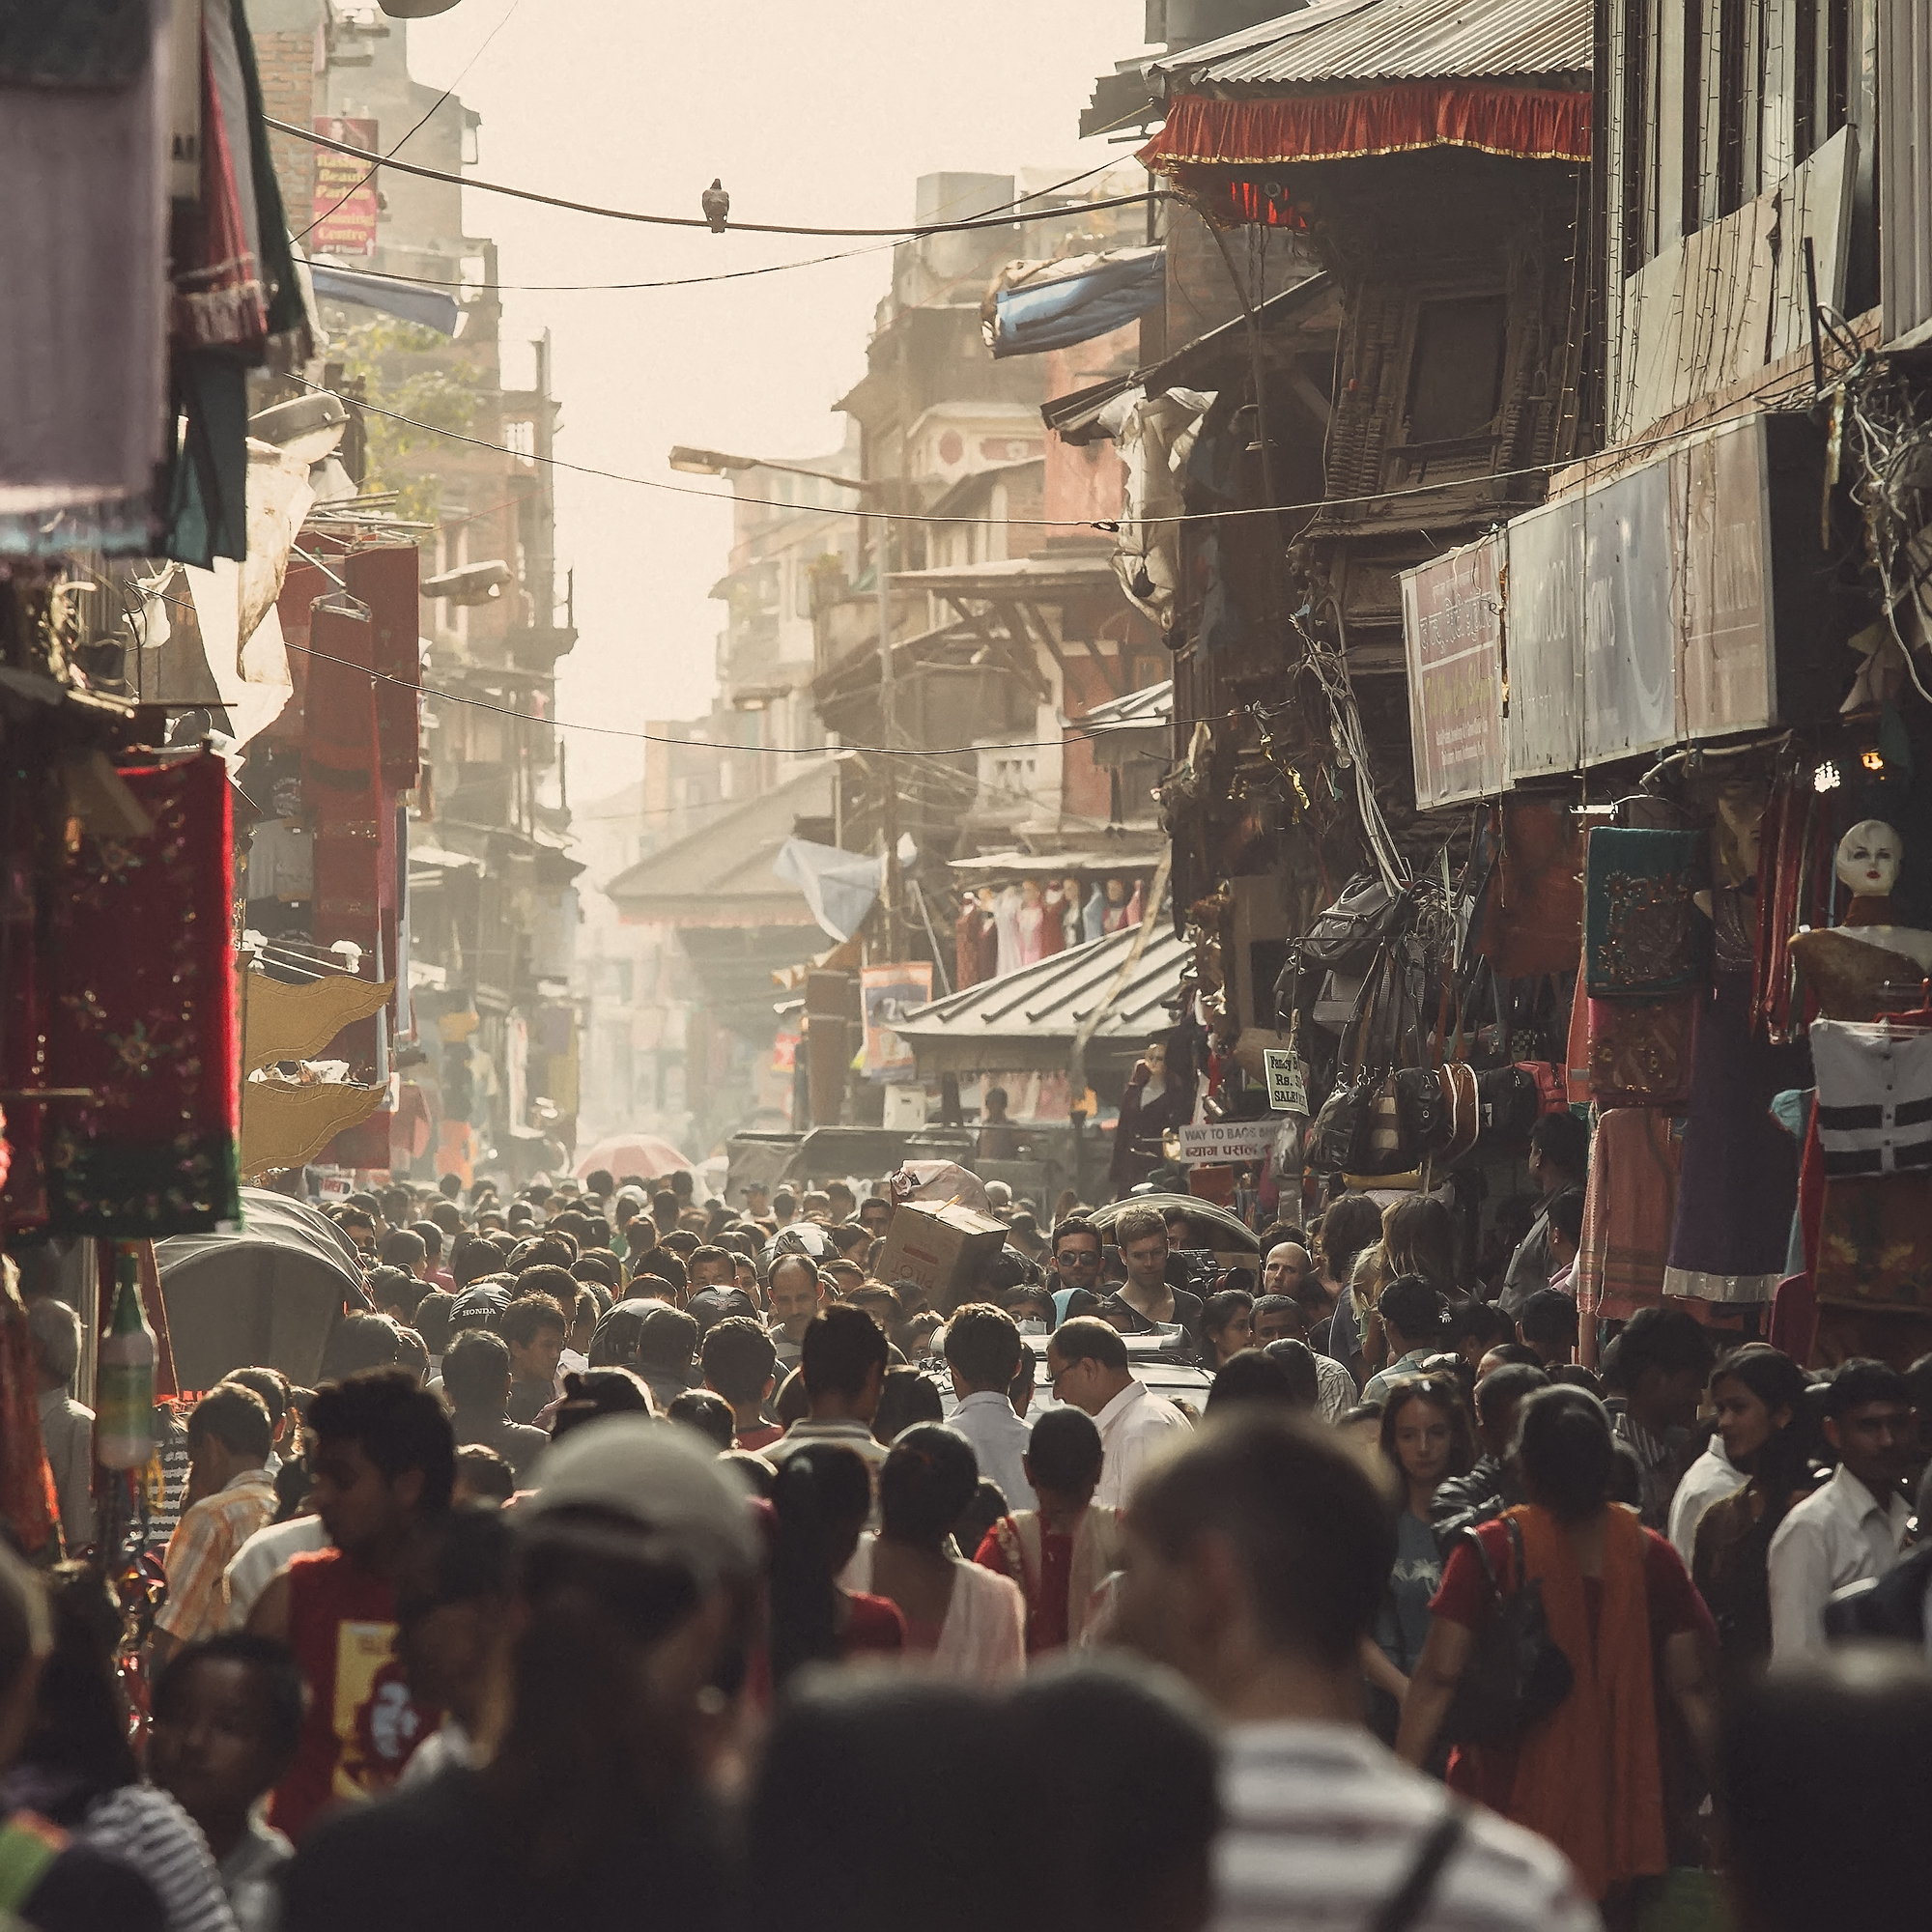
Income inequality is spoken about often in the United States. But it is more than just an American issue. To find the 50 most unequal countries in the world, 24/7 Wall St. reviewed the World Inequality Database’s World Inequality Report 2022, which ranks countries by the ratio of the top 10% average income to the bottom 50% – or T10/B50.
Click here to see the countries with the biggest income gaps
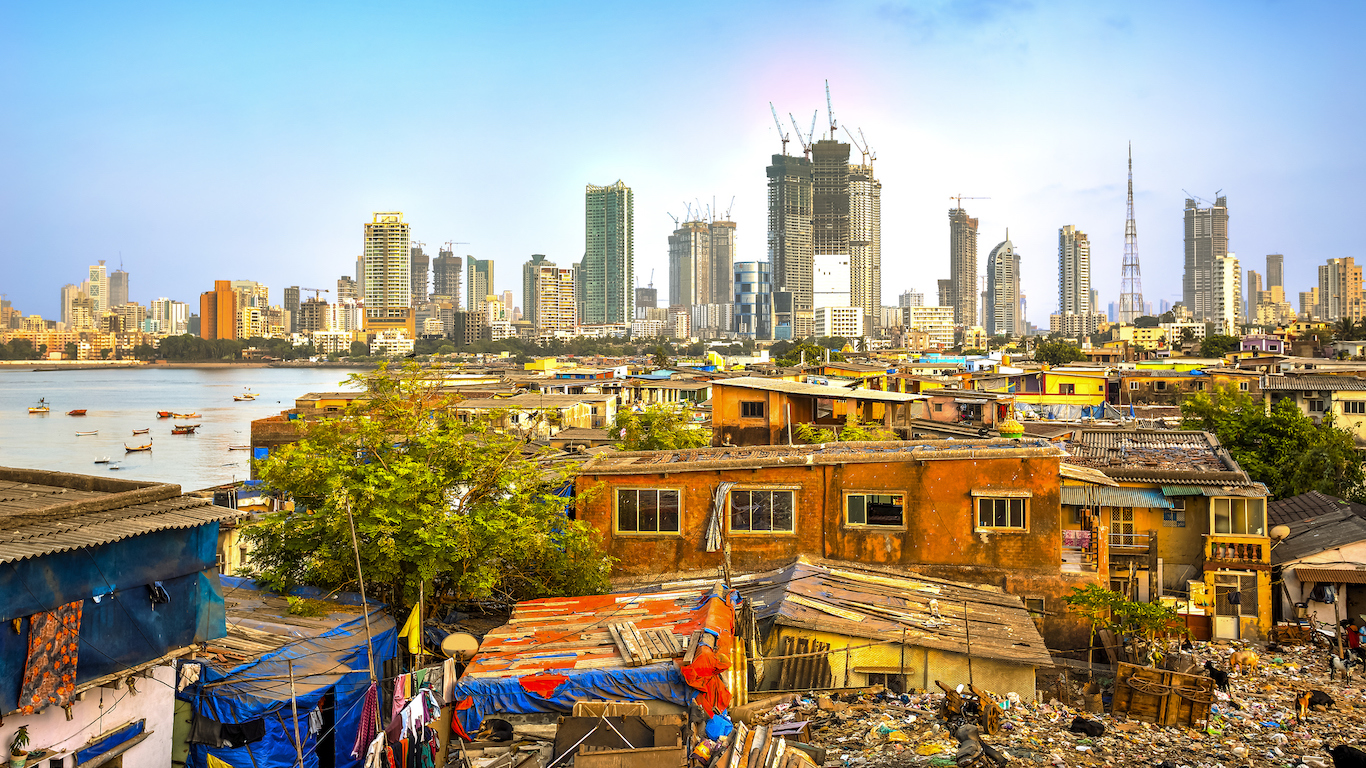
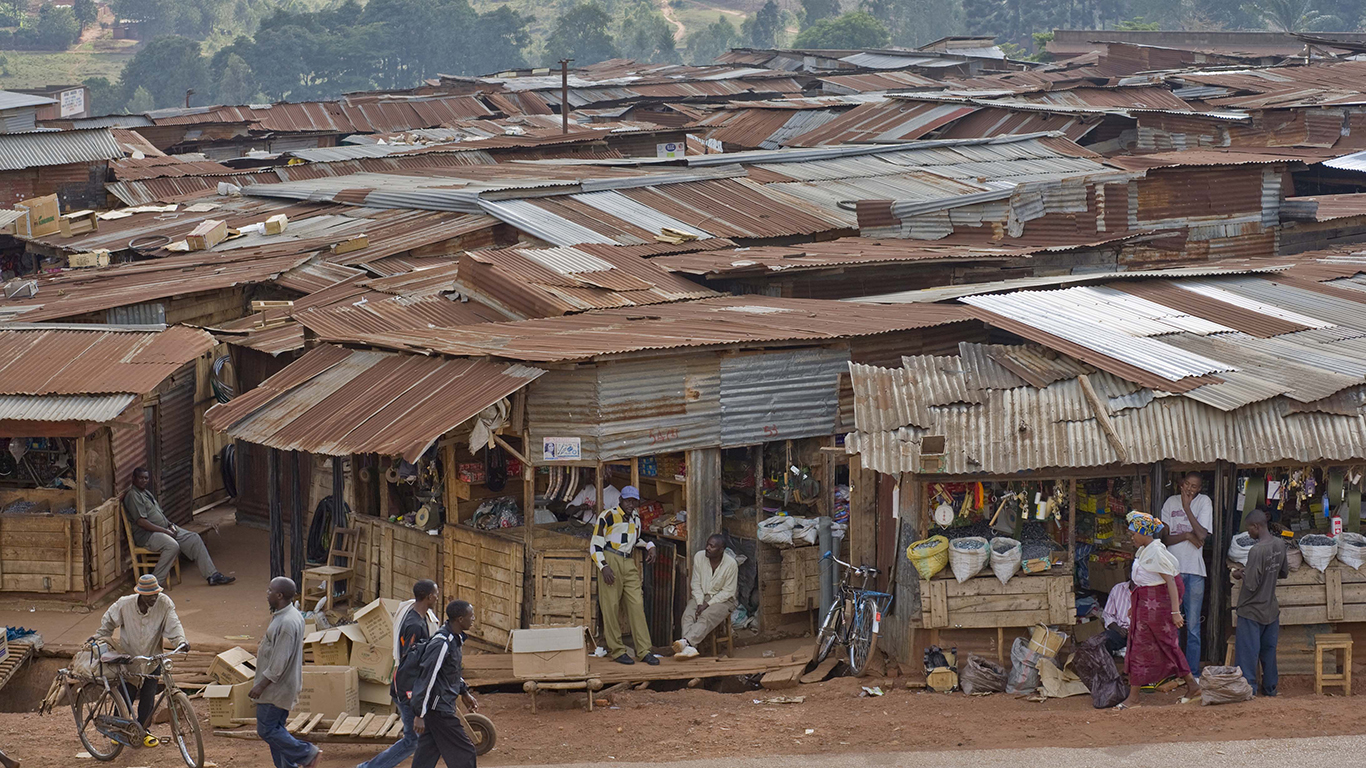
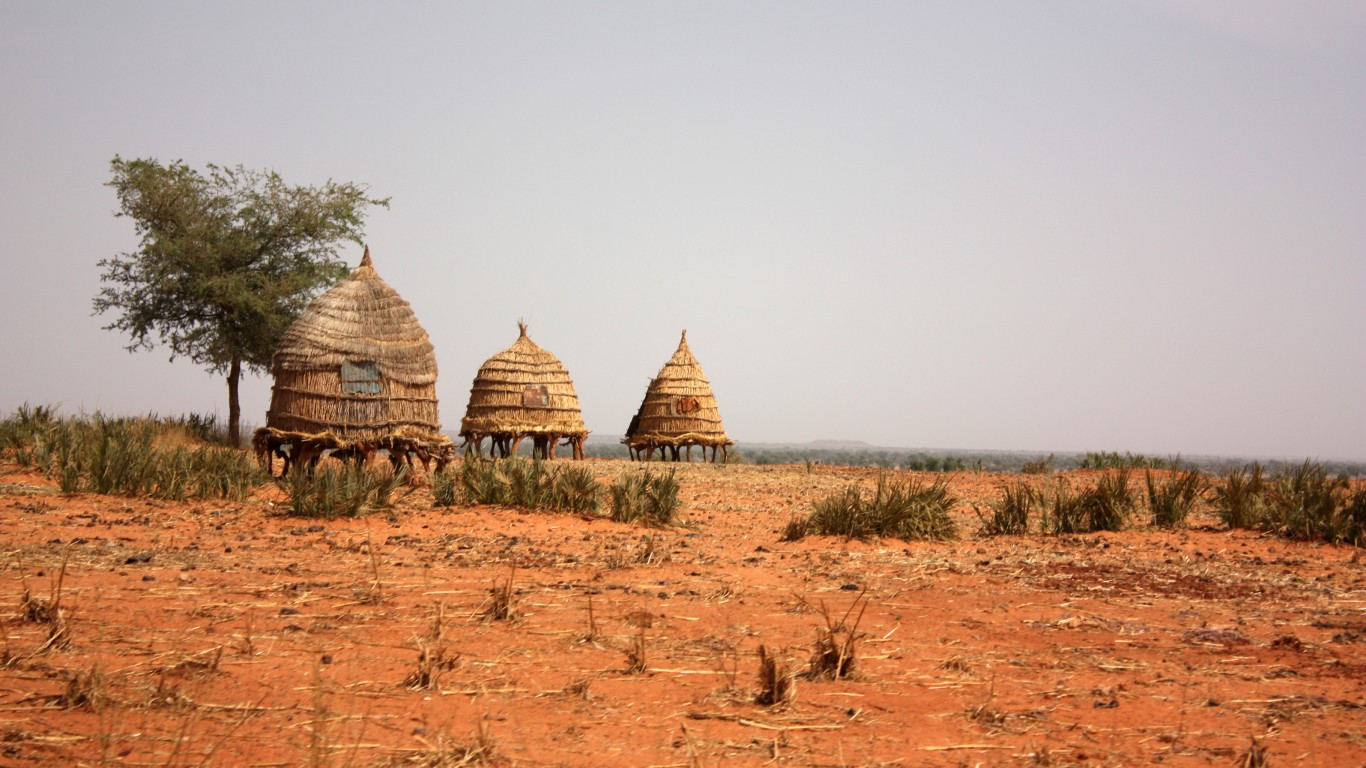
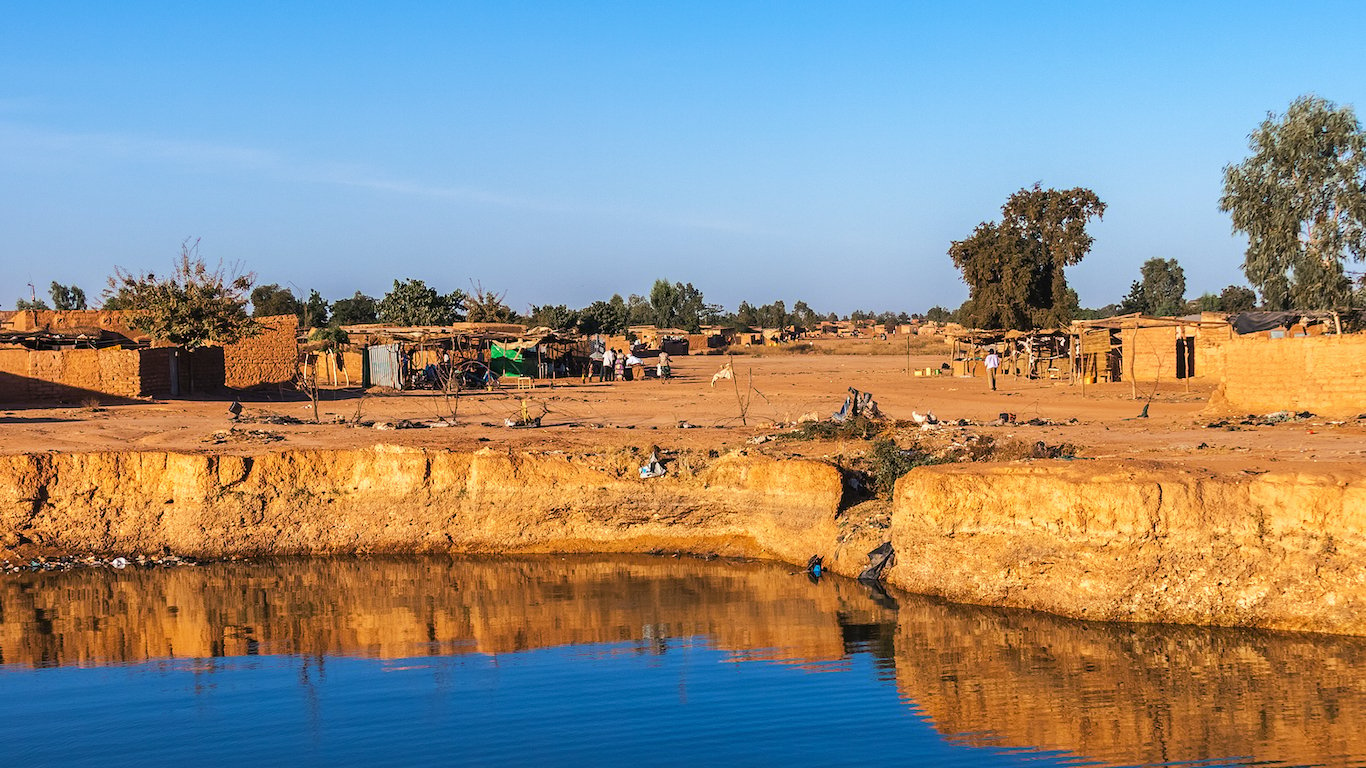
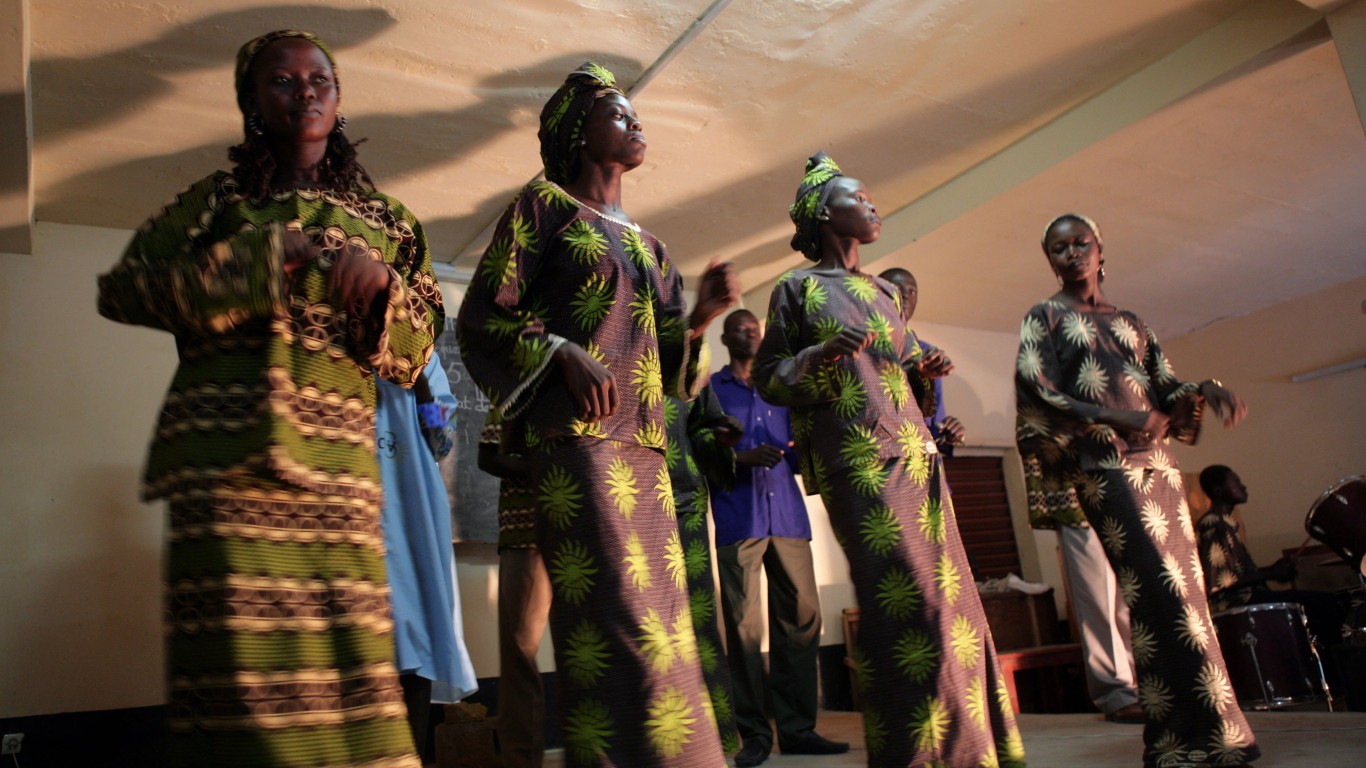
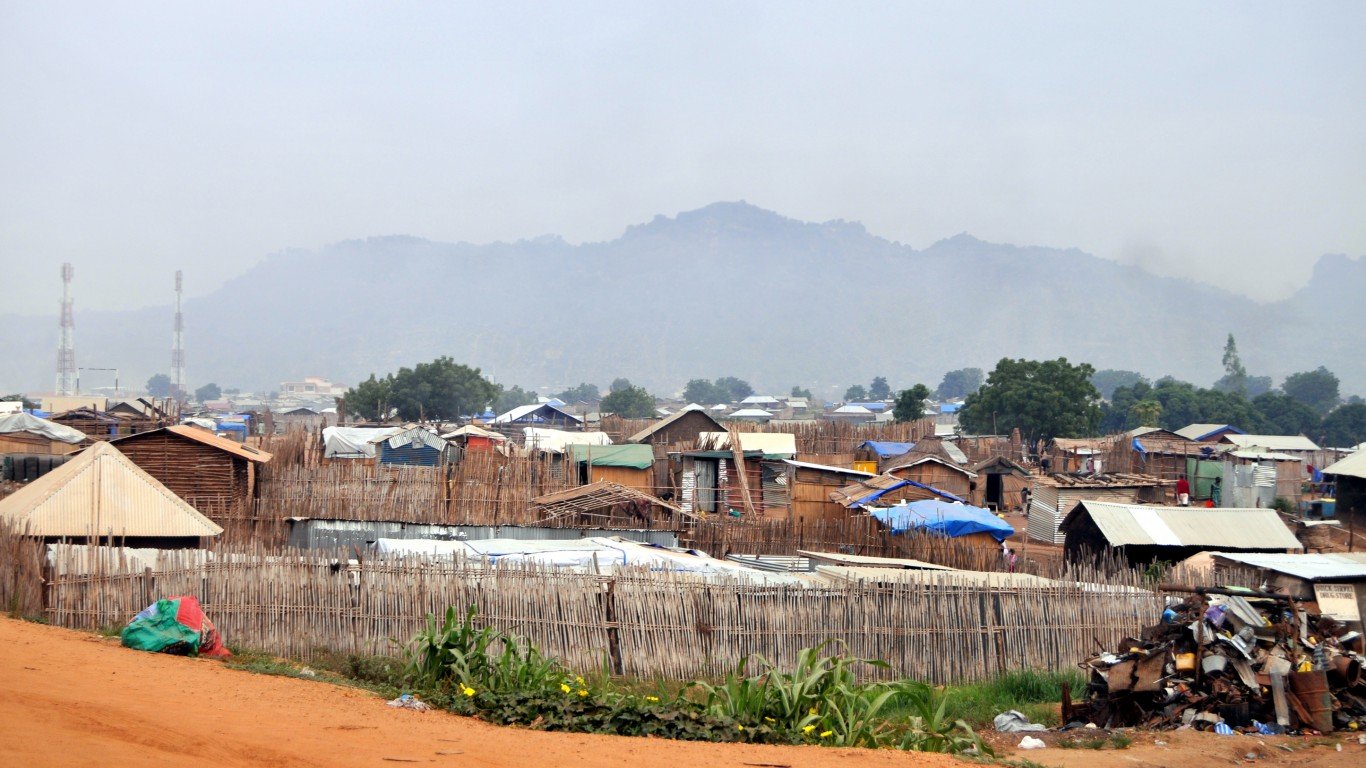
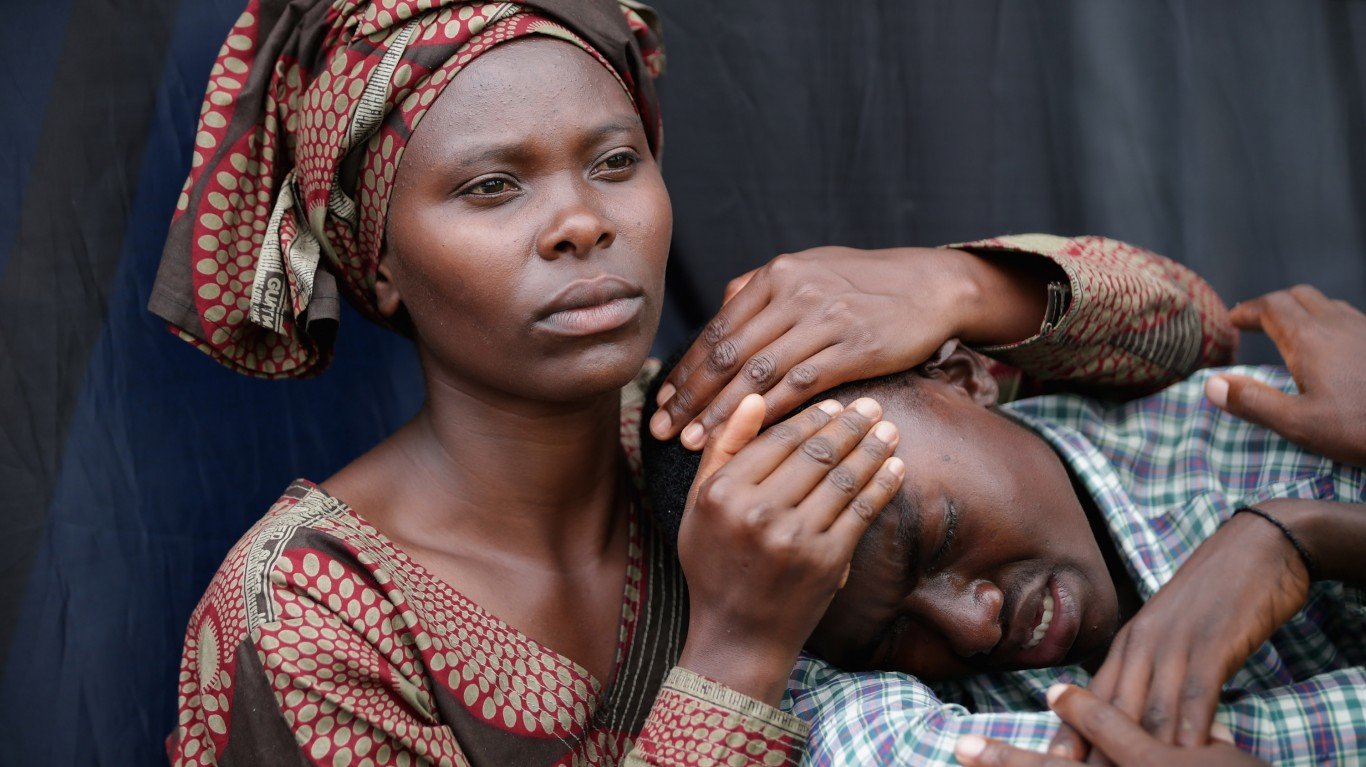
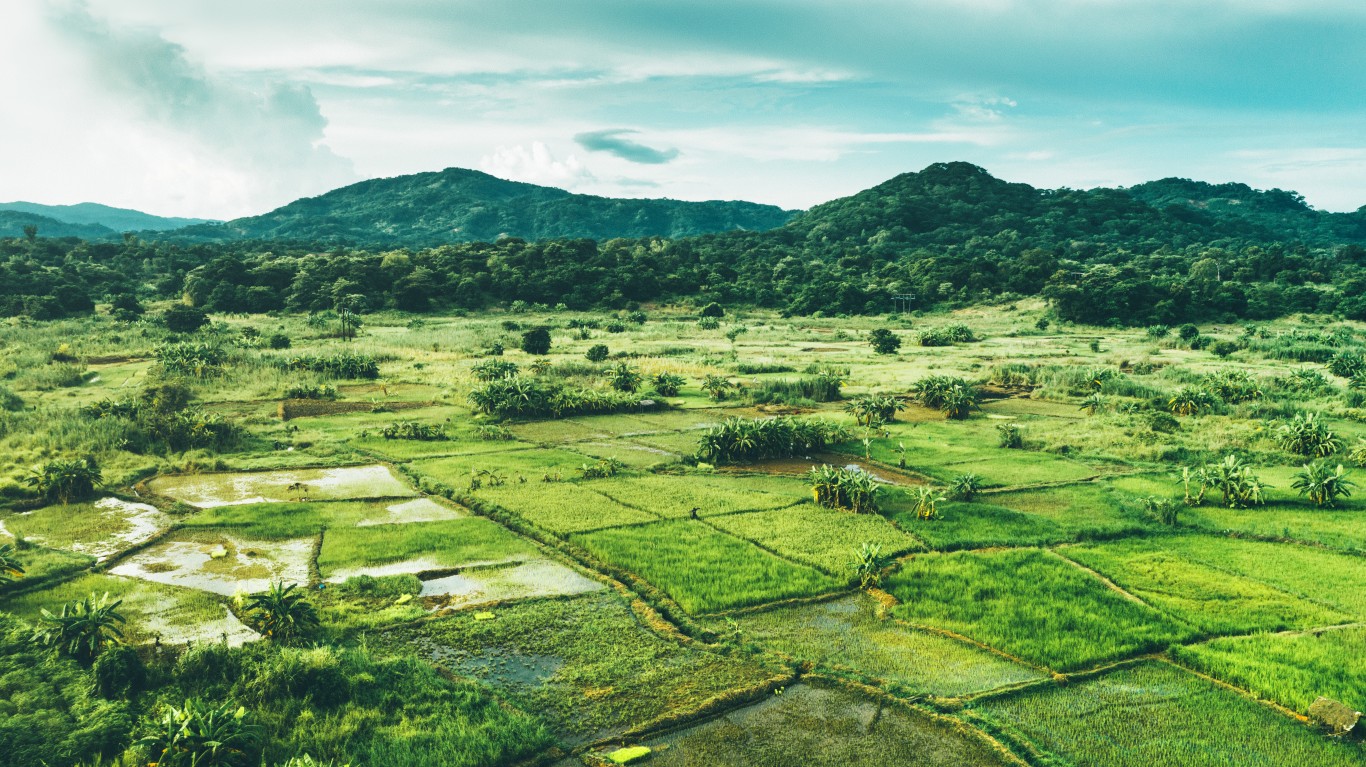
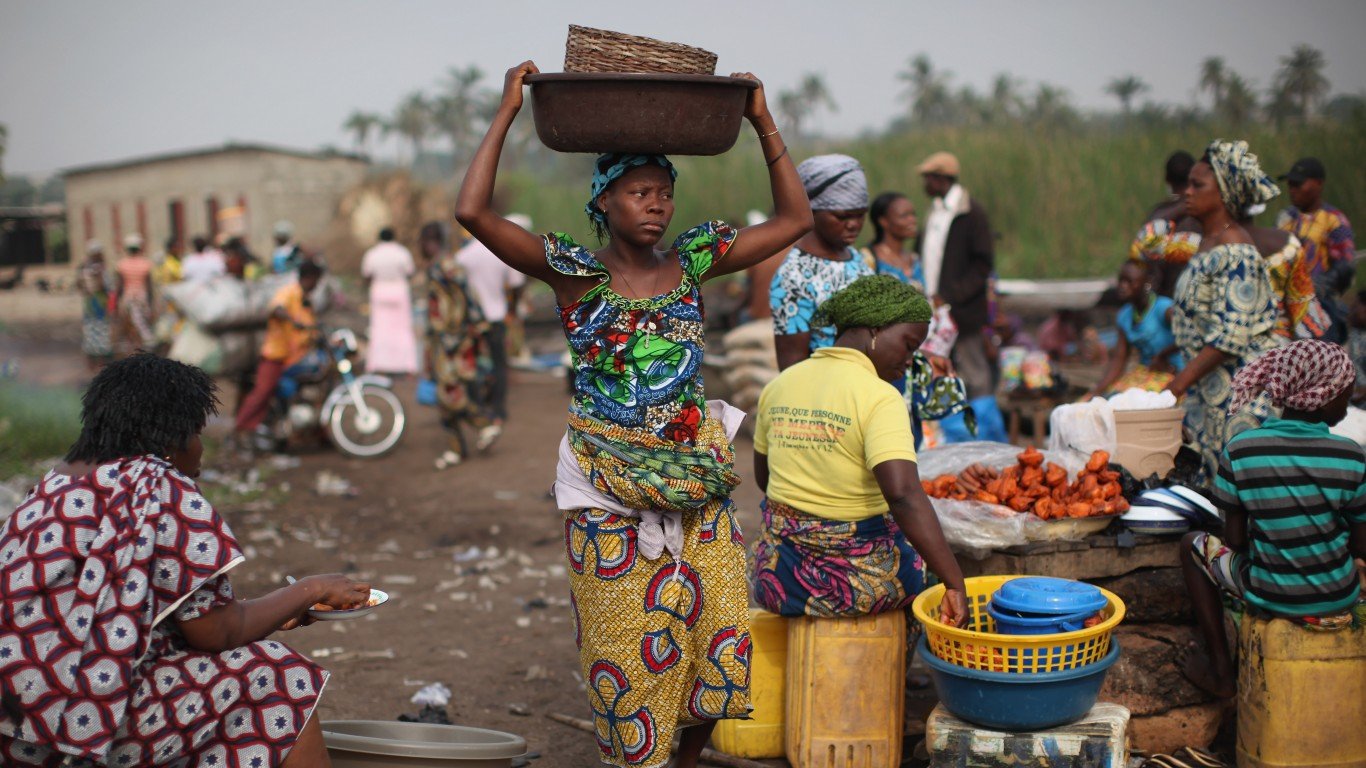
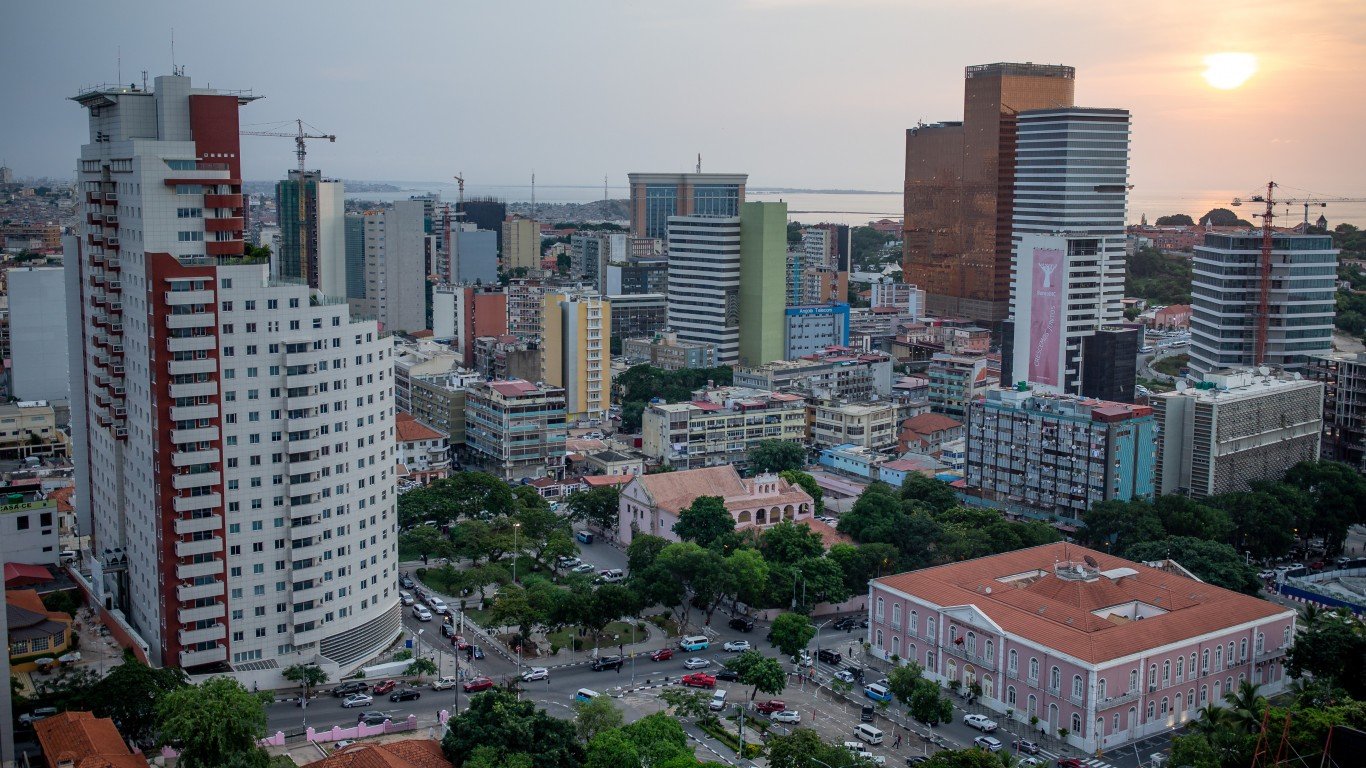
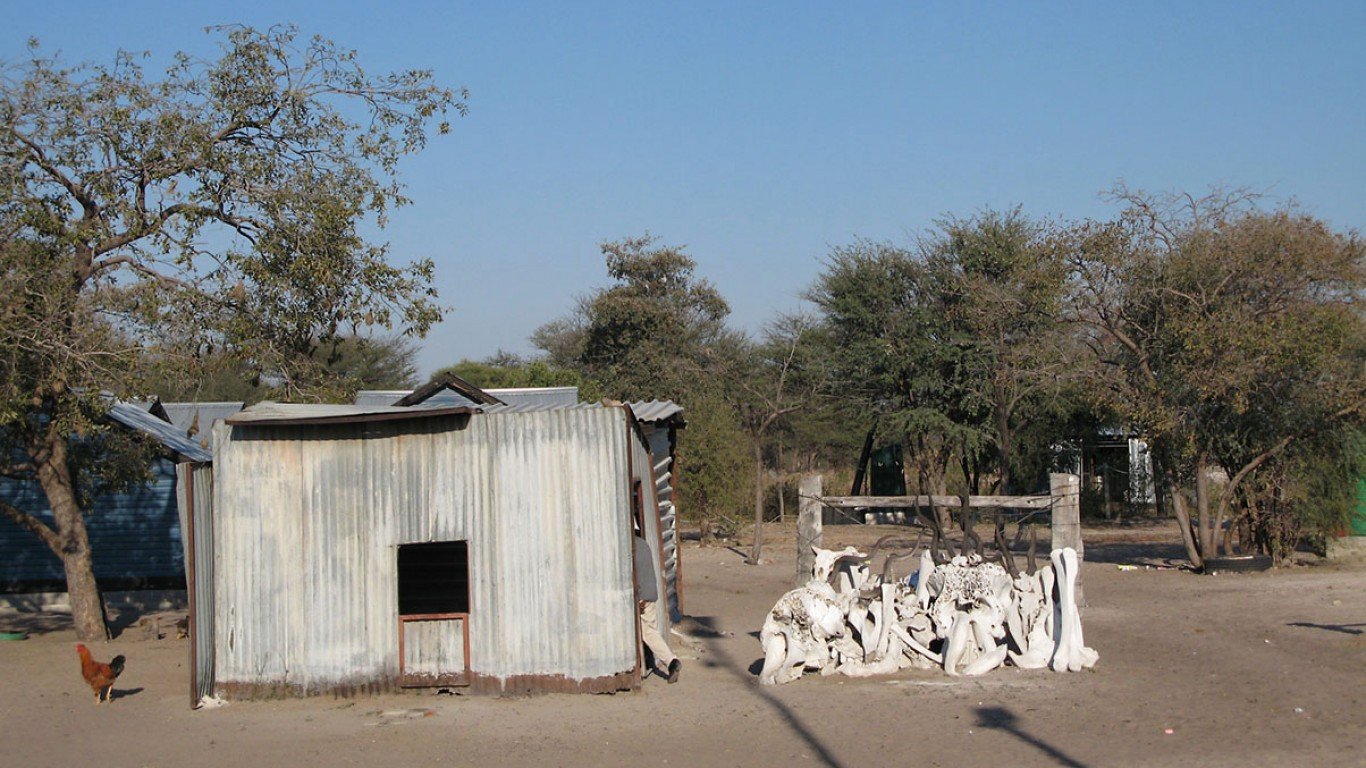
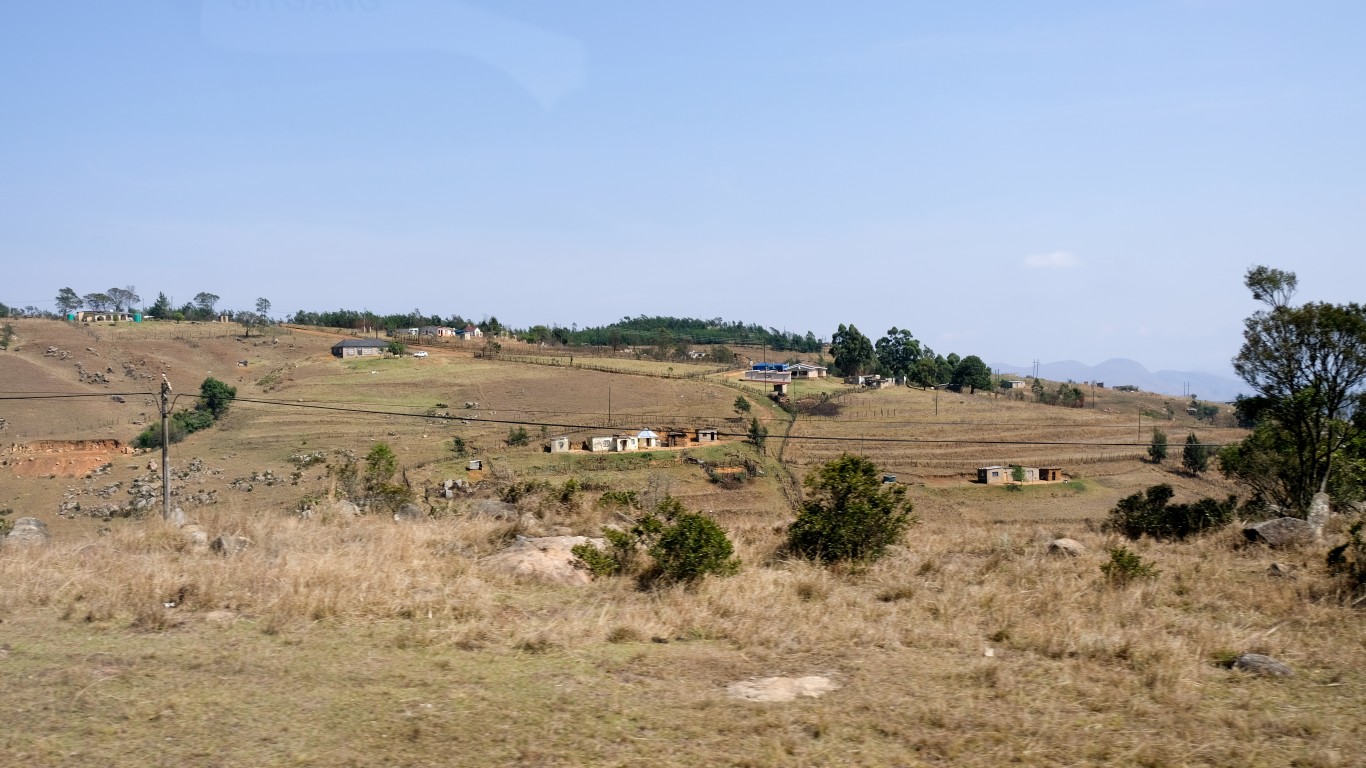
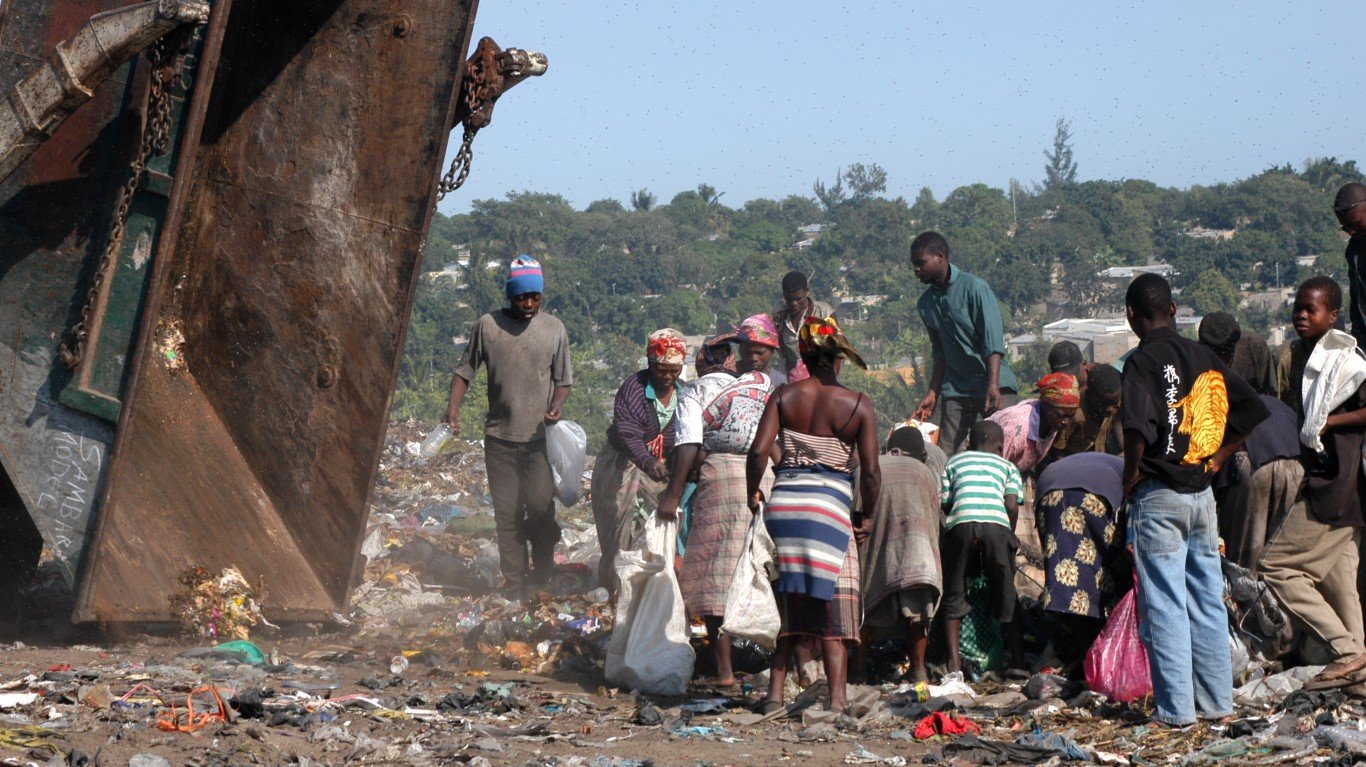
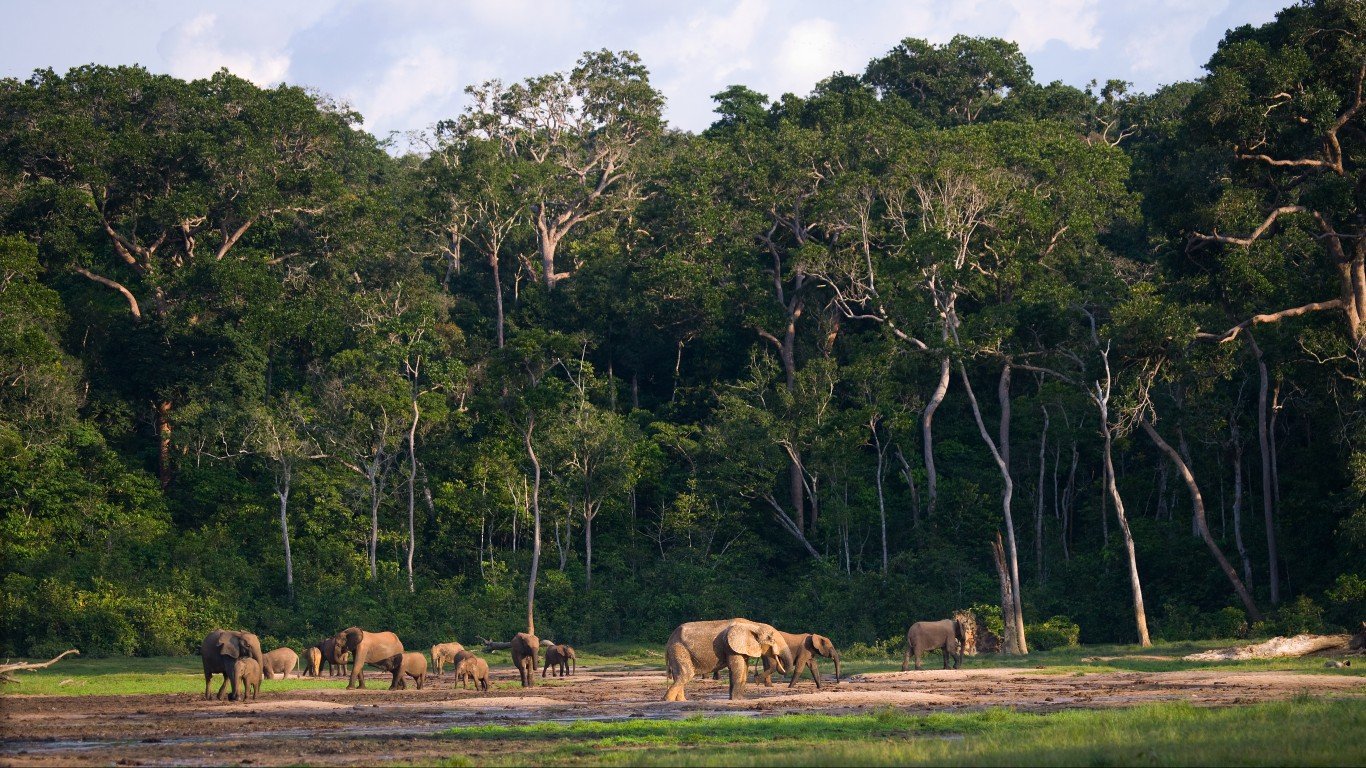
Wide wealth gaps occur on every continent, but they are most pronounced in Africa and Asia. Many countries in those places suffer from a legacy of colonization and prolonged civil conflict. Despite an abundance of resources in some of them, government corruption has placed wealth in the hands of a few, and mismanagement of revenue from energy resources has not been spent on infrastructure, the healthcare system, or education.
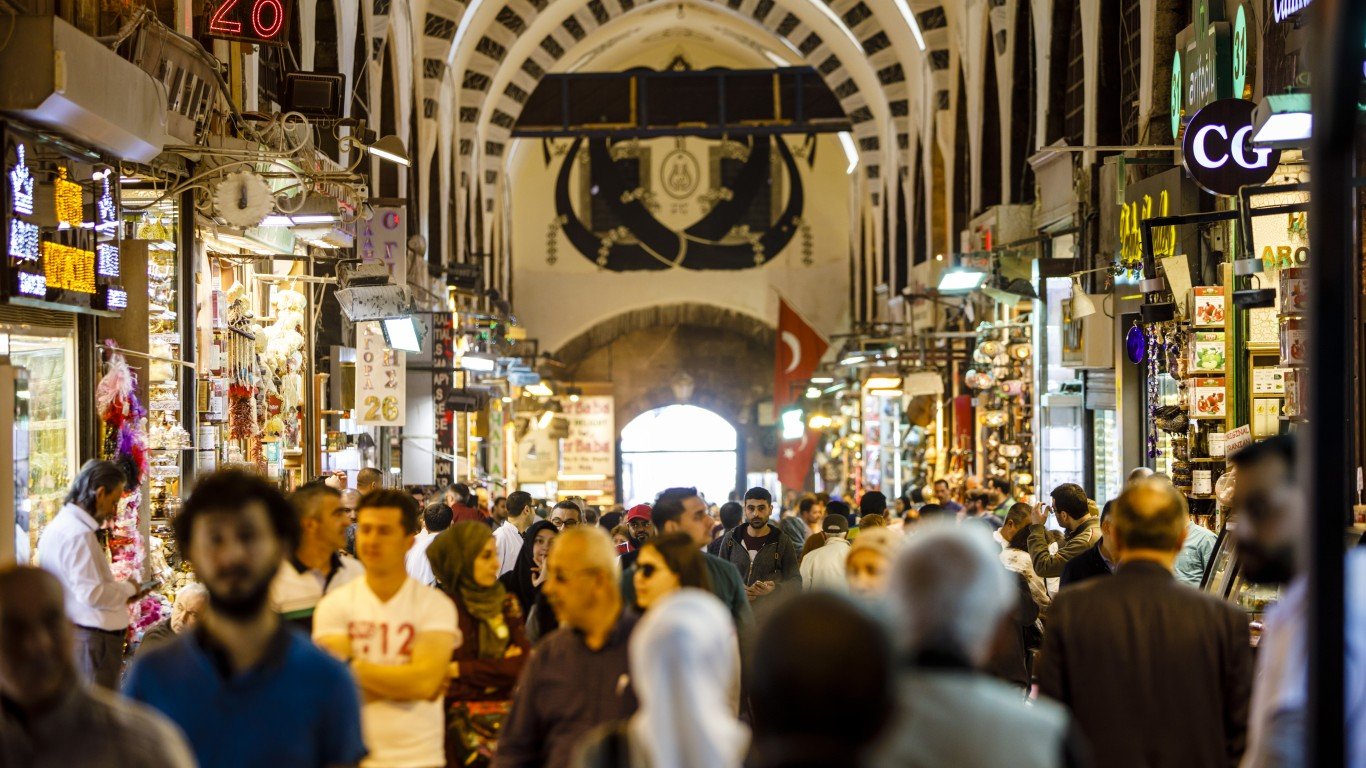
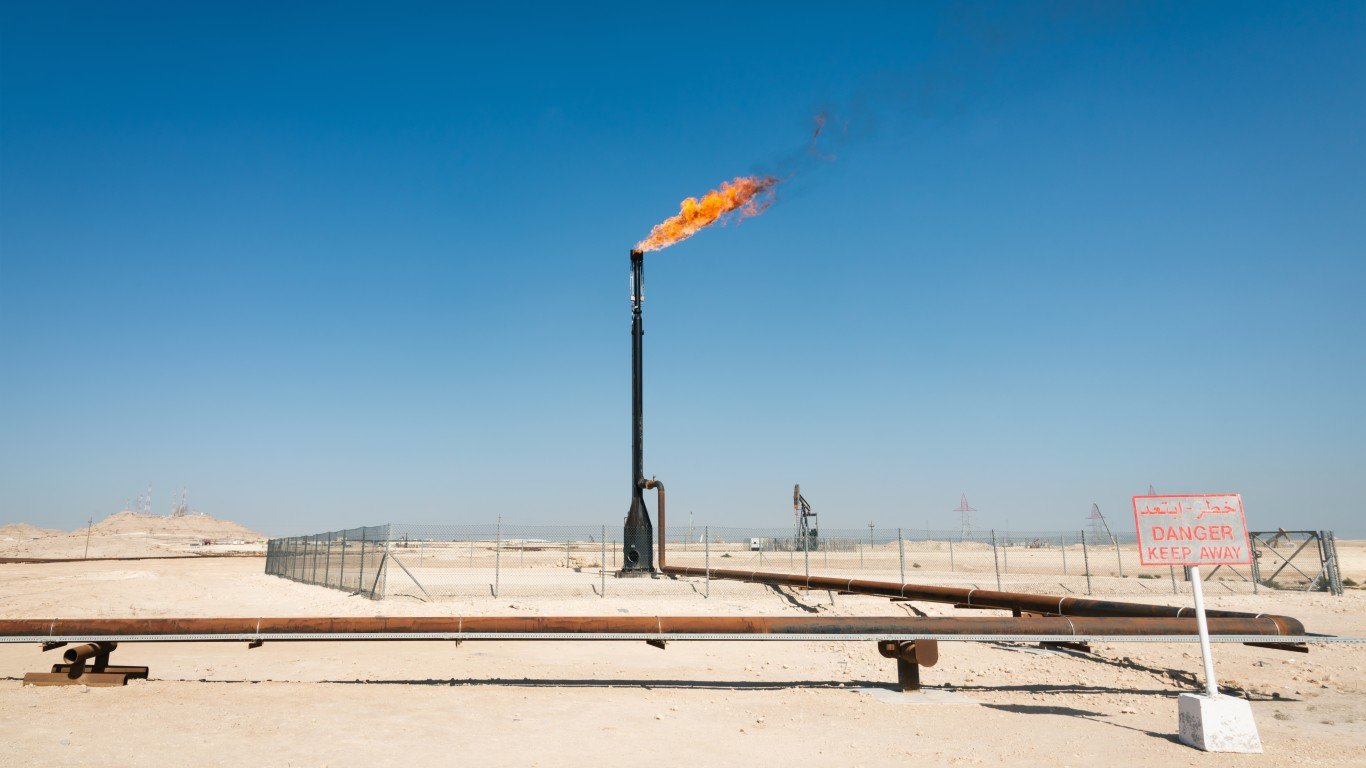
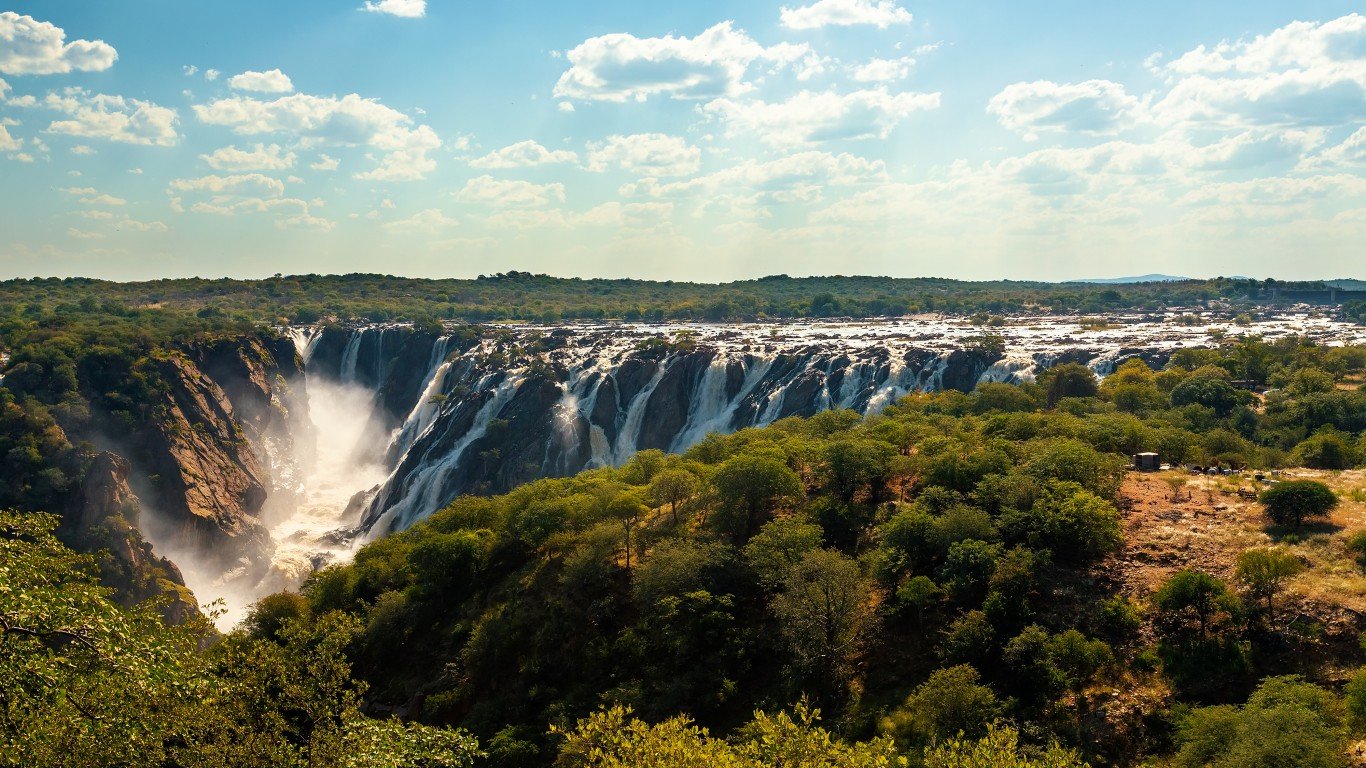
Other countries, such as those on the Arabian Peninsula and Ghana in Africa, have tapped their resources to stimulate rapidly developing economies. But the benefits of economic development have not necessarily flowed to all segments of society. (Income equality is far from a given, even in the 15 richest countries in the world.)
To find the 50 most unequal countries in the world, 24/7 Wall St. used data on income, wealth and inequality from the World Inequality Database’s World Inequality Report 2022. Countries were ranked by the ratio of the top 10% average income to the bottom 50% average income – or T10/B50. For example, in the U.S., the top 10% earns on average 17 times more than the bottom 50%. All 174 countries in the report were considered for the pre-tax income data, and all data is as of 2021.
Wealth gap and average income data is also from the report, and reflect the 150 countries for which data was available. Average income is defined in the report as “the sum of all pretax personal income flows accruing to the owners of the production factors, labor and capital, including social insurance benefits (and removing corresponding contributions), but excluding other forms of redistribution (income tax, social assistance benefits, etc.)” The report uses purchasing power parity for inequality estimates. Estimates correct for inflation using the national income deflator (base 2021).
50. Indonesia
> Pre-tax income gap, top 10% / bottom 50%: 19.37
> Household pre-tax income top 10%: 48% — #78 highest of 174 countries
> Household pre-tax income bottom 50%: 12.39% — #45 lowest of 174 countries
> Wealth gap, top 10% / bottom 50%: 55.13 — #101 highest of 150 countries
> Average income: $11,334 — #63 lowest of 150 countries
Income inequality has been accelerating in Indonesia, the world’s fourth-most populous country, with more than 273 million people. The country is burdened by inadequate infrastructure and corruption, and resources are not allocated equally. Oxfam reports that the four richest men in this Asian archipelago have more wealth than the combined total of the poorest 100 million people.
[in-text-ad]
49. Togo
> Pre-tax income gap, top 10% / bottom 50%: 19.64
> Household pre-tax income top 10%: 47.98% — #79 highest of 174 countries
> Household pre-tax income bottom 50%: 12.22% — #42 lowest of 174 countries
> Wealth gap, top 10% / bottom 50%: 58.48 — #96 highest of 150 countries
> Average income: $2,510 — #10 lowest of 150 countries
This Western African nation of 8.3 million embarked on a campaign in 2009 to reduce poverty. One aspect of the effort was to address undernourishment, which declined from 36.8% in the 1990-1995 period to 11.4% between 2010 and 2015, according to a Hunan University School of Economics paper. Average income is $2,510, 10th lowest of any of the countries on this list.
[recirclink id=970877]
48. Cabo Verde
> Pre-tax income gap, top 10% / bottom 50%: 19.83
> Household pre-tax income top 10%: 49.08% — #53 highest of 174 countries
> Household pre-tax income bottom 50%: 12.38% — #44 lowest of 174 countries
> Wealth gap, top 10% / bottom 50%: 65.63 — #64 highest of 150 countries
> Average income: Not available
This island nation in the Atlantic off of Western Africa relies on tourism and remittances from those who have emigrated to the U.S. and other countries. Unemployment is high and the government is trying to diversify the economy. Agriculture as a part of the economy is limited by poor soil on the islands.
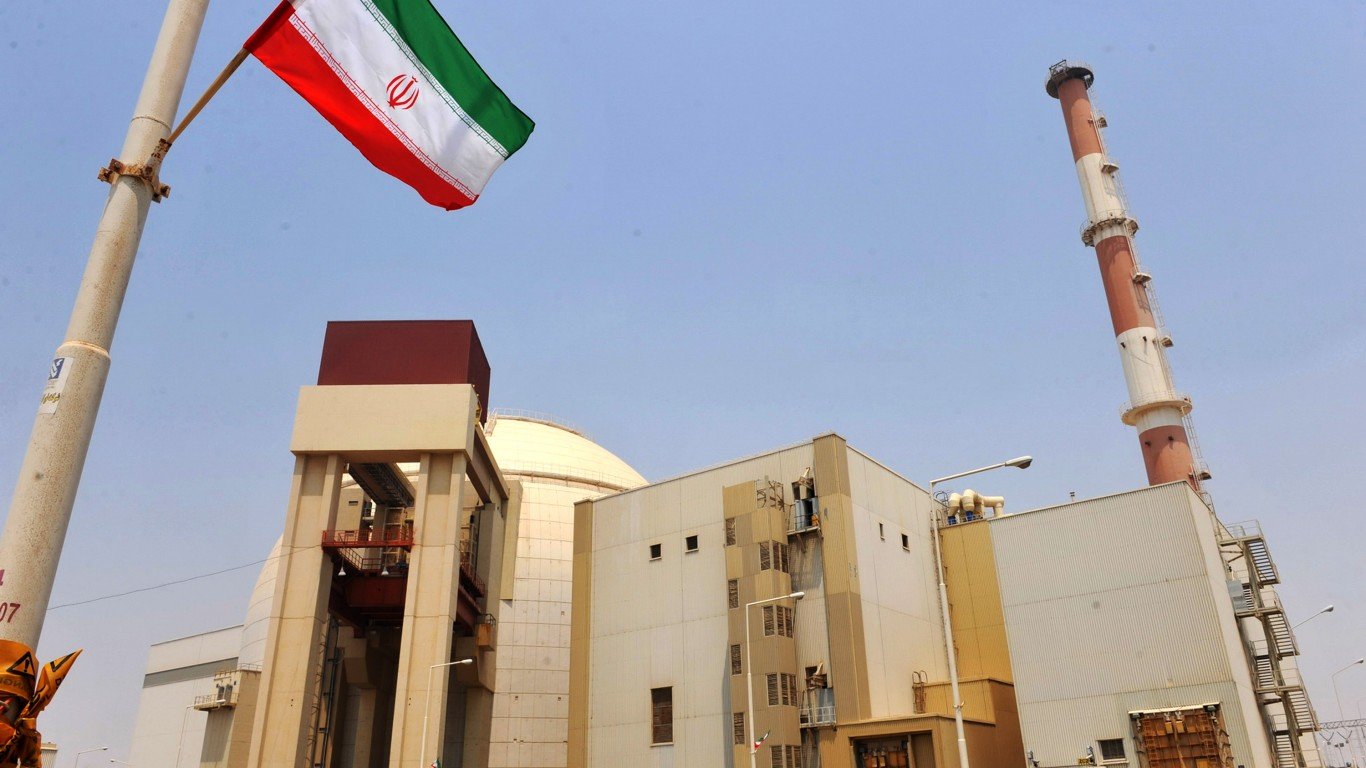
47. Iran
> Pre-tax income gap, top 10% / bottom 50%: 19.83
> Household pre-tax income top 10%: 52.66% — #29 highest of 174 countries
> Household pre-tax income bottom 50%: 13.28% — #73 lowest of 174 countries
> Wealth gap, top 10% / bottom 50%: 62.18 — #73 highest of 150 countries
> Average income: $17,285 — #62 highest of 150 countries
Income inequality in Iran can be attributed to poor allocation of public funds generated by oil revenue. Virtually all citizens in the republic receive some form of welfare or government cash transfers. There also is widespread tax evasion and corruption in this nation of almost 84 million.
[in-text-ad-2]
45. Tanzania
> Pre-tax income gap, top 10% / bottom 50%: 19.84
> Household pre-tax income top 10%: 51.37% — #36 highest of 174 countries
> Household pre-tax income bottom 50%: 12.95% — #68 lowest of 174 countries
> Wealth gap, top 10% / bottom 50%: 93.33 — #43 highest of 150 countries
> Average income: $4,311 — #25 lowest of 150 countries
Tanzania, a former British colony with a population of about 60 million, has enjoyed strong economic growth in recent years, spurred by growth in the financial sector. But the economic benefits have not been spread widely. This East African nation on the Indian Ocean has an average income of $4,311, 25th lowest on the list. Housing affordability is also an issue in Tanzania.

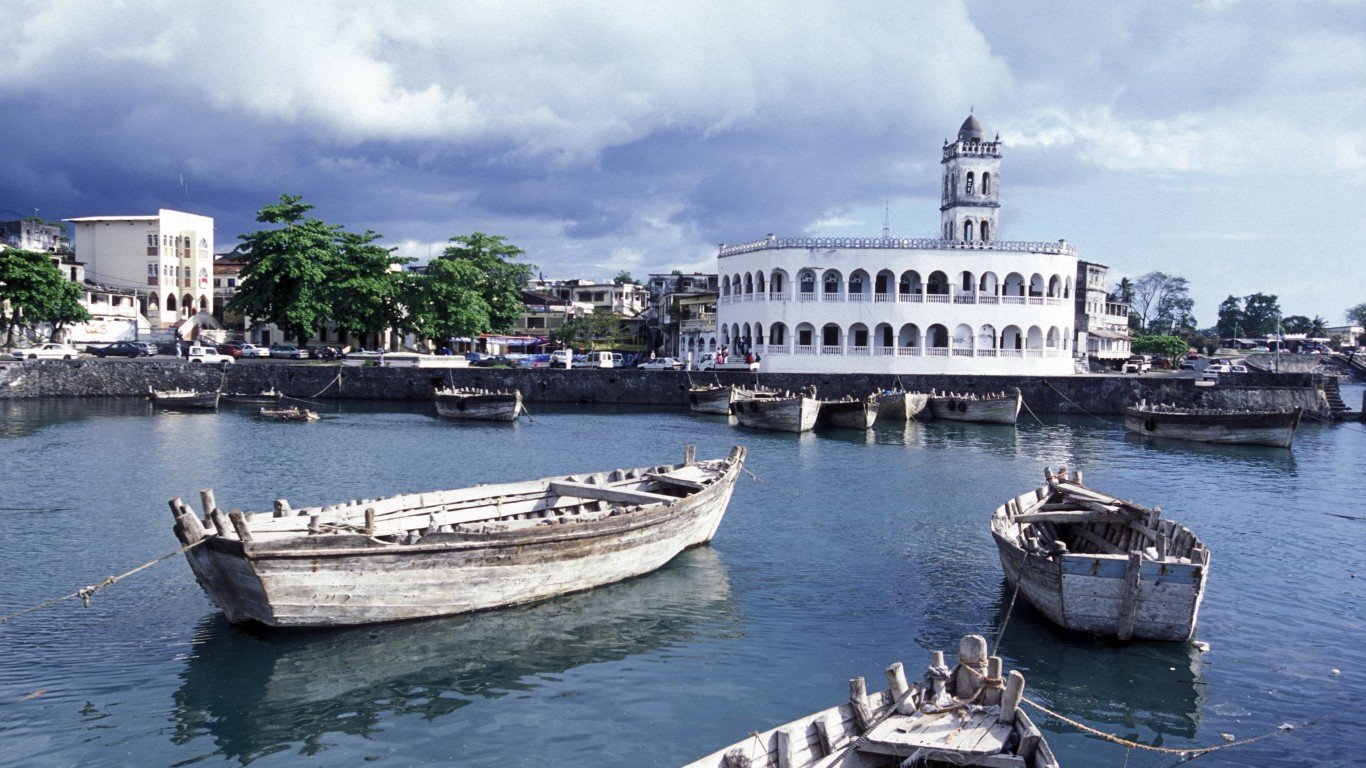
45. Zanzibar
> Pre-tax income gap, top 10% / bottom 50%: 19.84
> Household pre-tax income top 10%: 51.37% — #36 highest of 174 countries
> Household pre-tax income bottom 50%: 12.95% — #68 lowest of 174 countries
> Wealth gap, top 10% / bottom 50%: — # of 150 countries
> Average income: Not available
Zanzibar is an semi-autonomous island area that is part of Tanzania. A Unicef report from 2020 said the nation’s economy grew in real terms by 30.6% from 2015 to 2019. The region is dependent on tourism, which has been hurt by the pandemic, and is looking to diversify its economy. Half of Zanzibar’s population of an estimated 1.6 million is under age 18, and at least two-thirds of Zanzibar’s children live in poverty, according to UNICEF.
[in-text-ad]
44. Ghana
> Pre-tax income gap, top 10% / bottom 50%: 20.03
> Household pre-tax income top 10%: 48.91% — #57 highest of 174 countries
> Household pre-tax income bottom 50%: 12.21% — #41 lowest of 174 countries
> Wealth gap, top 10% / bottom 50%: 63.33 — #70 highest of 150 countries
> Average income: $5,740 — #38 lowest of 150 countries
Ghana has benefited from strong economic growth since the discovery of offshore oil. However, the gap between rich and poor in this African nation of more than 31 million has been rising, according to UNICEF. The annual rate of reduction of the poverty level slowed from an average of percentage points per year in the 1990s to 1.1 per year reduction since 2006.
[recirclink id=913857]
43. Chad
> Pre-tax income gap, top 10% / bottom 50%: 20.05
> Household pre-tax income top 10%: 49.30% — #52 highest of 174 countries
> Household pre-tax income bottom 50%: 12.30% — #43 lowest of 174 countries
> Wealth gap, top 10% / bottom 50%: 67.81 — #62 highest of 150 countries
> Average income: $3,369 — #16 lowest of 150 countries
Average income in this Central African nation of more than 16 million people is $3,369, 16th lowest on the list. Because Chad is landlocked, transportation of goods is expensive and it relies on good relations with its neighbors. Some 60% of its export revenue is from oil, and a slump in oil prices has reduced government financial assistance to the country’s poorest residents.
42. Madagascar
> Pre-tax income gap, top 10% / bottom 50%: 20.33
> Household pre-tax income top 10%: 50.76% — #39 highest of 174 countries
> Household pre-tax income bottom 50%: 12.48% — #46 lowest of 174 countries
> Wealth gap, top 10% / bottom 50%: 82.49 — #50 highest of 150 countries
> Average income: $2,537 — #11 lowest of 150 countries
This island nation in the Indian Ocean had made progress in narrowing income inequality in the early part of the century. But those gains were set back by drops in agricultural profitability and low job creation. A country of 28 million people, it faces infrastructure challenges and possibly calamitous climate events. The World Bank puts its poverty rate at more than 70%.
[in-text-ad-2]
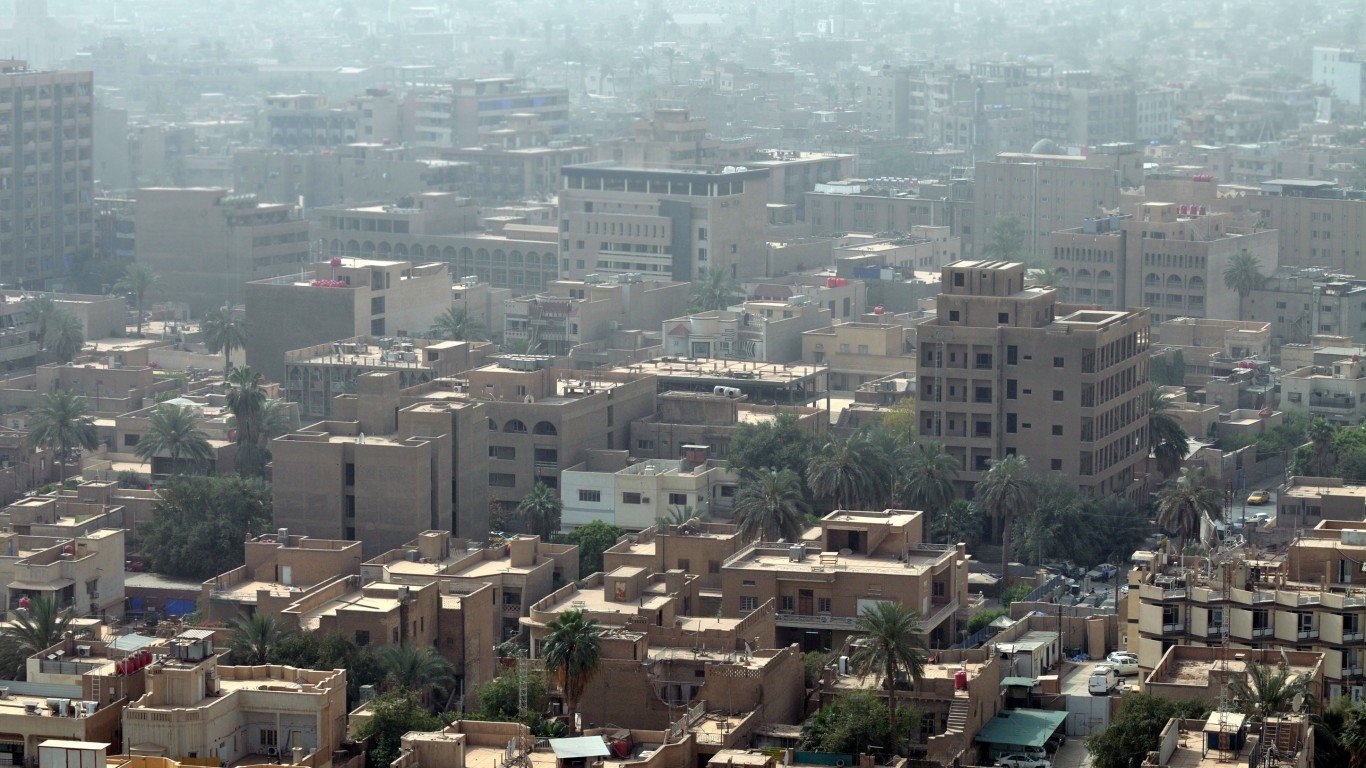
41. Iraq
> Pre-tax income gap, top 10% / bottom 50%: 20.36
> Household pre-tax income top 10%: 51.99% — #33 highest of 174 countries
> Household pre-tax income bottom 50%: 12.77% — #64 lowest of 174 countries
> Wealth gap, top 10% / bottom 50%: 193.12 — #30 highest of 150 countries
> Average income: Not available
Iraq has achieved a degree of stability since the U.S.-led invasion in 2003 toppled Saddam Hussein and prompted a prolonged insurgency. The nation of more than 40 million is overly dependent on oil and Iraq needs to diversify its economy. Unemployment is more than 10 percentage points higher than the pre-COVID levels of 12.7%. Health care is inadequate and corruption is a fact of life in Iraq.
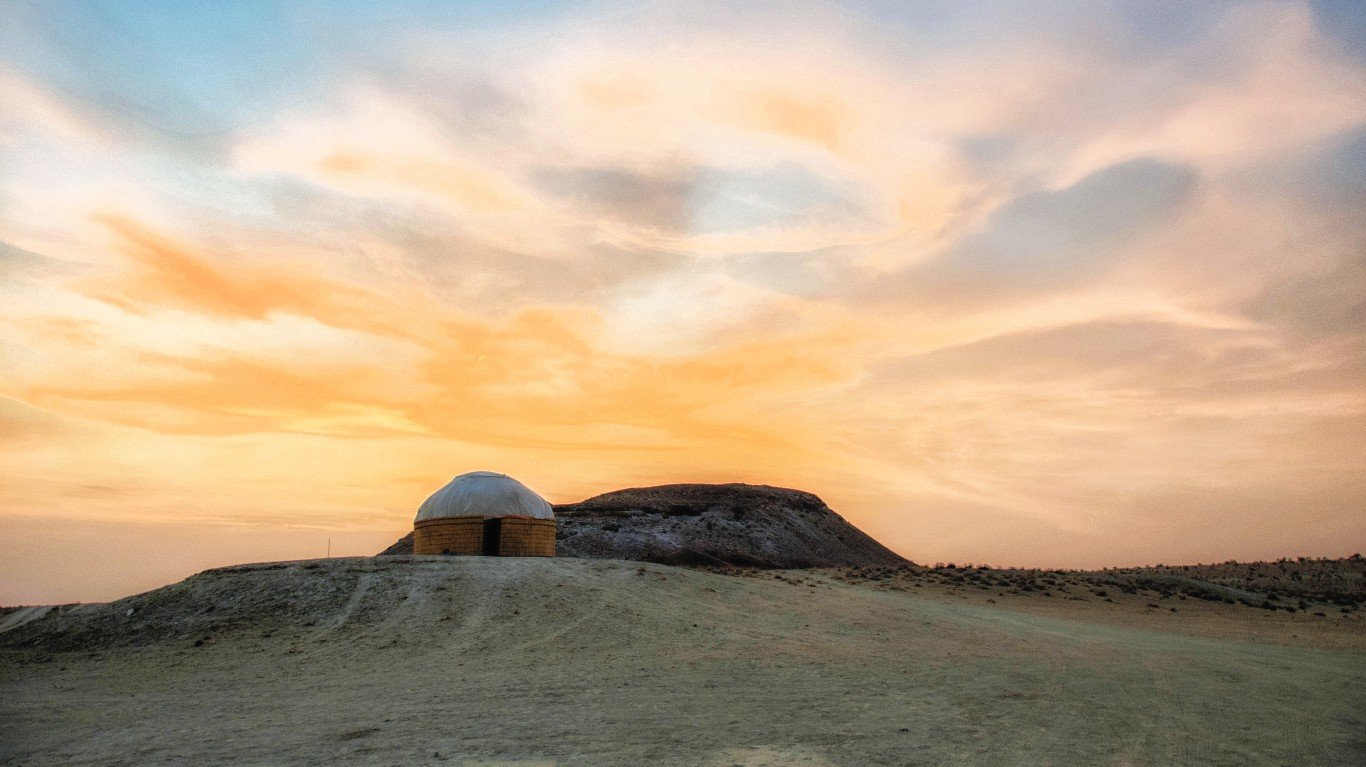
40. Turkmenistan
> Pre-tax income gap, top 10% / bottom 50%: 20.77
> Household pre-tax income top 10%: 49.88% — #44 highest of 174 countries
> Household pre-tax income bottom 50%: 12.01% — #37 lowest of 174 countries
> Wealth gap, top 10% / bottom 50%: 63.68 — #69 highest of 150 countries
> Average income: Not available
There is no shortage of energy resources in this Central Asian nation of about 6 million. It is estimated that Turkmenistan has the fourth-largest natural gas reserves in the world and gas makes up 25% of its exports. Oil is plentiful as well. The government keeps a tight rein on economic activity, limiting private-sector growth. Foreign investment is limited as well. A recent World Bank report stressed that Turkmenistan needs to invest more heavily in human capital to develop.
[in-text-ad]
39. South Sudan
> Pre-tax income gap, top 10% / bottom 50%: 20.99
> Household pre-tax income top 10%: 50.01% — #42 highest of 174 countries
> Household pre-tax income bottom 50%: 11.91% — #35 lowest of 174 countries
> Wealth gap, top 10% / bottom 50%: 68.79 — #60 highest of 150 countries
> Average income: Not available
South Sudan gained its independence in 2011, and since then there has been nothing but armed conflict in this African nation of 11.1 million people. The country has 6,200 miles of road, but only 2% of them are paved, according to the CIA Factbook. Diesel generators produce the nation’s electricity, but only 2% of the population has access to it. Lack of economic diversity is an issue. South Sudan is one of the most oil-dependent countries in the world â 80% of its GDP comes from oil. Potable water is hard to come by. Inflation, government mismanagement, and corruption pervade everyday life.
[recirclink id=1018508]
38. Palestine
> Pre-tax income gap, top 10% / bottom 50%: 21.06
> Household pre-tax income top 10%: 51.21% — #38 highest of 174 countries
> Household pre-tax income bottom 50%: 12.16% — #40 lowest of 174 countries
> Wealth gap, top 10% / bottom 50%: 86.96 — #46 highest of 150 countries
> Average income: Not available
This state of 5.1 million has been hampered by the ongoing pandemic and the conflict with Israel. A World Bank report says the latter factor hinders the Palestinian Authority from collecting tax revenue and by extension makes it difficult to provide services to those on the West Bank and Gaza. Unemployment is high, and the economy is limited by restrictions on trade and access.
37. Uganda
> Pre-tax income gap, top 10% / bottom 50%: 21.47
> Household pre-tax income top 10%: 52.07% — #31 highest of 174 countries
> Household pre-tax income bottom 50%: 12.13% — #39 lowest of 174 countries
> Wealth gap, top 10% / bottom 50%: 111.13 — #36 highest of 150 countries
> Average income: $3,424 — #17 lowest of 150 countries
Known for its breathtaking parks and animal preserves, this African nation of 45.7 million has made strides to improve the lives of its citizens. Revenue from oil has been used to build infrastructure. The soil is fertile and 72% of its workforce toils on farms. But the nation faces issues such as rapid population growth, inadequate power and infrastructure, corruption, and human rights abuses.
[in-text-ad-2]

36. The Seychelles
> Pre-tax income gap, top 10% / bottom 50%: 21.47
> Household pre-tax income top 10%: 52.09% — #30 highest of 174 countries
> Household pre-tax income bottom 50%: 12.13% — #39 lowest of 174 countries
> Wealth gap, top 10% / bottom 50%: 113.24 — #35 highest of 150 countries
> Average income: $26,730 — #39 highest of 150 countries
The smallest nation on this list, with a population of about 100,000, this archipelago in the Indian Ocean has become a tourist magnet, with about 30% of the workforce employed in the tourism industry. That has made its economy vulnerable to sharp downturns in the world economy such as that caused by the pandemic.
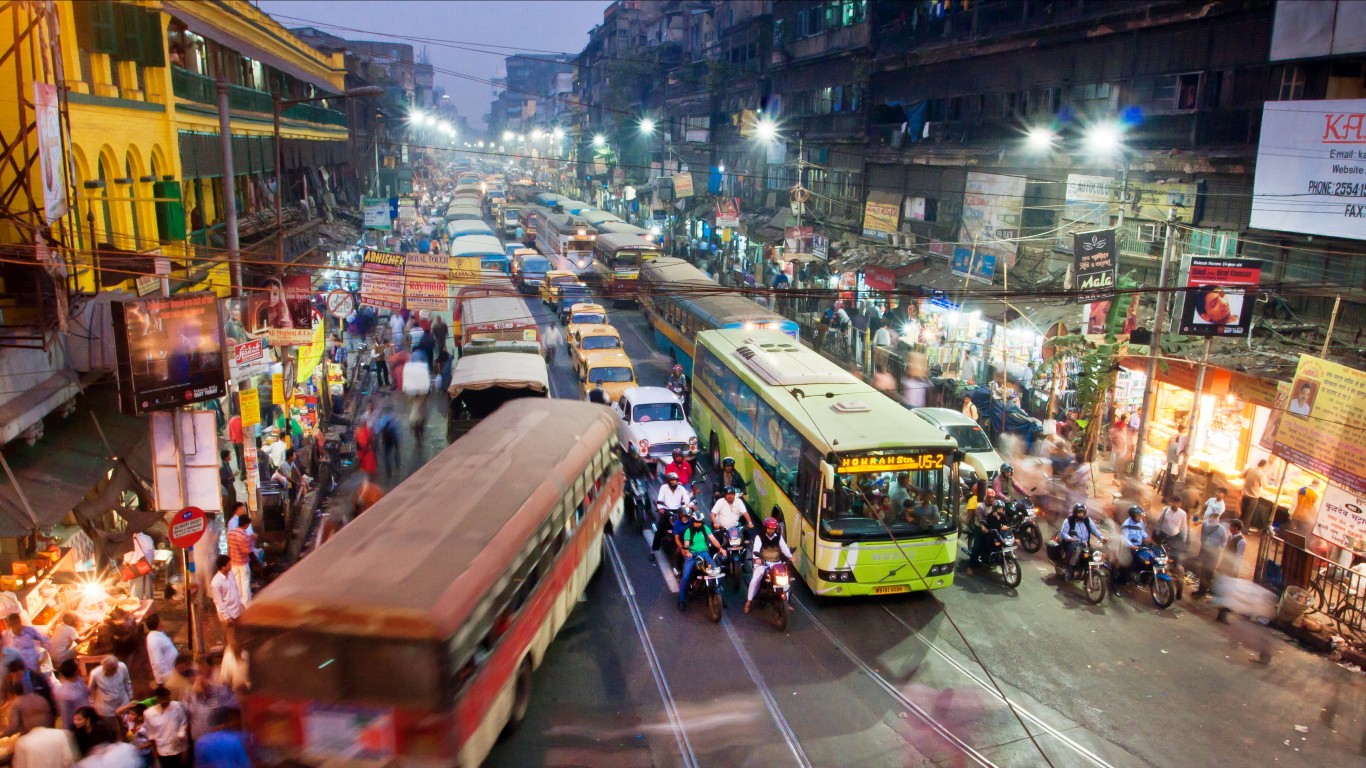
35. India
> Pre-tax income gap, top 10% / bottom 50%: 21.76
> Household pre-tax income top 10%: 57.13% — #17 highest of 174 countries
> Household pre-tax income bottom 50%: 13.13% — #72 lowest of 174 countries
> Wealth gap, top 10% / bottom 50%: 54.78 — #71 lowest of 150 countries
> Average income: $7,095 — #46 lowest of 150 countries
India has experienced a surge in its GDP in recent years as the economic system opened up, became less regulated, and attracted foreign investment. But the world’s second-most populous nation â with 1.4 billion people â is saddled with a plethora of challenges such as inefficient energy distribution, poor transportation, substandard education, and inadequate health care.
[in-text-ad]
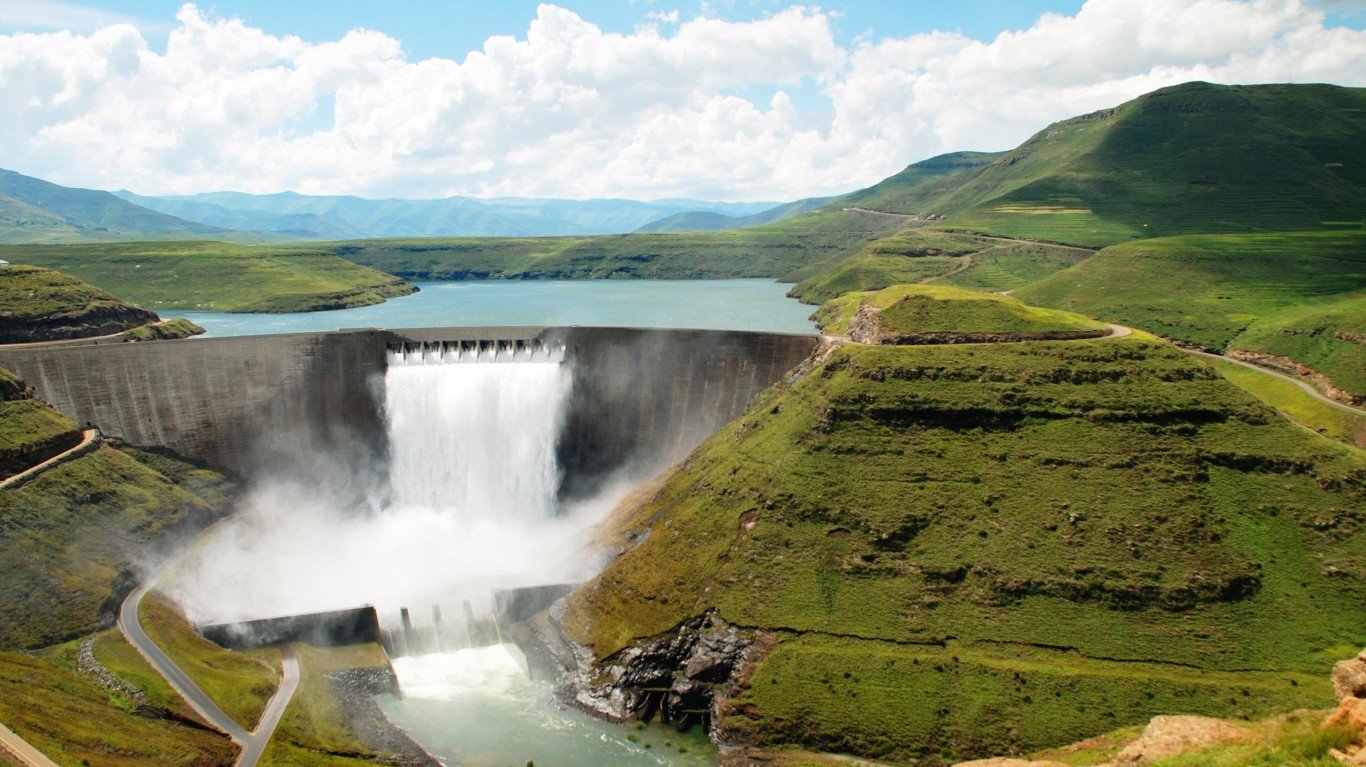
34. Lesotho
> Pre-tax income gap, top 10% / bottom 50%: 21.94
> Household pre-tax income top 10%: 49.51% — #47 highest of 174 countries
> Household pre-tax income bottom 50%: 11.28% — #26 lowest of 174 countries
> Wealth gap, top 10% / bottom 50%: 70.74 — #57 highest of 150 countries
> Average income: $4,728 — #29 lowest of 150 countries
Lesotho has lowered the poverty rate to 49.7% in 2017 from 56.6% in 2002, partly because of social-protection programs that have helped the poor, improved education, and created better-paying jobs in the service sector. The World Bank says 75% of the country is either poor or economically vulnerable. Lesotho produces just 20% of its food needs. A landlocked South Central African country of 2.1 million, it imports 85% of its goods from South Africa.
[recirclink id=889166]
33. Comoros
> Pre-tax income gap, top 10% / bottom 50%: 22.06
> Household pre-tax income top 10%: 50.26% — #40 highest of 174 countries
> Household pre-tax income bottom 50%: 11.39% — #27 lowest of 174 countries
> Wealth gap, top 10% / bottom 50%: 77.39 — #52 highest of 150 countries
> Average income: Not available
This archipelago in the Indian Ocean is one of the smaller countries on the list with a population of about 870,000. A World Bank report in 2018 said Comoros has made progress in reducing poverty in urban and rural sections. Despite the strides made, almost one-fourth of the population lives in extreme poverty, and poverty is more prevalent in rural areas.
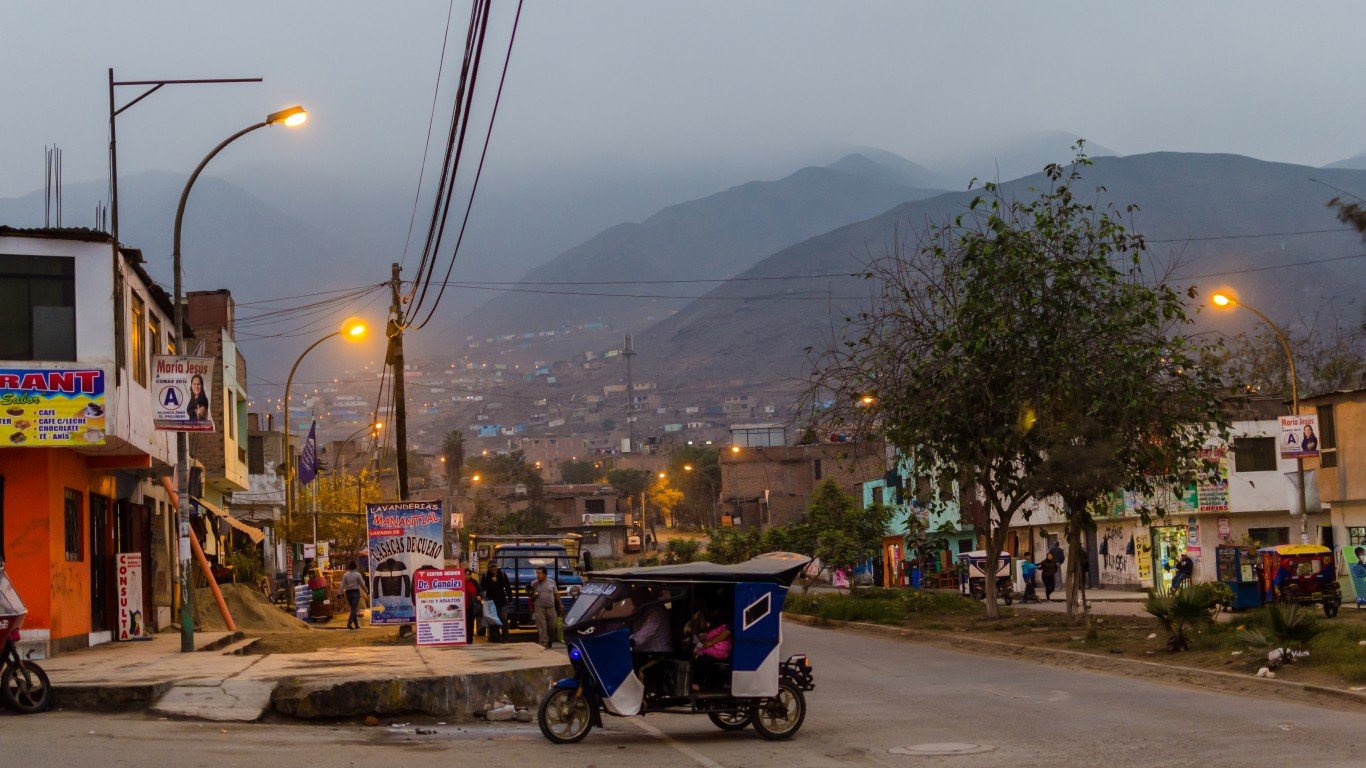
32. Peru
> Pre-tax income gap, top 10% / bottom 50%: 22.25
> Household pre-tax income top 10%: 49.94% — #43 highest of 174 countries
> Household pre-tax income bottom 50%: 11.22% — #25 lowest of 174 countries
> Wealth gap, top 10% / bottom 50%: 959.75 — #19 highest of 150 countries
> Average income: $13,638 — #72 highest of 150 countries
This South American nation of almost 33 million has a literal wall in the capital city of Lima that in effect separates the rich from the poor. The wall was built in reaction to the violence between the Peruvian government and the Shining Path guerrilla group over the last 30 years of the 20th century that caused a wave of migration from those fleeing the fighting. The migrants settled in abandoned hillsides and created informal settlements. The wall has become a symbol of income inequality. Almost half of the nation’s income is held by the top 10%.
[in-text-ad-2]
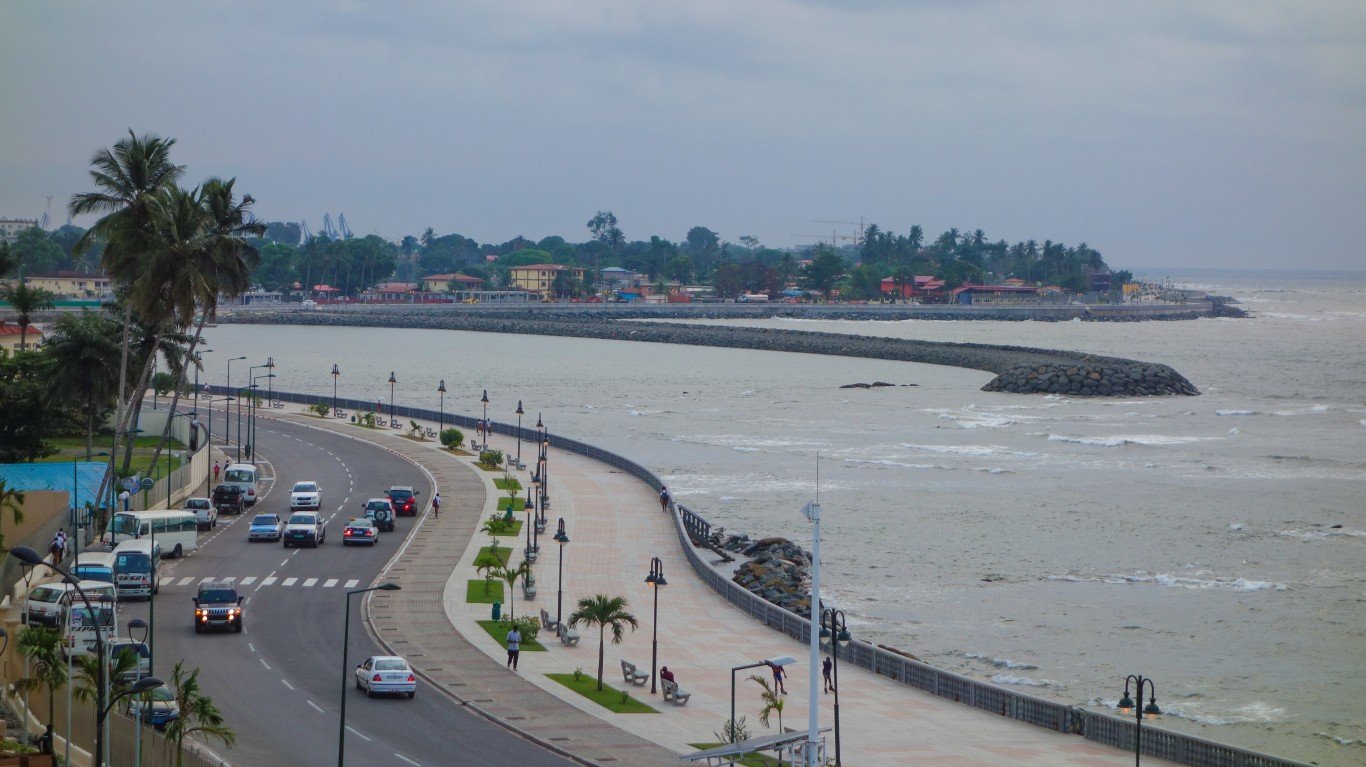
31. Equatorial Guinea
> Pre-tax income gap, top 10% / bottom 50%: 22.55
> Household pre-tax income top 10%: 51.63% — #34 highest of 174 countries
> Household pre-tax income bottom 50%: 11.45% — #29 lowest of 174 countries
> Wealth gap, top 10% / bottom 50%: 100.01 — #40 highest of 150 countries
> Average income: $21,874 — #48 highest of 150 countries
Much of the economy of this Central African country of 1.4 million involves subsistence farming. Oil and gas revenue began boosting the GDP in the 1990s, but the government has been criticized for not using the revenue efficiently. Much of the country lacks clean water and adequate health care, with just one in four newborns immunized for polio and one in three for tuberculosis.
30. Rwanda
> Pre-tax income gap, top 10% / bottom 50%: 22.78
> Household pre-tax income top 10%: 53.94% — #27 highest of 174 countries
> Household pre-tax income bottom 50%: 11.84% — #34 lowest of 174 countries
> Wealth gap, top 10% / bottom 50%: 208.82 — #29 highest of 150 countries
> Average income: $2,990 — #14 lowest of 150 countries
Rwanda is still recovering from a civil conflict that killed almost 800,000 Tutsi people in the mid-1990s in one of the worst genocides in modern times. Its GDP has surged past levels from before the conflict. A nation of 13 million people, it has lowered its poverty level from 57% in 2006 to 39% in 2015, as investments in health care, education, and housing have made inroads among the poor. Even so, its average annual income of $2,990 is the 14th lowest on the list.
[in-text-ad]
29. Turkey
> Pre-tax income gap, top 10% / bottom 50%: 22.78
> Household pre-tax income top 10%: 54.42% — #25 highest of 174 countries
> Household pre-tax income bottom 50%: 11.95% — #36 lowest of 174 countries
> Wealth gap, top 10% / bottom 50%: 91.92 — #44 highest of 150 countries
> Average income: $25,788 — #40 highest of 150 countries
An attempted coup in Turkey in 2016 brought into stark relief concerns about political stability in this nation of over 84 million. Turkey has high unemployment and refugees fleeing Syria’s civil war have increased tension and competition for jobs. As for income inequality, the richest 10% hold 54.5% of total income in the country, the 25th highest among nations on the list.
[recirclink id=978753]

28. Kuwait
> Pre-tax income gap, top 10% / bottom 50%: 22.99
> Household pre-tax income top 10%: 53.86% — #28 highest of 174 countries
> Household pre-tax income bottom 50%: 11.71% — #32 lowest of 174 countries
> Wealth gap, top 10% / bottom 50%: 230.09 — #26 highest of 150 countries
> Average income: $78,903 — #3 highest of 150 countries
Like other nations on the Arabian Peninsula, Kuwait, a nation of 4.3 million, has a high average annual income â at $78,903 it’s the third-highest in the world. Oil has been a major reason for its wealth. Kuwait has 6% of the world’s oil reserves. The lack of private-sector diversity has handcuffed the overall economy. The public sector employs 74% of Kuwaitis.
27. Costa Rica
> Pre-tax income gap, top 10% / bottom 50%: 23.37
> Household pre-tax income top 10%: 50.10% — #41 highest of 174 countries
> Household pre-tax income bottom 50%: 10.72% — #23 lowest of 174 countries
> Wealth gap, top 10% / bottom 50%: 110.28 — #37 highest of 150 countries
> Average income: $17,933 — #60 highest of 150 countries
Costa Rica’s economy has been driven by an increase in tourism, and living standards have risen in this Central American country of over 5 million people. However, income inequality is manifesting itself in low wages for labor and low labor participation rates. The U.S. Organisation for Economic Co-operation and Development has reported that another factor for the wealth gap is poor targeting of government cash transfers.
[in-text-ad-2]
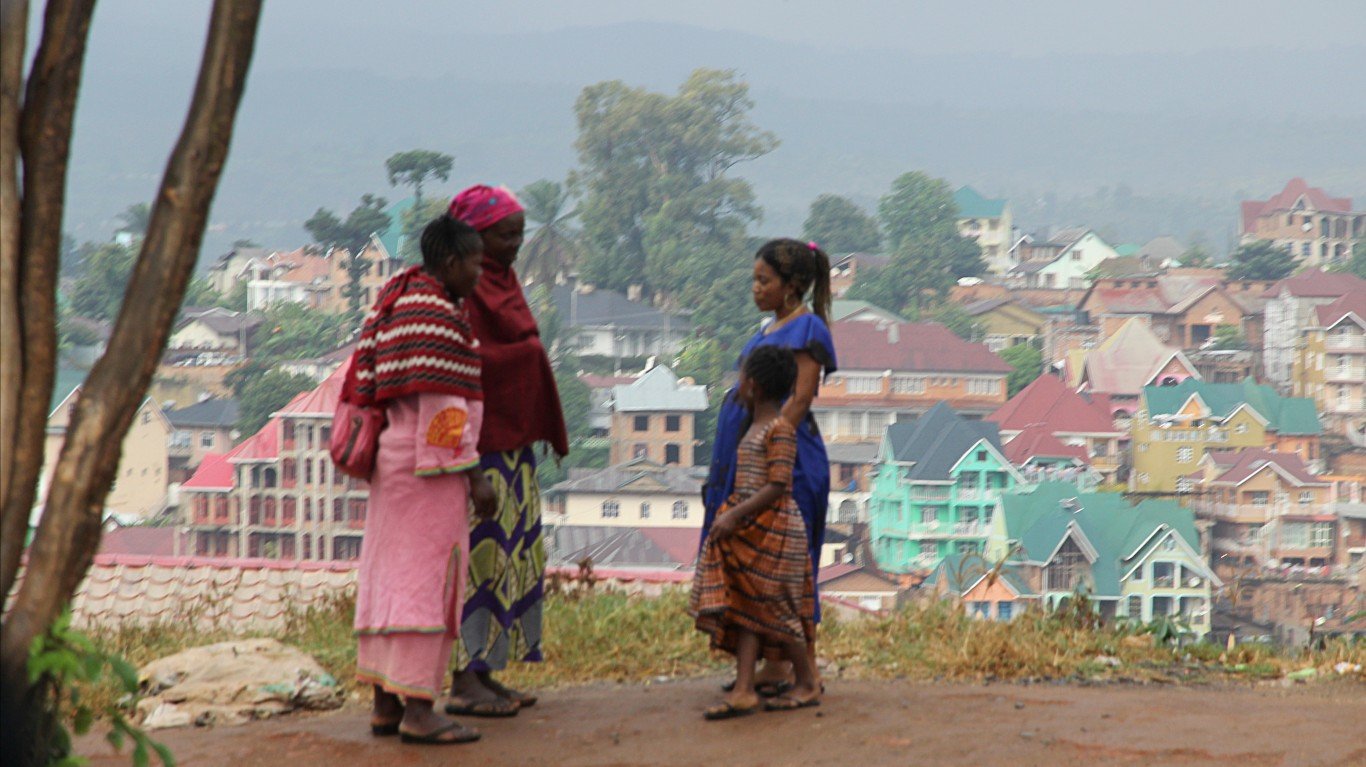
26. Côte d’Ivoire
> Pre-tax income gap, top 10% / bottom 50%: 23.60
> Household pre-tax income top 10%: 54.66% — #24 highest of 174 countries
> Household pre-tax income bottom 50%: 11.58% — #30 lowest of 174 countries
> Wealth gap, top 10% / bottom 50%: 61.51 — #76 highest of 150 countries
> Average income: $6,028 — #40 lowest of 150 countries
This African nation of 26.4 million people on the Atlantic coast has enjoyed a strong economic surge. It is the world’s biggest producer and exporter of cocoa beans, and also exports coffee and palm oil. Foreign investment is flocking to Côte d’Ivoire. What contributes to income inequality is inadequate education â children don’t stay in school long enough â and the lack of skills in the workforce.
25. Malawi
> Pre-tax income gap, top 10% / bottom 50%: 23.94
> Household pre-tax income top 10%: 56.45% — #18 highest of 174 countries
> Household pre-tax income bottom 50%: 11.79% — #33 lowest of 174 countries
> Wealth gap, top 10% / bottom 50%: 759.50 — #20 highest of 150 countries
> Average income: $1,892 — #6 lowest of 150 countries
Average income in this landlocked African nation is $1,892, the sixth lowest on the list. Like many countries on the continent, it is experiencing soaring population growth (it’s currently at about 19 million) and is beset by corruption and HIV/AIDS. Agricultural-dependent Malawi is among the least-developed countries on earth, hindered by a poor educational system and inadequate health care.
[in-text-ad]
24. Benin
> Pre-tax income gap, top 10% / bottom 50%: 23.98
> Household pre-tax income top 10%: 54.75% — #23 highest of 174 countries
> Household pre-tax income bottom 50%: 11.42% — #28 lowest of 174 countries
> Wealth gap, top 10% / bottom 50%: 287.62 — #22 highest of 150 countries
> Average income: $3,456 — #18 lowest of 150 countries
Average income in this small African country of more than 12 million people on the Atlantic Ocean is $3,456, 18th lowest on the list. Cotton is its main export. The government is building the electric grid for the nation and improvement in energy is helping to lift people out of poverty. Benin’s GDP growth has been steady.
[recirclink id=970877]
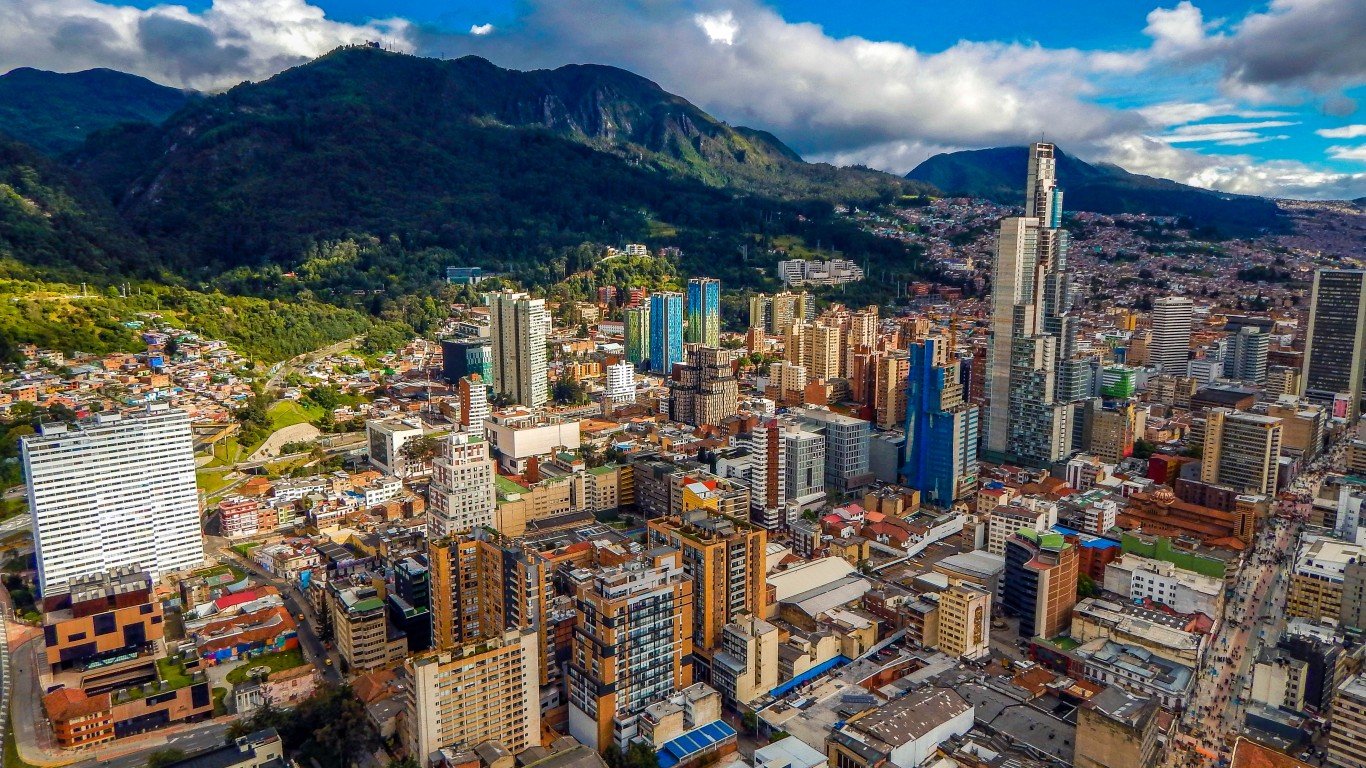
23. Colombia
> Pre-tax income gap, top 10% / bottom 50%: 24.21
> Household pre-tax income top 10%: 51.46% — #35 highest of 174 countries
> Household pre-tax income bottom 50%: 10.63% — #22 lowest of 174 countries
> Wealth gap, top 10% / bottom 50%: 69.20 — #59 highest of 150 countries
> Average income: $13,417 — #75 highest of 150 countries
According to Colombia Reports, poverty in this South American nation increased in 2019 after years of improvement, and it was expected to rise because of the onset of the pandemic. The top 10% of earners in the nation of nearly 51 million held more than 51% of the national income.
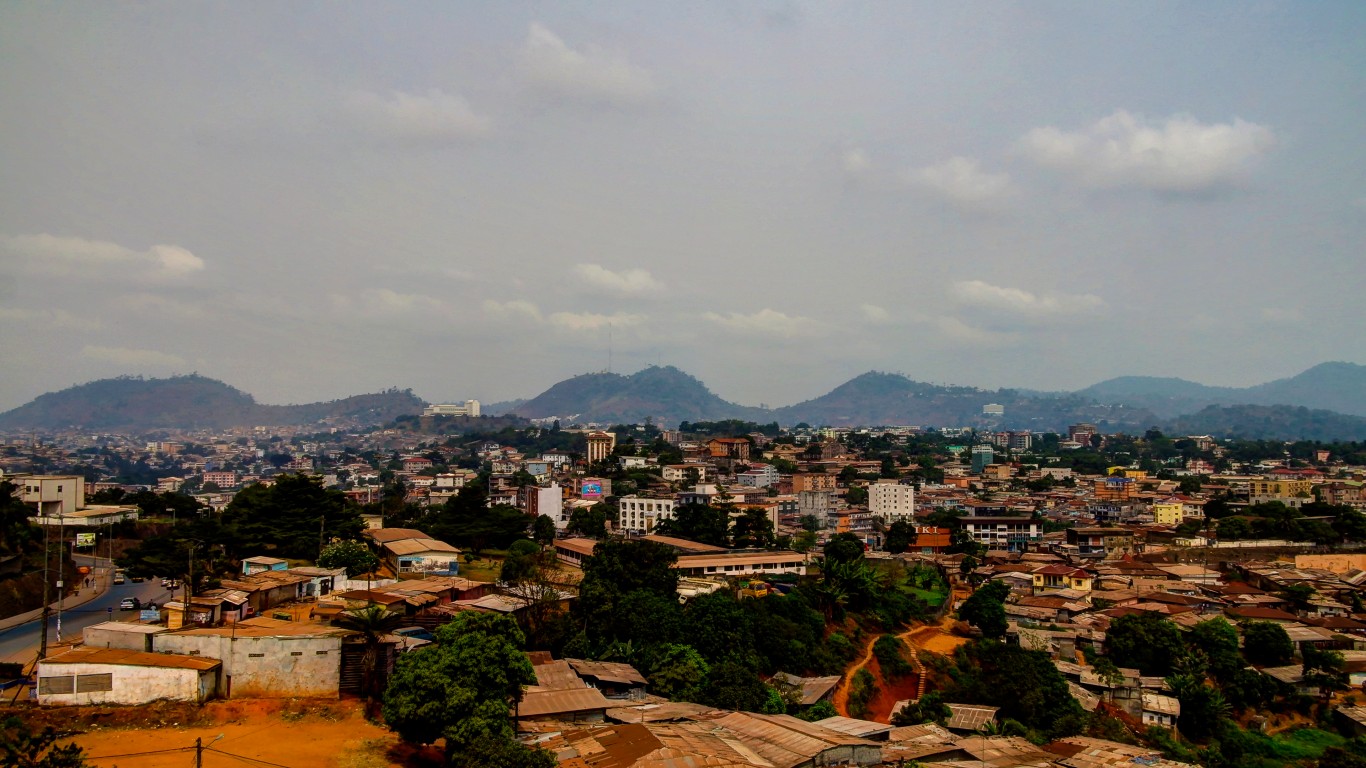
22. Cameroon
> Pre-tax income gap, top 10% / bottom 50%: 24.47
> Household pre-tax income top 10%: 52.05% — #32 highest of 174 countries
> Household pre-tax income bottom 50%: 10.63% — #22 lowest of 174 countries
> Wealth gap, top 10% / bottom 50%: 109.87 — #38 highest of 150 countries
> Average income: $5,354 — #34 lowest of 150 countries
Per-capita income has stagnated in this Central African nation of 26.5 million. Oil is its main export commodity, but Cameroon has a diversified economy. Corruption and government subsidies for energy and food that strained the budget have hindered economic progress.
[in-text-ad-2]
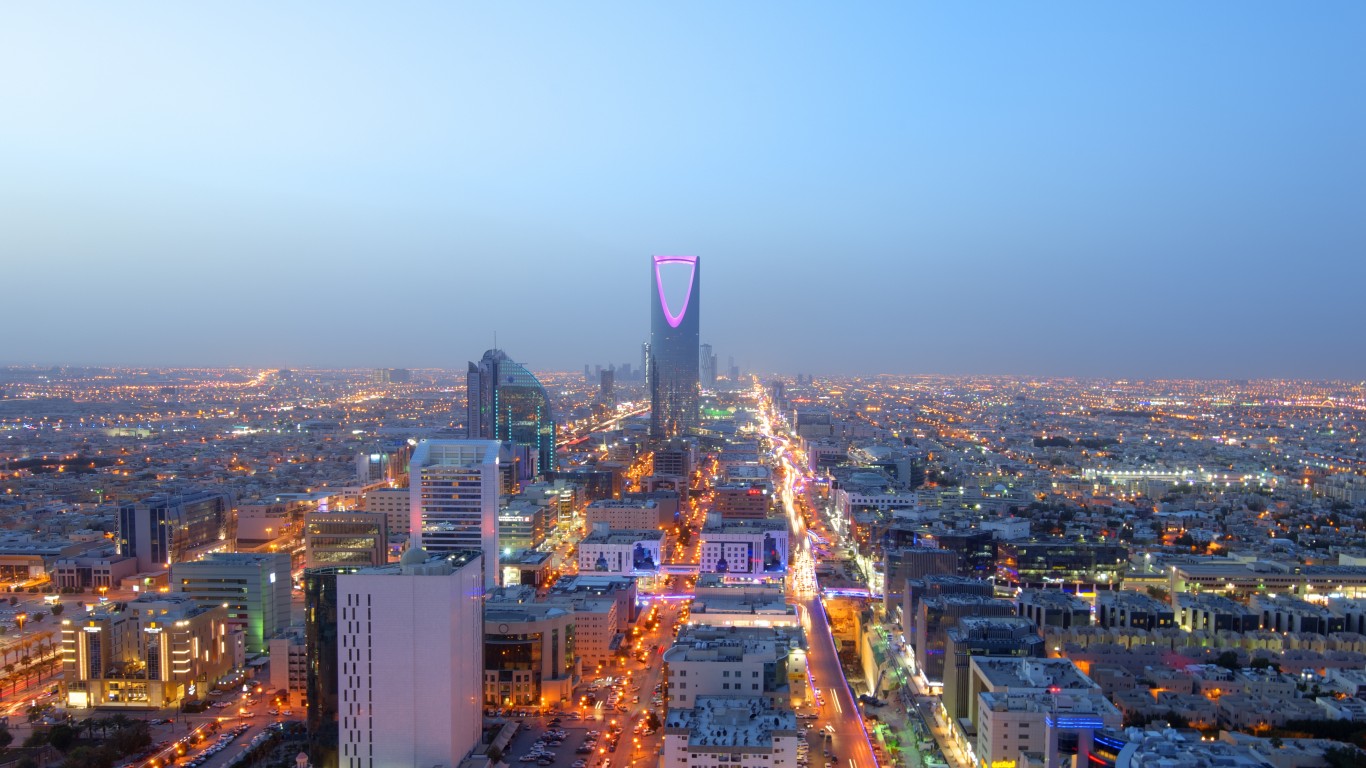
21. Saudi Arabia
> Pre-tax income gap, top 10% / bottom 50%: 24.65
> Household pre-tax income top 10%: 54.13% — #26 highest of 174 countries
> Household pre-tax income bottom 50%: 10.98% — #24 lowest of 174 countries
> Wealth gap, top 10% / bottom 50%: 212.82 — #28 highest of 150 countries
> Average income: $53,732 — #6 highest of 150 countries
Saudi Arabia’s oil reserves have made a lucky few very rich, but like other Gulf nations, this country of more than 34 million people has a wide income disparity. Most of the less fortunate are migrant workers, some of them undocumented. Many Saudi residents are too poor to open a bank account. A UN report in 2017 said Saudi efforts to combat poverty were “inefficient, unsustainable.”
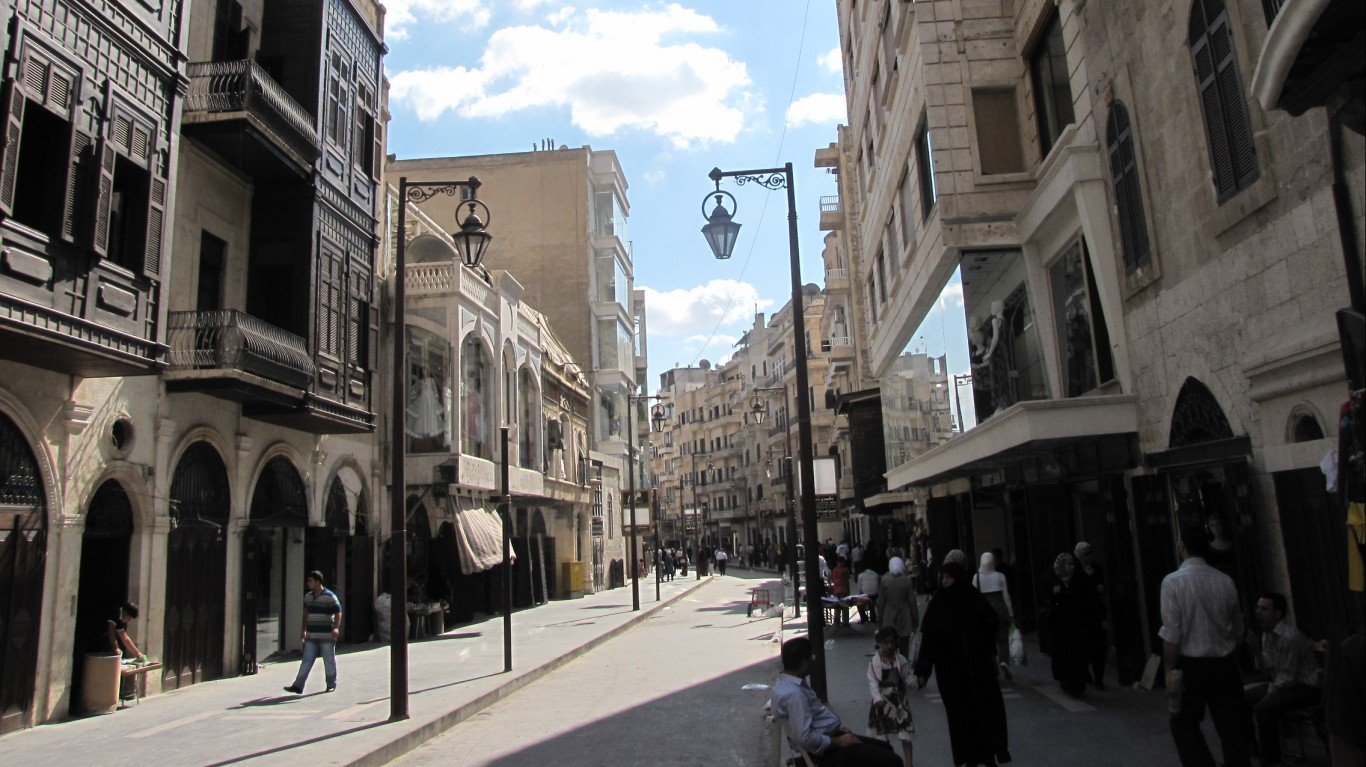
20. Syrian Arab Republic
> Pre-tax income gap, top 10% / bottom 50%: 26.55
> Household pre-tax income top 10%: 55.55% — #21 highest of 174 countries
> Household pre-tax income bottom 50%: 10.46% — #20 lowest of 174 countries
> Wealth gap, top 10% / bottom 50%: 64.58 — #67 highest of 150 countries
> Average income: $5,107 — #32 lowest of 150 countries
The wealth gap in the Syrian Arab Republic has become more pronounced as this nation of 17.5 million has been torn apart by a civil war that has killed about 400,000 people and displaced 6 million. Even before the war, Syria had been burdened by declining oil production, foreign trade restrictions, and high unemployment. Average income is just $5,107.
[in-text-ad]
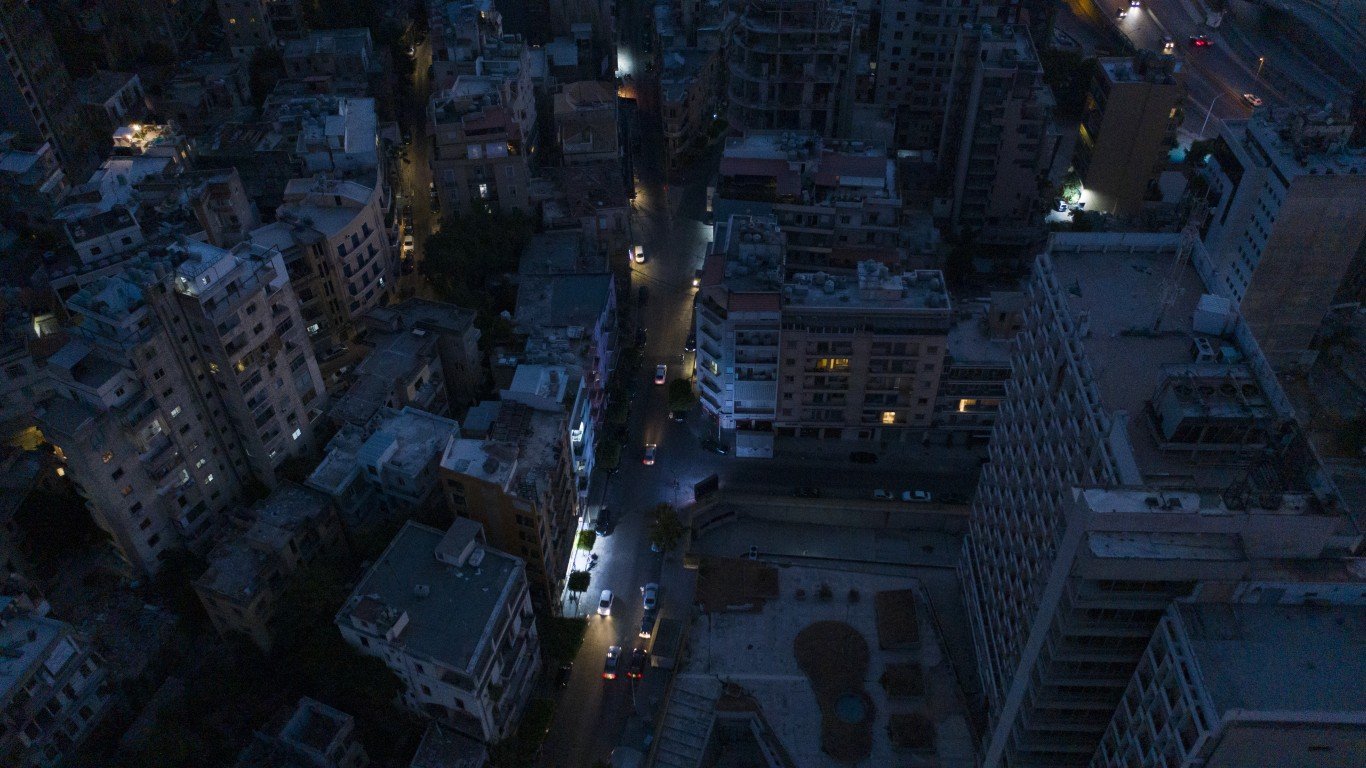
19. Lebanon
> Pre-tax income gap, top 10% / bottom 50%: 26.65
> Household pre-tax income top 10%: 55.31% — #22 highest of 174 countries
> Household pre-tax income bottom 50%: 10.38% — #19 lowest of 174 countries
> Wealth gap, top 10% / bottom 50%: 2808.93 — #17 highest of 150 countries
> Average income: $13,630 — #73 highest of 150 countries
Located on the eastern coast of the Mediterranean, this nation of 6.8 million has an economy that relies on banking and tourism. After years of sectarian violence, Lebanon’s prolonged period of relative peace has lately seen a rise in armed conflict. Refugees fleeing the civil war in neighboring Syria have put a strain on resources and the newly arrived people are competing with native Lebanese for jobs, causing tension.
[recirclink id=913857]
18. Republic of Congo
> Pre-tax income gap, top 10% / bottom 50%: 28.20
> Household pre-tax income top 10%: 55.93% — #20 highest of 174 countries
> Household pre-tax income bottom 50%: 9.92% — #15 lowest of 174 countries
> Wealth gap, top 10% / bottom 50%: 501.53 — #21 highest of 150 countries
> Average income: $6,734 — #44 lowest of 150 countries
Income inequality in the Central African country of 5.5 million has been exacerbated by political turmoil and armed conflict. Congo is still recovering from a two-year civil war that ended in 1999. Petroleum production is a bedrock of the economy but production has been declining, causing the government to reduce planned spending.
17. Bahrain
> Pre-tax income gap, top 10% / bottom 50%: 28.28
> Household pre-tax income top 10%: 57.37% — #15 highest of 174 countries
> Household pre-tax income bottom 50%: 10.14% — #17 lowest of 174 countries
> Wealth gap, top 10% / bottom 50%: 94.07 — #42 highest of 150 countries
> Average income: $41,268 — #15 highest of 150 countries
Like other Gulf countries, Bahrain experiences income inequality. While the average income is $41,268, the 15th-highest in the world, the top 10% of earners in a country of 1.7 million hold more than 57% of the national income.
[in-text-ad-2]
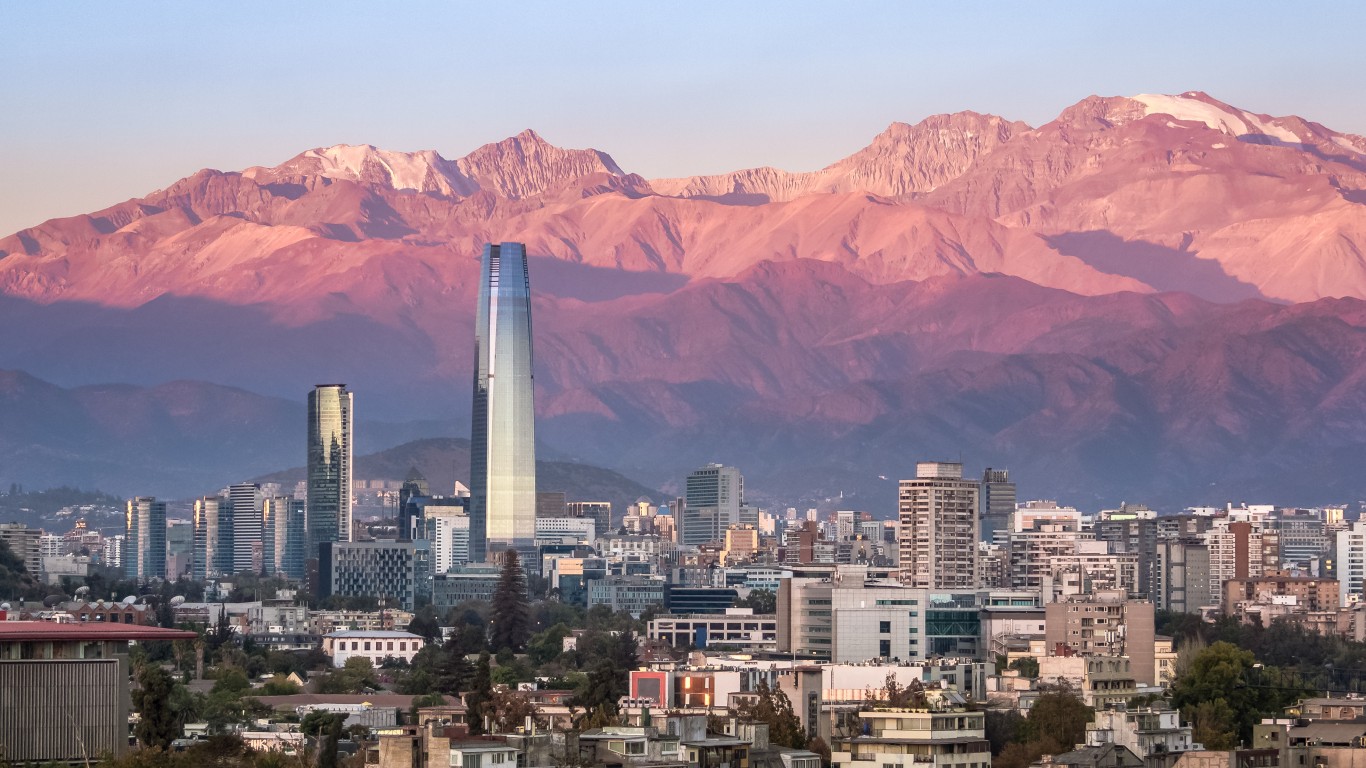
16. Chile
> Pre-tax income gap, top 10% / bottom 50%: 28.94
> Household pre-tax income top 10%: 58.91% — #12 highest of 174 countries
> Household pre-tax income bottom 50%: 10.18% — #18 lowest of 174 countries
> Wealth gap, top 10% / bottom 50%: -705.53 — #10 highest of 150 countries
> Average income: $22,256 — #47 highest of 150 countries
Chile’s average income of $22,256 is among the highest in South America and the country has been hailed for its economic management and stability. But much of the population of 19 million has been resentful toward Chilean elites and has demanded better healthcare and education access.
15. Brazil
> Pre-tax income gap, top 10% / bottom 50%: 29.07
> Household pre-tax income top 10%: 58.56% — #13 highest of 174 countries
> Household pre-tax income bottom 50%: 10.07% — #16 lowest of 174 countries
> Wealth gap, top 10% / bottom 50%: -1108.47 — #14 highest of 150 countries
> Average income: $13,931 — #70 highest of 150 countries
According to Oxfam, Brazil, South America’s most populous country, with a population of more than 212 million, has brought 28 million people out of poverty in the last 15 years. However, Brazil’s six wealthiest men have the same amount of wealth as the poorest 50% of the nation.
[in-text-ad]
14. Qatar
> Pre-tax income gap, top 10% / bottom 50%: 30.24
> Household pre-tax income top 10%: 56.33% — #19 highest of 174 countries
> Household pre-tax income bottom 50%: 9.31% — #13 lowest of 174 countries
> Wealth gap, top 10% / bottom 50%: 188.79 — #31 highest of 150 countries
> Average income: $94,211 — #2 highest of 150 countries
Oil and natural gas have propelled this nation on the Arabian Peninsula into having one of the highest average annual incomes in the world at more than $94,000. Even so, wealth in the nation of almost 3 million is not shared equally, as the rich have become richer because of oil revenue while income for most of the country has stagnated.
[recirclink id=1018508]
13. Mexico
> Pre-tax income gap, top 10% / bottom 50%: 31.26
> Household pre-tax income top 10%: 57.35% — #16 highest of 174 countries
> Household pre-tax income bottom 50%: 9.17% — #10 lowest of 174 countries
> Wealth gap, top 10% / bottom 50%: -1967.75 — #15 highest of 150 countries
> Average income: $18,501 — #58 highest of 150 countries
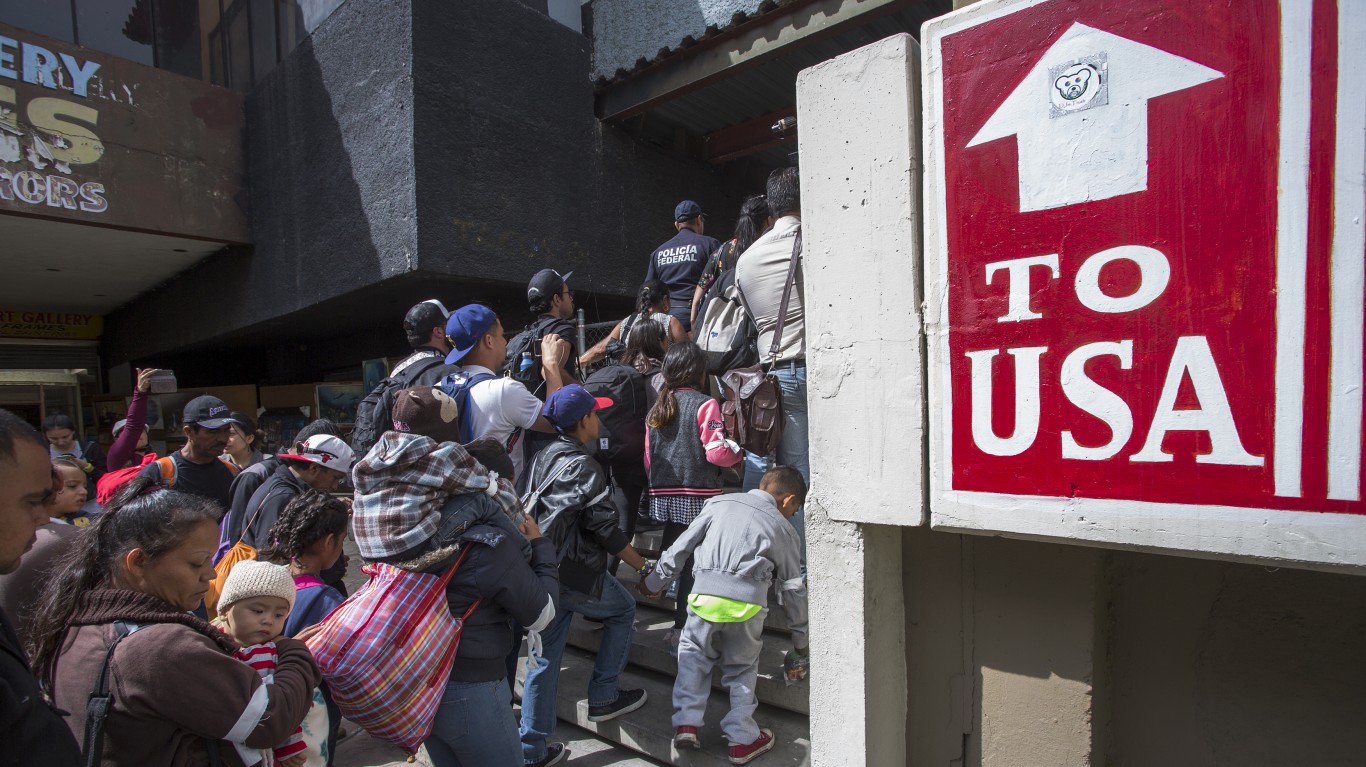
Even though Mexico has the 11th-largest economy in the world at $2.4 trillion, income inequality and the terror of the drug cartels have been drivers of massive Mexican emigration to the United States. The bottom 50% of this nation of more than 128 million people hold just 9.17% of the nation’s wealth, 10th lowest on the list.
12. Guinea-Bissau
> Pre-tax income gap, top 10% / bottom 50%: 31.34
> Household pre-tax income top 10%: 60.13% — #7 highest of 174 countries
> Household pre-tax income bottom 50%: 9.59% — #14 lowest of 174 countries
> Wealth gap, top 10% / bottom 50%: -717.82 — #11 highest of 150 countries
> Average income: Not available
This Western African nation on the Atlantic had the seventh-highest share of the top 10% of its population â 60% â of any country on the list. Political instability has contributed to economic difficulties in Guinea-Bissau.
[in-text-ad-2]
11. Zimbabwe
> Pre-tax income gap, top 10% / bottom 50%: 31.92
> Household pre-tax income top 10%: 58.95% — #11 highest of 174 countries
> Household pre-tax income bottom 50%: 9.23% — #11 lowest of 174 countries
> Wealth gap, top 10% / bottom 50%: 155.95 — #32 highest of 150 countries
> Average income: $4,383 — #26 lowest of 150 countries
A landlocked nation of nearly 15 million, Zimbabwe has been hurt by poor crop yields and lower prices for the diamonds that are mined there. The country has also been burdened by high debt.
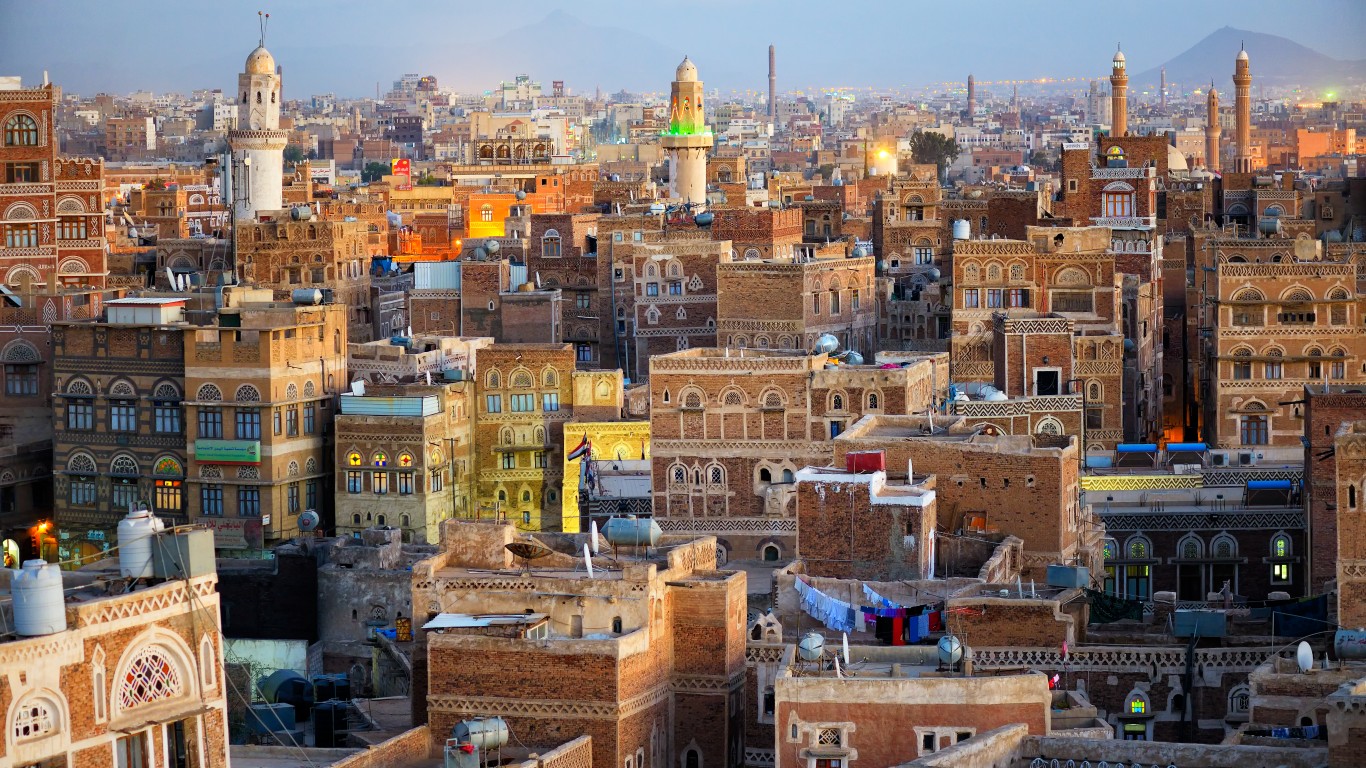
10. Yemen
> Pre-tax income gap, top 10% / bottom 50%: 31.96
> Household pre-tax income top 10%: 59.30% — #9 highest of 174 countries
> Household pre-tax income bottom 50%: 9.28% — #12 lowest of 174 countries
> Wealth gap, top 10% / bottom 50%: 67.09 — #63 highest of 150 countries
> Average income: $3,605 — #19 lowest of 150 countries
A relentless war in this kingdom of 29.8 million on the Arabian Peninsula has led to one of the world’s most severe humanitarian crises, exacerbated by famine and a cholera outbreak. The nation had been highly dependent on oil and gas exports, and Yemen’s attempt at diversifying the economy was short circuited by the war that began in 2014. The top 10% of the population holds more than 59% of the nation’s wealth, the ninth highest ratio on this list.
[in-text-ad]
9. Angola
> Pre-tax income gap, top 10% / bottom 50%: 32.09
> Household pre-tax income top 10%: 58.01% — #14 highest of 174 countries
> Household pre-tax income bottom 50%: 9.04% — #9 lowest of 174 countries
> Wealth gap, top 10% / bottom 50%: -9691.25 — #16 highest of 150 countries
> Average income: Not available
This former Portuguese colony has used its substantial oil wealth to rebuild the nation after a 27-year civil war ended in 2002. Even so, the country of nearly 33 million is burdened with income inequality, with the bottom 50% holding just 9.04% of the nation’s wealth, ninth lowest on the list.
[recirclink id=889166]
8. Botswana
> Pre-tax income gap, top 10% / bottom 50%: 36.49
> Household pre-tax income top 10%: 59.26% — #10 highest of 174 countries
> Household pre-tax income bottom 50%: 8.12% — #7 lowest of 174 countries
> Wealth gap, top 10% / bottom 50%: -1060.41 — #13 highest of 150 countries
> Average income: $17,575 — #61 highest of 150 countries
Growth in the rural areas of this Southern African nation of 2.4 million and improvements in its welfare program have lifted thousands out of poverty. The country is known for its diamond exports and is considered one of the least corrupt nations in Africa. Still, the bottom 50% holds just 8.12% of the nation’s wealth, the seventh lowest on the list.
7. Swaziland
> Pre-tax income gap, top 10% / bottom 50%: 38.11
> Household pre-tax income top 10%: 59.88% — #8 highest of 174 countries
> Household pre-tax income bottom 50%: 7.86% — #6 lowest of 174 countries
> Wealth gap, top 10% / bottom 50%: -892.67 — #12 highest of 150 countries
> Average income: $12,950 — #72 lowest of 150 countries
Swaziland, also known as Eswatini, has the world’s highest HIV/AIDS rate. As of 2017, one in four adults had the affliction, causing a massive strain on its resources and hurting the economy. The country is also burdened with high unemployment and poverty. The bottom 50% holds just 7.86% of the nation’s wealth, the sixth lowest on the list. The small landlocked kingdom of just over 1 million people is bordered by South Africa and Mozambique.
[in-text-ad-2]
6. Mozambique
> Pre-tax income gap, top 10% / bottom 50%: 38.94
> Household pre-tax income top 10%: 64.63% — #4 highest of 174 countries
> Household pre-tax income bottom 50%: 8.30% — #8 lowest of 174 countries
> Wealth gap, top 10% / bottom 50%: -372.41 — #6 highest of 150 countries
> Average income: $2,106 — #7 lowest of 150 countries
This impoverished East African nation of more than 31 million, 45% of whom are under 15 years old, is plagued by natural calamities, widespread disease, rapid population growth, and unproductive agricultural methods. The wealth share of the top 10% of the population is about 65%, the fourth highest on the list.
5. Central African Republic
> Pre-tax income gap, top 10% / bottom 50%: 42.52
> Household pre-tax income top 10%: 64.91% — #3 highest of 174 countries
> Household pre-tax income bottom 50%: 7.63% — #5 lowest of 174 countries
> Wealth gap, top 10% / bottom 50%: -362.66 — #5 highest of 150 countries
> Average income: $1,318 — #2 lowest of 150 countries
Another landlocked country in Central Africa, the Central African Republic suffers from income inequality that is tinder for armed conflict in the nation. The wealth share of the top 10% of its population of about 4.8 million is about 65%, the third highest on the list. Average income is $1,318, the second lowest on the list.
[in-text-ad]
4. Zambia
> Pre-tax income gap, top 10% / bottom 50%: 44.42
> Household pre-tax income top 10%: 61.74% — #6 highest of 174 countries
> Household pre-tax income bottom 50%: 6.95% — #4 lowest of 174 countries
> Wealth gap, top 10% / bottom 50%: -480.48 — #9 highest of 150 countries
> Average income: $6,012 — #39 lowest of 150 countries
The bottom 50% of Zambians, in this landlocked country of 18.3 million in Central Africa, earn just 6.95% of the nation’s income, the fourth lowest on this list. Zambia is rich in natural resources, but also has one of the world’s largest wealth gaps.
[recirclink id=978753]
3. Namibia
> Pre-tax income gap, top 10% / bottom 50%: 49.03
> Household pre-tax income top 10%: 64.20% — #5 highest of 174 countries
> Household pre-tax income bottom 50%: 6.55% — #3 lowest of 174 countries
> Wealth gap, top 10% / bottom 50%: -379.15 — #7 highest of 150 countries
> Average income: $13,248 — #75 lowest of 150 countries
The bottom 50% of the population of Namibia, on the southwestern Atlantic Coast, earns 6.55% of the nation’s income, the third lowest on the list. The main driver for the country’s economy is mining, which makes up 50% of foreign exchange earnings for a nation of 2.5 million.
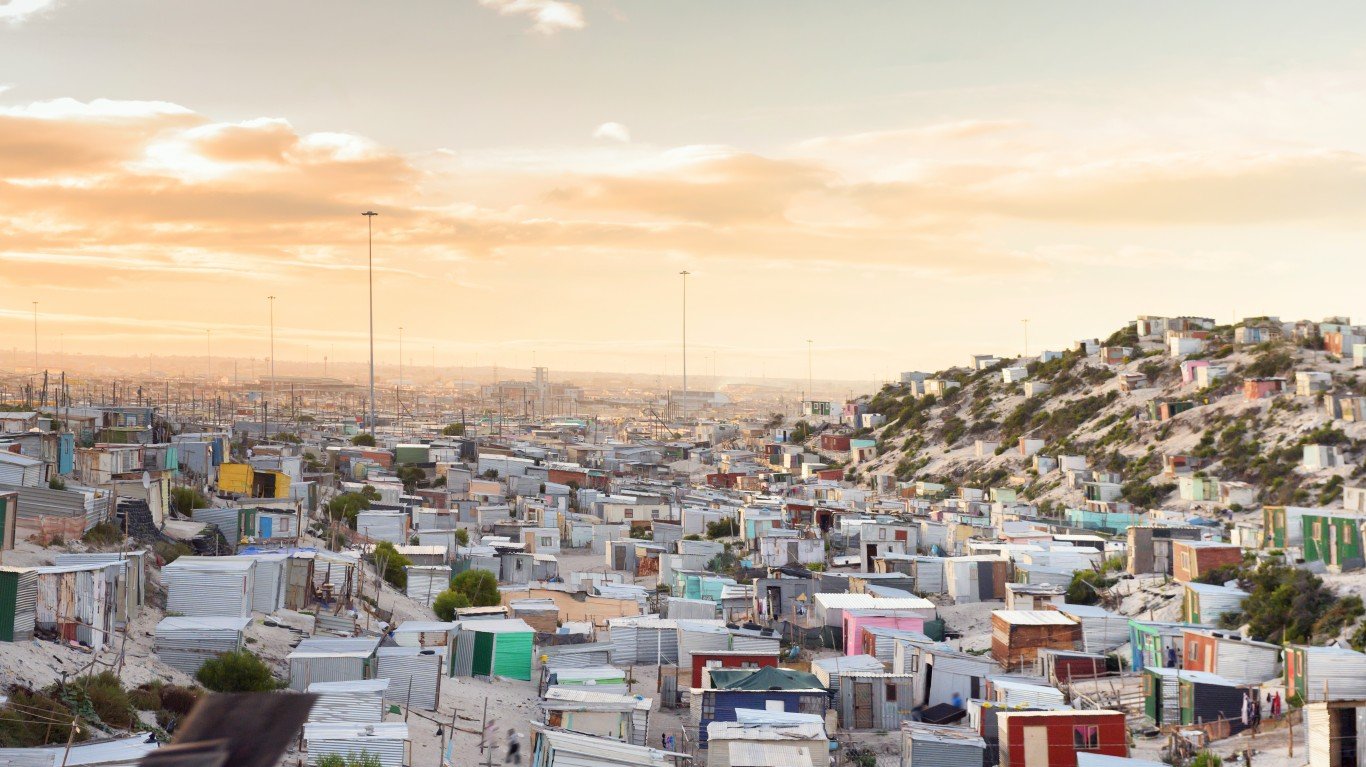
2. South Africa
> Pre-tax income gap, top 10% / bottom 50%: 63.10
> Household pre-tax income top 10%: 66.54% — #2 highest of 174 countries
> Household pre-tax income bottom 50%: 5.27% — #2 lowest of 174 countries
> Wealth gap, top 10% / bottom 50%: -175.55 — #3 highest of 150 countries
> Average income: $13,205 — #74 lowest of 150 countries
Nearly 30 years after South Africa abolished apartheid, little progress has been made to close the wealth gap in the nation of 59.3 million. Despite more economic opportunities and a growing Black middle class, most Black South Africans attend substandard schools that do not prepare them for jobs.
[in-text-ad-2]
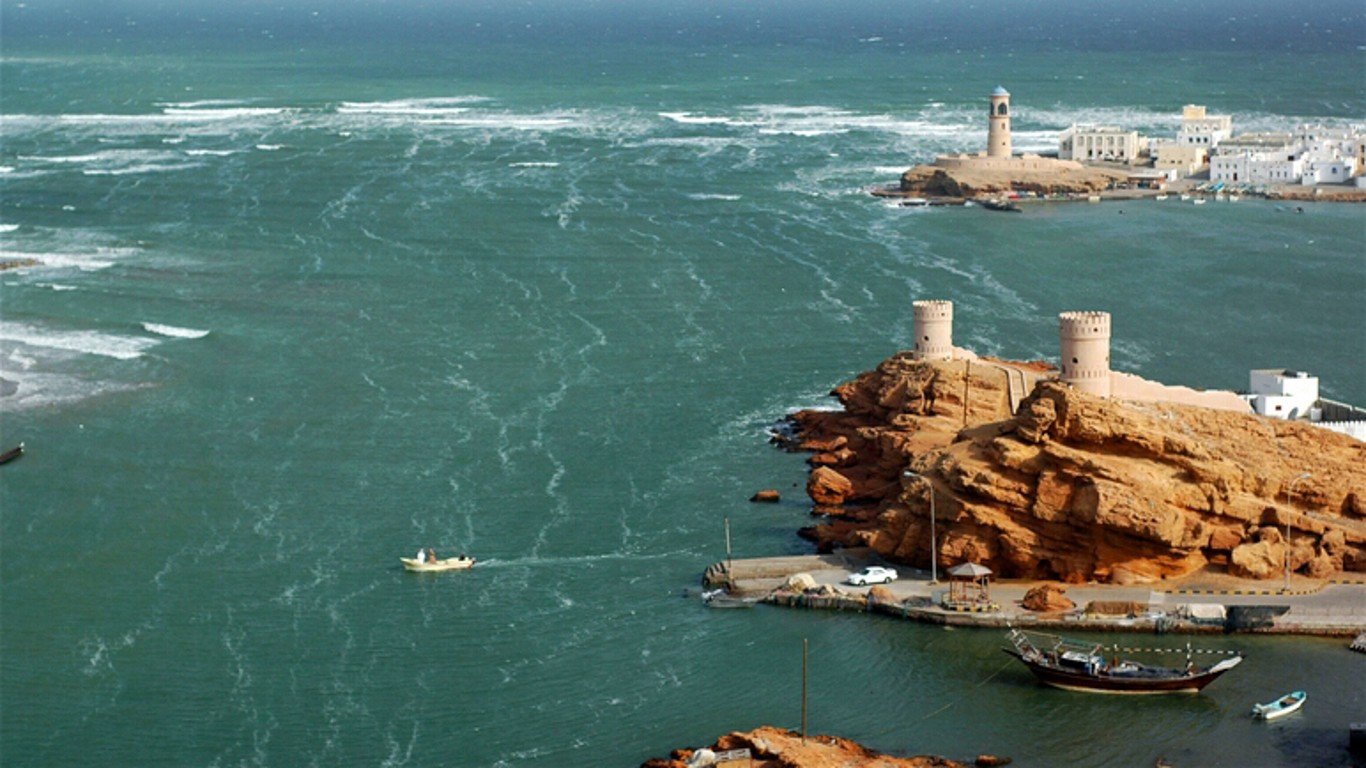
1. Oman
> Pre-tax income gap, top 10% / bottom 50%: 139.59
> Household pre-tax income top 10%: 82.68% — #1 highest of 174 countries
> Household pre-tax income bottom 50%: 2.96% — #1 lowest of 174 countries
> Wealth gap, top 10% / bottom 50%: 265.36 — #23 highest of 150 countries
> Average income: Not available
The nation of 5.1 million on the Arabian Peninsula has the highest ratio of wealth disparity of the 174 countries on this list. The share of the bottom 50% in total earnings is just 2.96%, while the share of the top 10% is almost 83%; both figures are the highest on the list. The sultanate relies on oil to fuel its economy, which has helped make a few people rich and contributed to the wealth gap.
Contact [email protected] for any questions or corrections.