Since the onset of the pandemic, 16 states have recorded population declines, a trend abetted by a decline in immigration, soaring costs in certain states, aging baby boomers moving to warmer climates, and low birth rates.
To identify the 16 states where the population shrank since the pandemic started, 24/7 Wall St. calculated the one-year population change from July 1, 2020 to July 1, 2021 using U.S. Census Bureau data. The average number of new daily COVID-19 cases in the past seven days as of Feb. 2 comes from federal, state, and local sources.
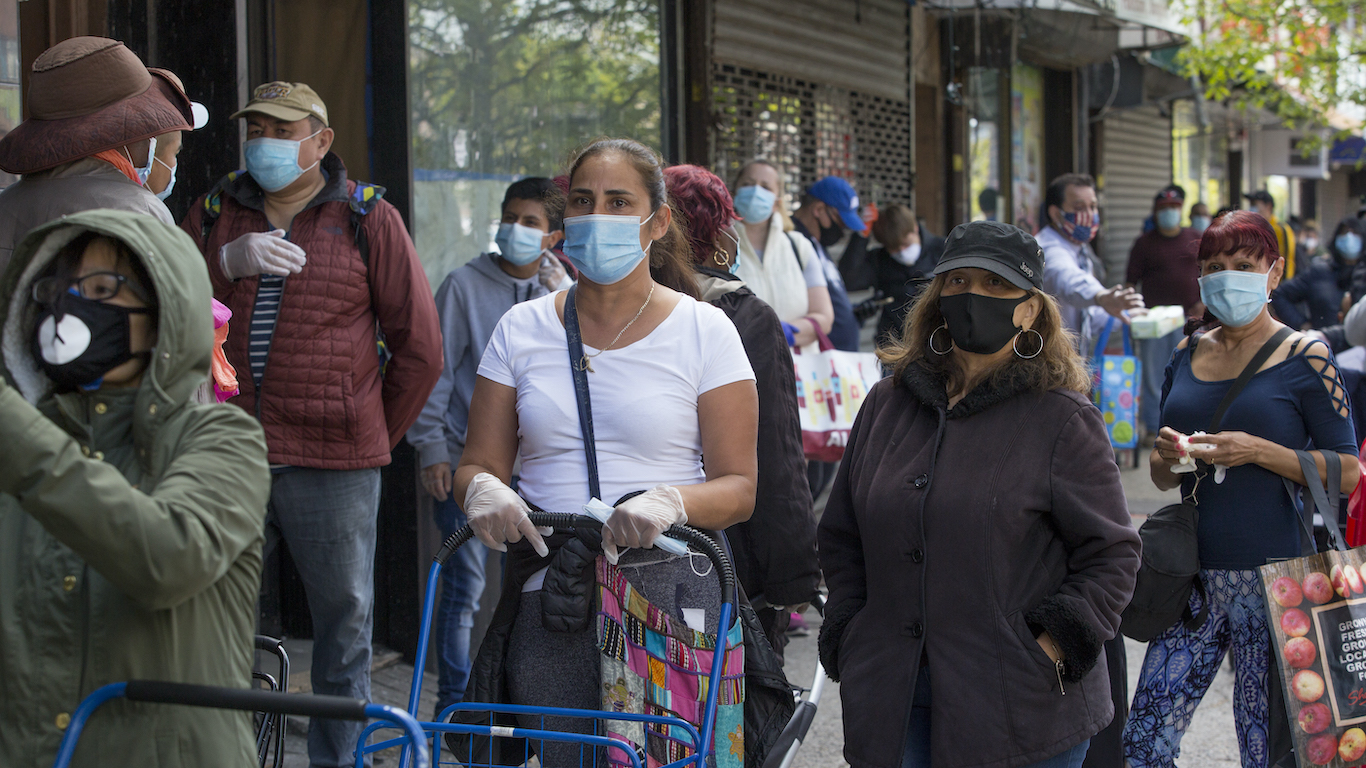
Fewer people moved nationwide during the period of April 2020 to April 2021 than at any time since the federal government began reporting data in 1948, according to Census data. Even though fewer people moved, some states where the population decreased during the pandemic were already experiencing declining population, and COVID-19 has served to accentuate that movement.
The population declines were greatest in the coastal states of New York and California, among the country’s more densely-populated states. New York lost 319,000 residents and California 260,000 residents during those 12 months. (Longer term, this is how the population of every state has changed in the last 100 years.)
Those two states also are among the most expensive in the nation. A recent Pew Research Center survey found that financial pressures are a major reason why Americans moved during the pandemic. New York and California also imposed some of the country’s strictest public health restrictions during the pandemic. Businesses and schools were closed longer in these two states than some other states.
Until the pandemic, California, Massachusetts, and Ohio had been adding population over the previous decade. The former two states had been riding a tech boom that had been attracting new residents. The pandemic placed restrictions on the number of skilled immigrants employed in tech, and that has hurt that sector.
In states like Michigan, New Jersey, Pennsylvania, Alaska, Illinois, Louisiana, Mississippi, Rhode Island, Vermont, and West Virginia, the population losses had been occurring much longer and continued since the pandemic began.
Of the 10 most densely populated states in the nation, seven – New Jersey, Rhode Island, Massachusetts, Maryland, New York, Ohio, and Pennsylvania – had population declines. (Some of these states are home to the 50 largest cities in America.)
There are also other consequences to population declines in certain states. A drop in the population could mean the loss of seats in the House of Representatives for the state. A decrease in population can also make it more difficult for a state to attract companies.
Click here for the 16 states where the population shrank since the pandemic started

16. Rhode Island
> 1-year change in population: -0.1%
> Population estimate (July 1, 2020) 1,096,229
> Population estimate (July 1, 2021) 1,095,610
> Avg. new COVID-19 cases, past 7 days 1,545.43
[in-text-ad]

15. New Mexico
> 1-year change in population: -0.1%
> Population estimate (July 1, 2020) 2,117,566
> Population estimate (July 1, 2021) 2,115,877
> Avg. new COVID-19 cases, past 7 days 3,924.43
[recirclink id=1031568]

14. Ohio
> 1-year change in population: -0.1%
> Population estimate (July 1, 2020) 11,790,587
> Population estimate (July 1, 2021) 11,780,017
> Avg. new COVID-19 cases, past 7 days 9,208

13. Maryland
> 1-year change in population: -0.1%
> Population estimate (July 1, 2020) 6,172,679
> Population estimate (July 1, 2021) 6,165,129
> Avg. new COVID-19 cases, past 7 days 2,423.71
[in-text-ad-2]

12. New Jersey
> 1-year change in population: -0.1%
> Population estimate (July 1, 2020) 9,279,743
> Population estimate (July 1, 2021) 9,267,130
> Avg. new COVID-19 cases, past 7 days 5,617.14

11. Michigan
> 1-year change in population: -0.2%
> Population estimate (July 1, 2020) 10,067,664
> Population estimate (July 1, 2021) 10,050,811
> Avg. new COVID-19 cases, past 7 days 12,871.14
[in-text-ad]

10. Pennsylvania
> 1-year change in population: -0.2%
> Population estimate (July 1, 2020) 12,989,625
> Population estimate (July 1, 2021) 12,964,056
> Avg. new COVID-19 cases, past 7 days 11,378.57
[recirclink id=1023752]

9. Mississippi
> 1-year change in population: -0.2%
> Population estimate (July 1, 2020) 2,956,870
> Population estimate (July 1, 2021) 2,949,965
> Avg. new COVID-19 cases, past 7 days 4,760.71

8. West Virginia
> 1-year change in population: -0.4%
> Population estimate (July 1, 2020) 1,789,798
> Population estimate (July 1, 2021) 1,782,959
> Avg. new COVID-19 cases, past 7 days 3,500.86
[in-text-ad-2]

7. North Dakota
> 1-year change in population: -0.5%
> Population estimate (July 1, 2020) 778,962
> Population estimate (July 1, 2021) 774,948
> Avg. new COVID-19 cases, past 7 days 1,672.14

6. Massachusetts
> 1-year change in population: -0.5%
> Population estimate (July 1, 2020) 7,022,220
> Population estimate (July 1, 2021) 6,984,723
> Avg. new COVID-19 cases, past 7 days 6,939.29
[in-text-ad]
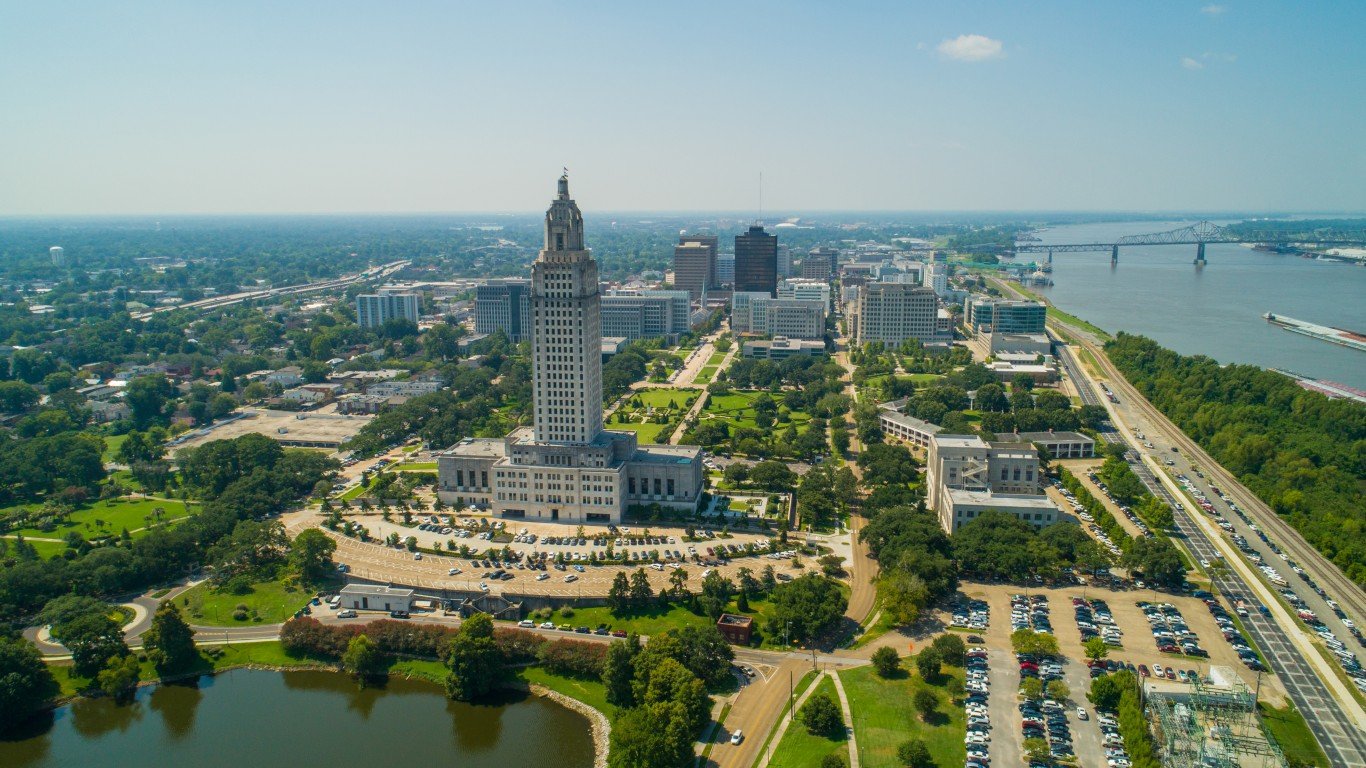
5. Louisiana
> 1-year change in population: -0.6%
> Population estimate (July 1, 2020) 4,651,203
> Population estimate (July 1, 2021) 4,624,047
> Avg. new COVID-19 cases, past 7 days 5,389.14
[recirclink id=1020766]

4. California
> 1-year change in population: -0.7%
> Population estimate (July 1, 2020) 39,499,738
> Population estimate (July 1, 2021) 39,237,836
> Avg. new COVID-19 cases, past 7 days 74,200.29

3. Hawaii
> 1-year change in population: -0.7%
> Population estimate (July 1, 2020) 1,451,911
> Population estimate (July 1, 2021) 1,441,553
> Avg. new COVID-19 cases, past 7 days 2,005.71
[in-text-ad-2]

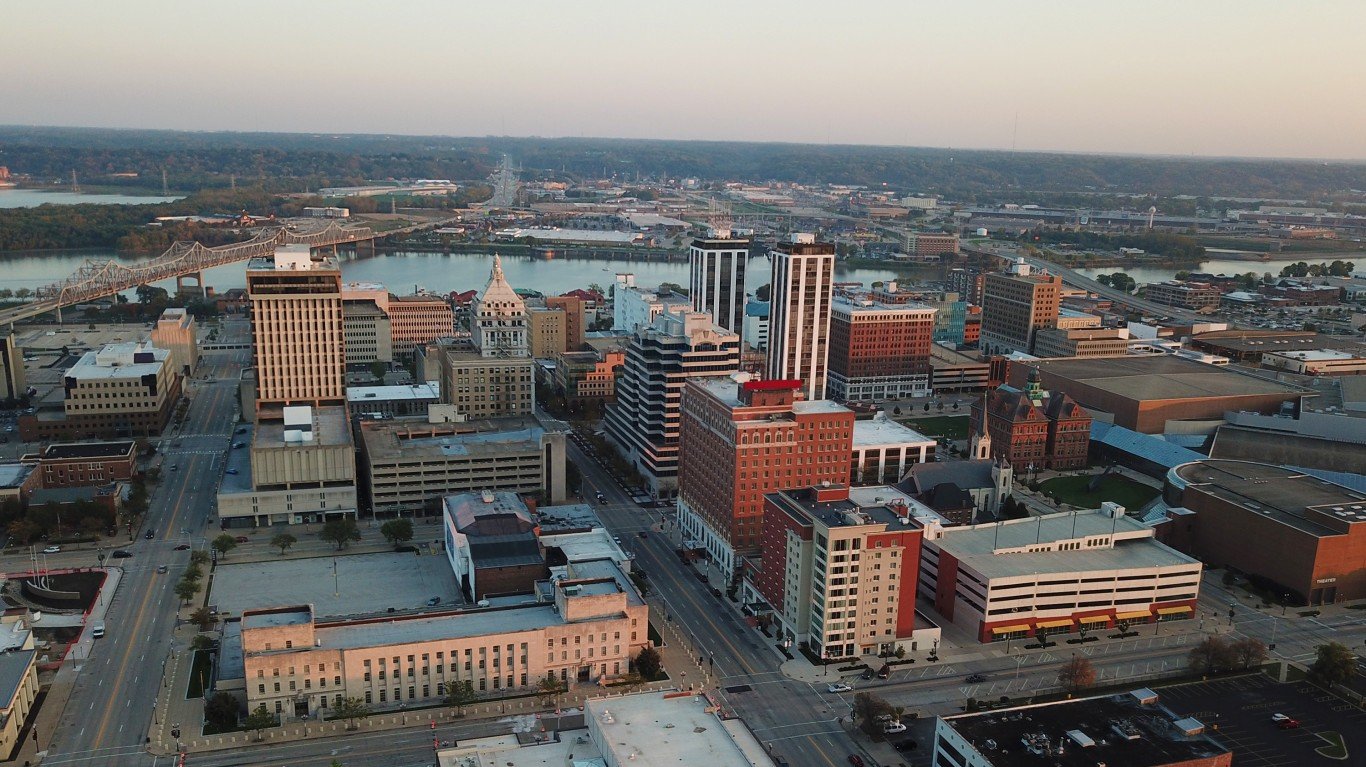
2. Illinois
> 1-year change in population: -0.9%
> Population estimate (July 1, 2020) 12,785,245
> Population estimate (July 1, 2021) 12,671,469
> Avg. new COVID-19 cases, past 7 days 11,872.86

1. New York
> 1-year change in population: -1.6%
> Population estimate (July 1, 2020) 20,154,933
> Population estimate (July 1, 2021) 19,835,913
> Avg. new COVID-19 cases, past 7 days 12,012.86
Contact [email protected] for any questions or corrections.