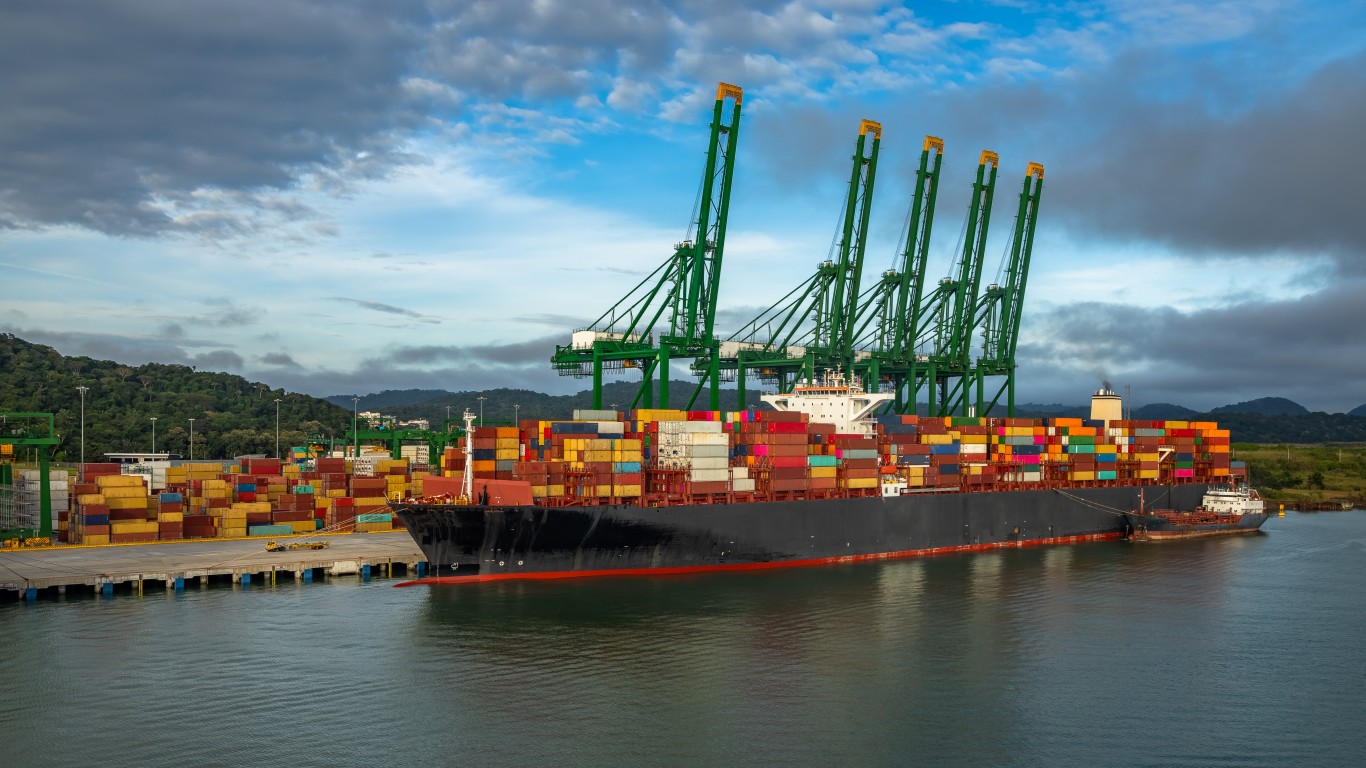
Cross-border trade is as old as civilization itself, but this commerce has broadened in modern times thanks to world-shrinking innovations in transport and logistics, as well as the expansion of free-trade agreements and other bilateral and regional pacts.
Virtually none of the world’s 193 United Nations member states, or other countries, territories and dependencies, are fully self-reliant, meaning they produce everything their populations need within their own borders.
To find the most self-sufficient countries in the world, 24/7 Wall St. used World Bank data to rank countries by the total value of imports as a percentage of gross domestic product. Data includes imports and exports as a percentage of GDP and in current U.S. dollars, GDP is also in current U.S. dollars, and annual growth of imports based on constant local currency that are based on constant 2015 prices then expressed in USD. All data is from the World Bank for the most recent year available.
Imports include all goods and services imported to a country. They include agricultural products, commodities, merchandise, freight services, banking, royalties, licensing fees, and other valuables.
The countries on this list import goods and services valued at 21% or less of their GDP. However, exports vary widely, with some countries dealing with large trade deficits (imports larger than exports). While some countries on this list are economically prosperous and the low level of imports implies self-sufficiency, others are low-income countries. (These are the poorest countries in the world.)
Sudan, for example, a country still precariously recovering from decades of civil war, is almost completely self-reliant – its total trade activity with the rest of the world made up less than 1% of its GDP in 2020. Many of the country’s residents are engaged in subsistence farming.
Conversely, wealthy, highly developed, economically diverse countries can typically weather trade deficits. For example, the United States with its $21 trillion economy is considered among the most self-reliant in the world, even if the value of its imports made up more than 13% of its GDP in 2020 compared to about 10% for its exports that same year. (Find out if the U.S. ranks among countries where people have the highest average net incomes.)
Click here to see the most self sufficient economies in the world
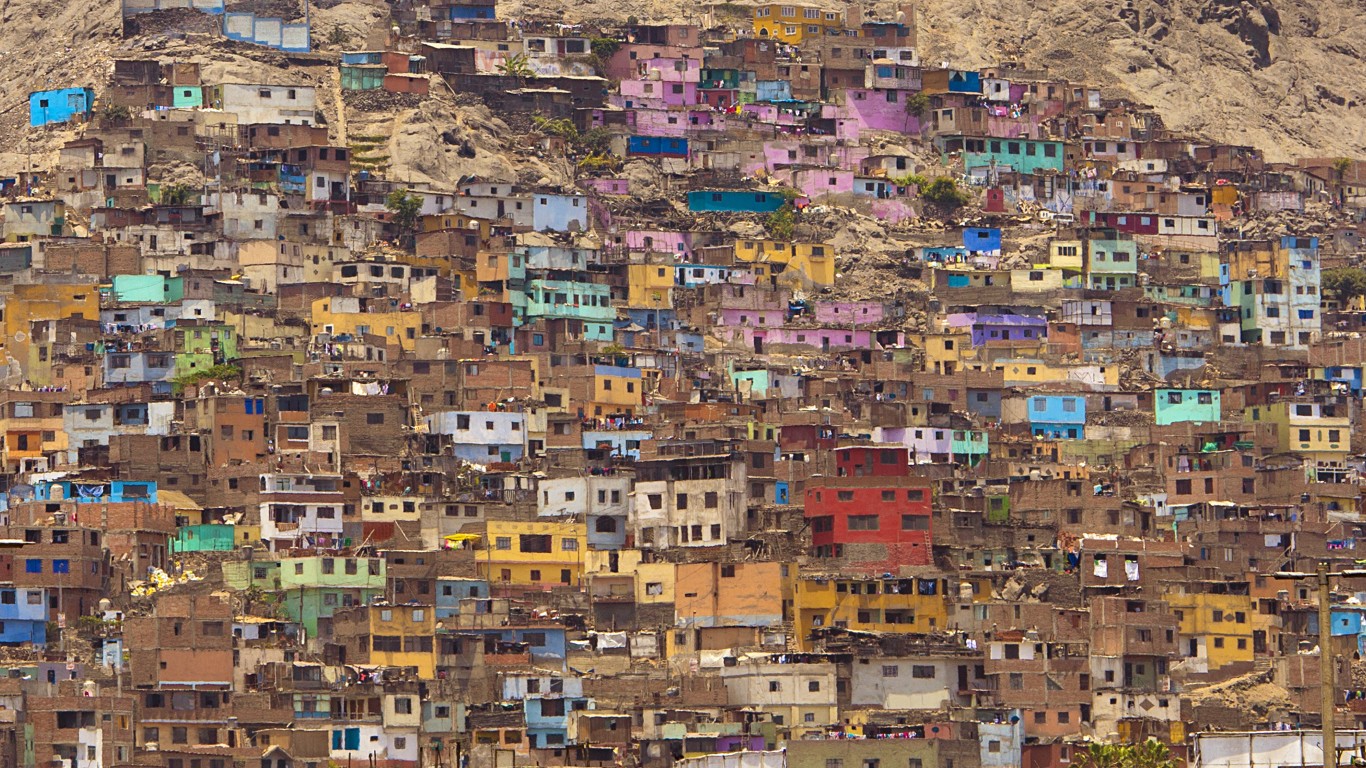
25. Peru
> Imports as % of GDP, 2020: 21.10%
> Imports in current US$, 2020: $42.63 billion – #61 highest of 189 countries
> Annual imports growth, 2020: -14.92% – #44 largest decline of 170 countries
> Exports as % of GDP, 2020: 22.33% – #55 lowest of 190 countries
> Exports in current US$, 2020: $45.12 billion – #57 highest of 189 countries
> GDP in current US$, 2020: $202.01 billion – #50 highest of 190 countries
Peru, with a population of about 33 million, primarily exports minerals and metals like copper, iron, lead and zinc and imports mainly petroleum. Its top export and import markets are China and the United States, the latter with which Peru signed a free trade agreement in 2009 that boosted its exports of agricultural products to North America.
[in-text-ad]

24. Uruguay
> Imports as % of GDP, 2020: 21.00%
> Imports in current US$, 2020: $11.26 billion – #92 lowest of 189 countries
> Annual imports growth, 2020: -10.81% – #66 largest decline of 170 countries
> Exports as % of GDP, 2020: 25.37% – #67 lowest of 190 countries
> Exports in current US$, 2020: $13.61 billion – #88 highest of 189 countries
> GDP in current US$, 2020: $53.63 billion – #83 highest of 190 countries
Uruguay’s primary exports are livestock and vegetables and imports mainly petroleum. Its largest bilateral trading partners are China and Brazil. Uruguay (with a population of about 3.5 million) is a founding member of Mercosur — the South American common market — and through this organization the country has trade deals with the European Union and Mexico.
[recirclink id=967341]

23. Ecuador
> Imports as % of GDP, 2020: 20.75%
> Imports in current US$, 2020: $20.51 billion – #76 highest of 189 countries
> Annual imports growth, 2020: -7.88% – #47 smallest decline of 170 countries
> Exports as % of GDP, 2020: 22.53% – #56 lowest of 190 countries
> Exports in current US$, 2020: $22.26 billion – #72 highest of 189 countries
> GDP in current US$, 2020: $98.81 billion – #65 highest of 190 countries
China and the South American country with a population of about 18 million said in February they would reach a bilateral trade deal by the end of the year. Ecuador has free trade or preferential trade agreements with other Latin American countries and the European Union. The country’s imports are valued at nearly 21% of GDP, while its exports are valued at over 22% of GDP.
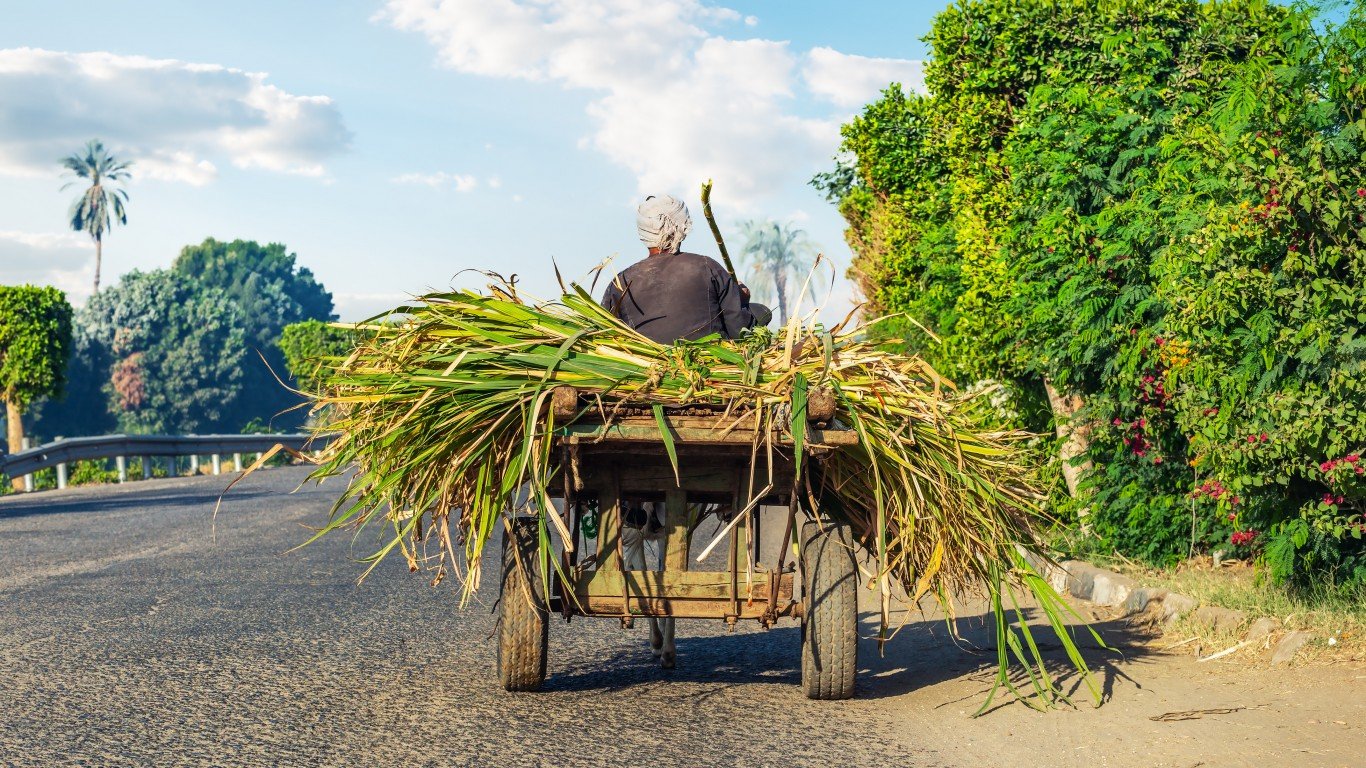
22. Egypt, Arab Rep.
> Imports as % of GDP, 2020: 20.65%
> Imports in current US$, 2020: $75.43 billion – #44 highest of 189 countries
> Annual imports growth, 2020: -17.89% – #26 largest decline of 170 countries
> Exports as % of GDP, 2020: 13.11% – #19 lowest of 190 countries
> Exports in current US$, 2020: $47.87 billion – #53 highest of 189 countries
> GDP in current US$, 2020: $365.25 billion – #30 highest of 190 countries
Egypt’s imports are valued at 21% of GDP, while its exports are valued at a far lower 13% of GDP. The country’s trade deficit has declined on a Annual basis so far in 2021 thanks to an increase in exports of commodities like fertilizers, plastics, fresh fruit, and clothing. Egypt has a population of about 102 million and has free trade agreements with other African countries, other Arab countries, the European Union, Turkey, and the South American trading bloc Mercosur.
[in-text-ad-2]

21. Russian Federation
> Imports as % of GDP, 2020: 20.56%
> Imports in current US$, 2020: $305.01 billion – #19 highest of 189 countries
> Annual imports growth, 2020: -11.98% – #60 largest decline of 170 countries
> Exports as % of GDP, 2020: 25.52% – #68 lowest of 190 countries
> Exports in current US$, 2020: $378.64 billion – #20 highest of 189 countries
> GDP in current US$, 2020: $1,483.50 billion – #11 highest of 190 countries
Russia recently negotiated a deal to boost wheat exports to China that it hopes would grab a larger share of the lucrative Chinese market from Western producers. By far, Russia’s primary export is fuels (petroleum oils, coal and natural gas), which make up more than half of all exports. The country of about 144 million has free trade agreements with several former Soviet states.
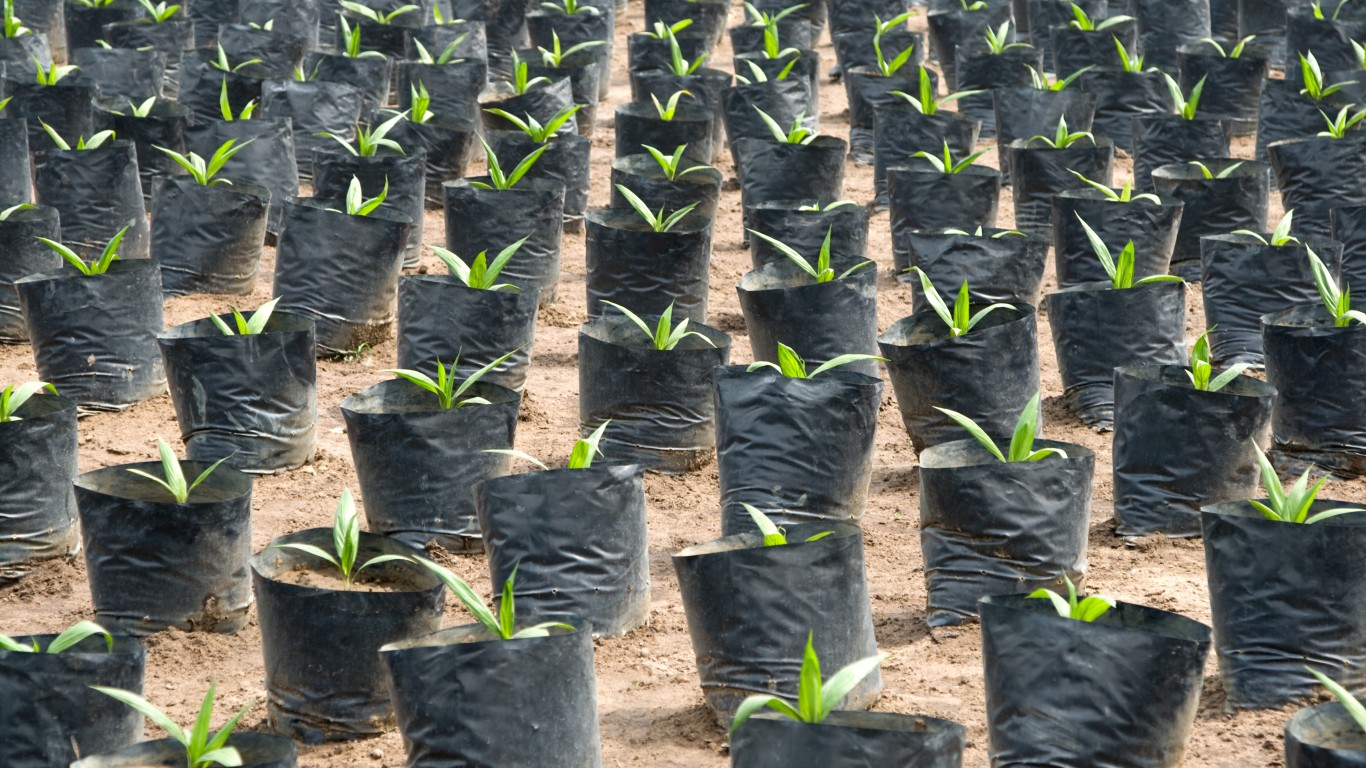
20. Côte d’Ivoire
> Imports as % of GDP, 2020: 20.46%
> Imports in current US$, 2020: $12.55 billion – #94 highest of 189 countries
> Annual imports growth, 2020: 7.57% – #13 largest increase of 170 countries
> Exports as % of GDP, 2020: 21.55% – #51 lowest of 190 countries
> Exports in current US$, 2020: $13.22 billion – #90 highest of 189 countries
> GDP in current US$, 2020: $61.35 billion – #76 highest of 190 countries
This Atlantic coastal African country with a population about 26 million is primarily an exporter of cash crops like cashew nuts, cocoa, and palm oil, as well as fresh vegetables and fuels. It imports primarily petroleum. The country is a signatory to African free trade pacts and has a deal through 2025 allowing it to export goods tariff-free to the United States.
[in-text-ad]

19. Colombia
> Imports as % of GDP, 2020: 20.13%
> Imports in current US$, 2020: $54.65 billion – #54 highest of 189 countries
> Annual imports growth, 2020: -17.30% – #30 largest decline of 170 countries
> Exports as % of GDP, 2020: 13.52% – #20 lowest of 190 countries
> Exports in current US$, 2020: $36.70 billion – #65 highest of 189 countries
> GDP in current US$, 2020: $271.44 billion – #40 highest of 190 countries
Colombia’s top export is oil, an economically crucial commodity that was hit hard by the COVID-19 pandemic and worsening rural security last year. The South American country of about 51 million people has regional and continental free trade agreements as well as free trade deals with the European Union, United States, South Korea, and Israel.
[recirclink id=970877]

18. Australia
> Imports as % of GDP, 2020: 20.06%
> Imports in current US$, 2020: $266.31 billion – #23 highest of 189 countries
> Annual imports growth, 2020: -7.67% – #45 smallest decline of 170 countries
> Exports as % of GDP, 2020: 23.98% – #62 lowest of 190 countries
> Exports in current US$, 2020: $318.47 billion – #22 highest of 189 countries
> GDP in current US$, 2020: $1,327.84 billion – #13 highest of 190 countries
Australia primarily imports petroleum and primarily exports commodities like minerals and fuels, which made up nearly half of its exports in 2019. Its top export market is China, which consumes a massive amount of Australian iron ore. Australia has a population of about 26 million, and it has numerous free trade agreements, including with China, Japan, South Korea and the United States.
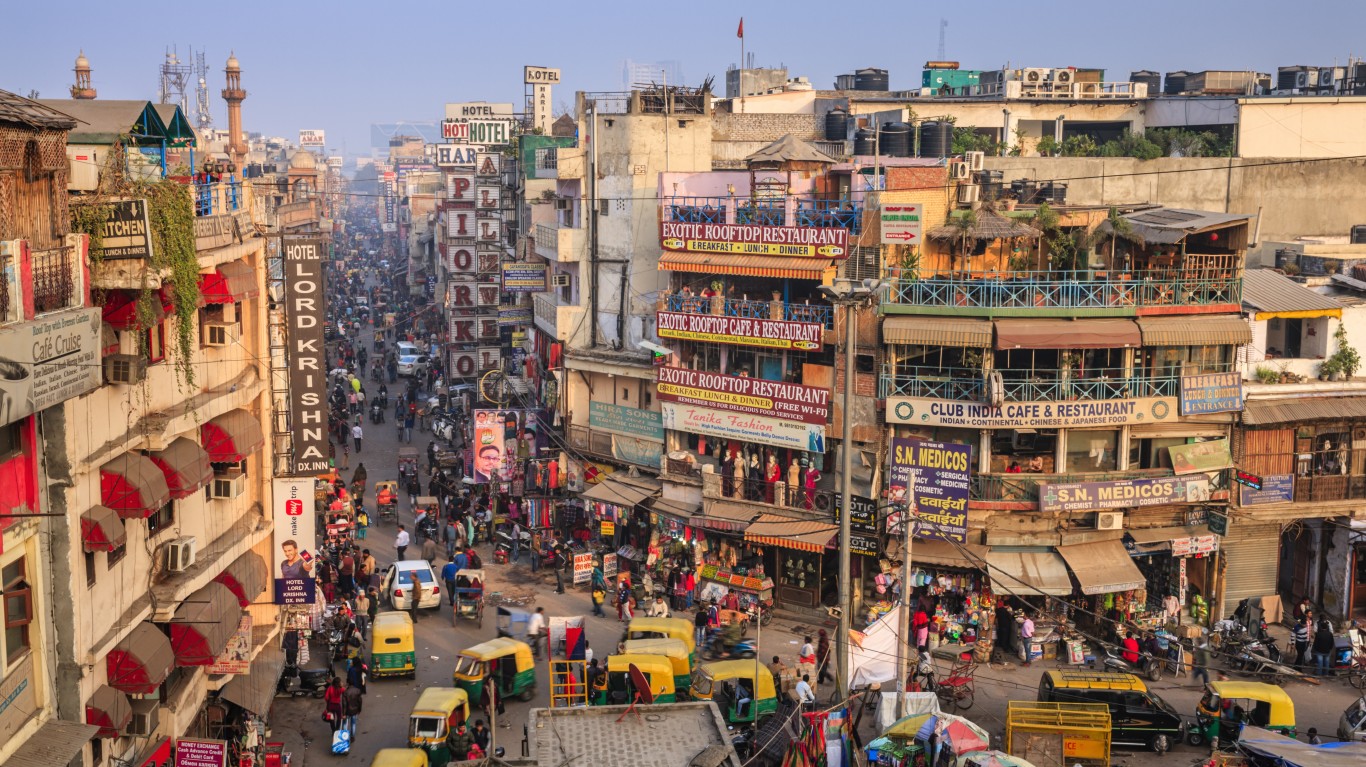
17. India
> Imports as % of GDP, 2020: 19.21%
> Imports in current US$, 2020: $510.98 billion – #10 highest of 189 countries
> Annual imports growth, 2020: -13.61% – #50 largest decline of 170 countries
> Exports as % of GDP, 2020: 18.66% – #40 lowest of 190 countries
> Exports in current US$, 2020: $496.49 billion – #13 highest of 189 countries
> GDP in current US$, 2020: $2,660.25 billion – #6 highest of 190 countries
India, the world’s second-most populous country with about 1.4 billion people, routinely maintains a trade deficit led by imports from China and the U.S. In December, India’s exports hit a record high, and despite the ongoing deficit (which is expected to widen on growing domestic demand), India is also a robust exporter of fuels, chemicals, stone and glass, metals, machinery, and transportation equipment.
[in-text-ad-2]
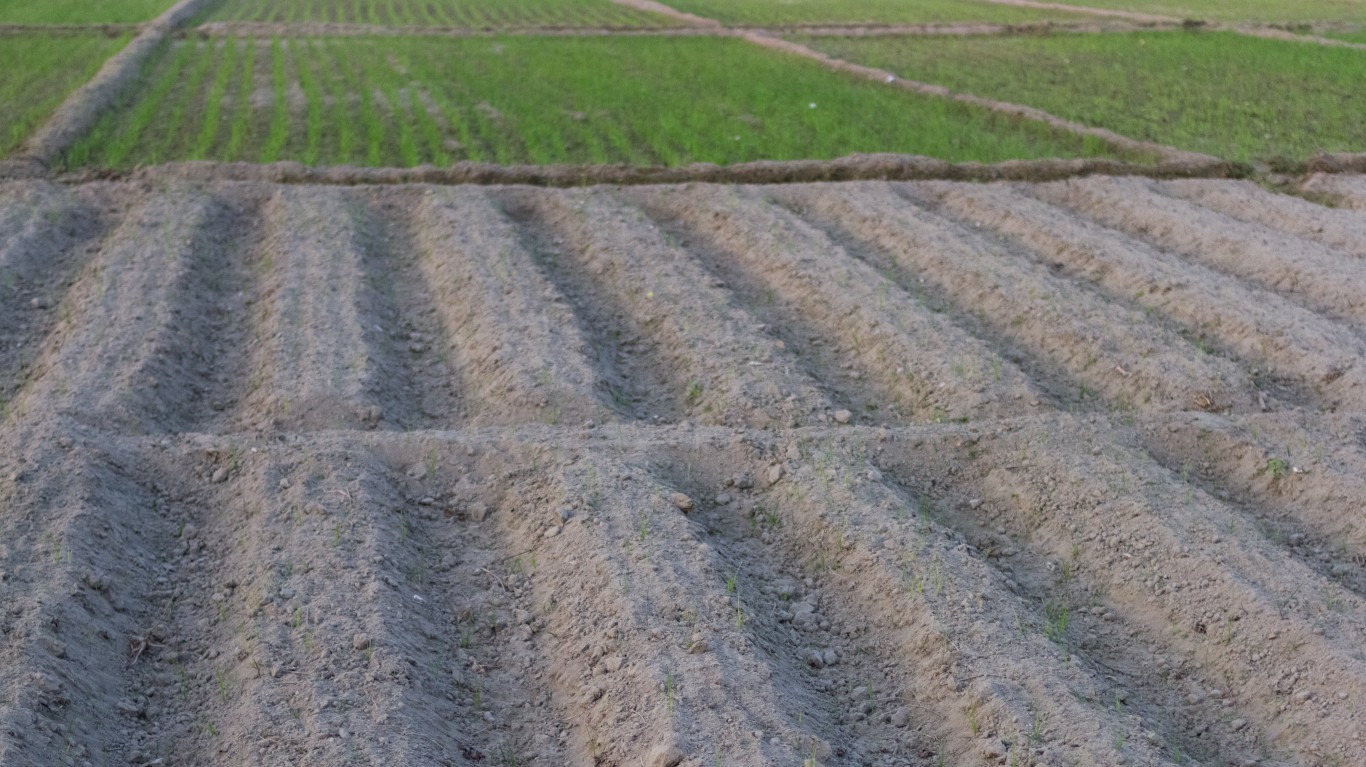
16. Bangladesh
> Imports as % of GDP, 2020: 18.53%
> Imports in current US$, 2020: $59.86 billion – #51 highest of 189 countries
> Annual imports growth, 2020: -10.44% – #69 smallest decline of 170 countries
> Exports as % of GDP, 2020: 11.99% – #17 lowest of 190 countries
> Exports in current US$, 2020: $38.73 billion – #61 highest of 189 countries
> GDP in current US$, 2020: $323.06 billion – #39 highest of 190 countries
Textiles and clothing make up about 90% of Bangladesh’s export business, most of which end up in the United States and Europe. The South Asian country of about 165 million people recently opened direct-freight service to Europe from its largest port that is expected to speed up delivery and reduce shipping costs of the country’s apparel exports. Still, the country imports far more than it exports.

15. Cameroon
> Imports as % of GDP, 2020: 18.23%
> Imports in current US$, 2020: $7.44 billion – #77 lowest of 189 countries
> Annual imports growth, 2020: -17.21% – #32 largest decline of 170 countries
> Exports as % of GDP, 2020: 15.04% – #23 lowest of 190 countries
> Exports in current US$, 2020: $6.13 billion – #76 lowest of 189 countries
> GDP in current US$, 2020: $40.80 billion – #91 highest of 190 countries
This largely agrarian African country on the Atlantic coast with a population of about 27 million exports primarily petroleum oils, cocoa beans and tropical wood, and cotton, primarily to European countries (led by Italy) and China. The Cameroon government is pursuing the development of hydroelectric power ostensibly to help reduce its dependence on imported fuels.
[in-text-ad]

14. Kenya
> Imports as % of GDP, 2020: 17.68%
> Imports in current US$, 2020: $17.85 billion – #87 highest of 189 countries
> Annual imports growth, 2020: -8.48% – #54 smallest decline of 170 countries
> Exports as % of GDP, 2020: 9.68% – #13 lowest of 190 countries
> Exports in current US$, 2020: $9.78 billion – #94 highest of 189 countries
> GDP in current US$, 2020: $101.01 billion – #64 highest of 190 countries
The seventh largest African country by population (about 54 million) has seen its trade deficit surge on domestic demand for fuel and industrial products as the world begins to emerge from the disruptions to global trade caused by the COVID-19 pandemic. Kenya’s primary export is vegetables, followed by food products, chemicals, and textiles and clothing. Free-trade negotiations between Kenya and the United States are ongoing.
[recirclink id=1041570]

13. Pakistan
> Imports as % of GDP, 2020: 17.45%
> Imports in current US$, 2020: $45.82 billion – #59 highest of 189 countries
> Annual imports growth, 2020: -7.91% – #49 smallest decline of 170 countries
> Exports as % of GDP, 2020: 10.03% – #14 lowest of 190 countries
> Exports in current US$, 2020: $26.34 billion – #67 highest of 189 countries
> GDP in current US$, 2020: $262.61 billion – #43 highest of 190 countries
Like Bangladesh, Pakistan is heavily reliant on the export of textiles and clothing, which make up about 57% of the South Asian country’s exports. Pakistan, with a population of about 221 million, recently announced efforts to reduce its dependence on textiles and clothing exports by targeting higher-value industries like pharmaceuticals and engineering. The country’s imports are considerably higher than its exports and primarily consist of petroleum.
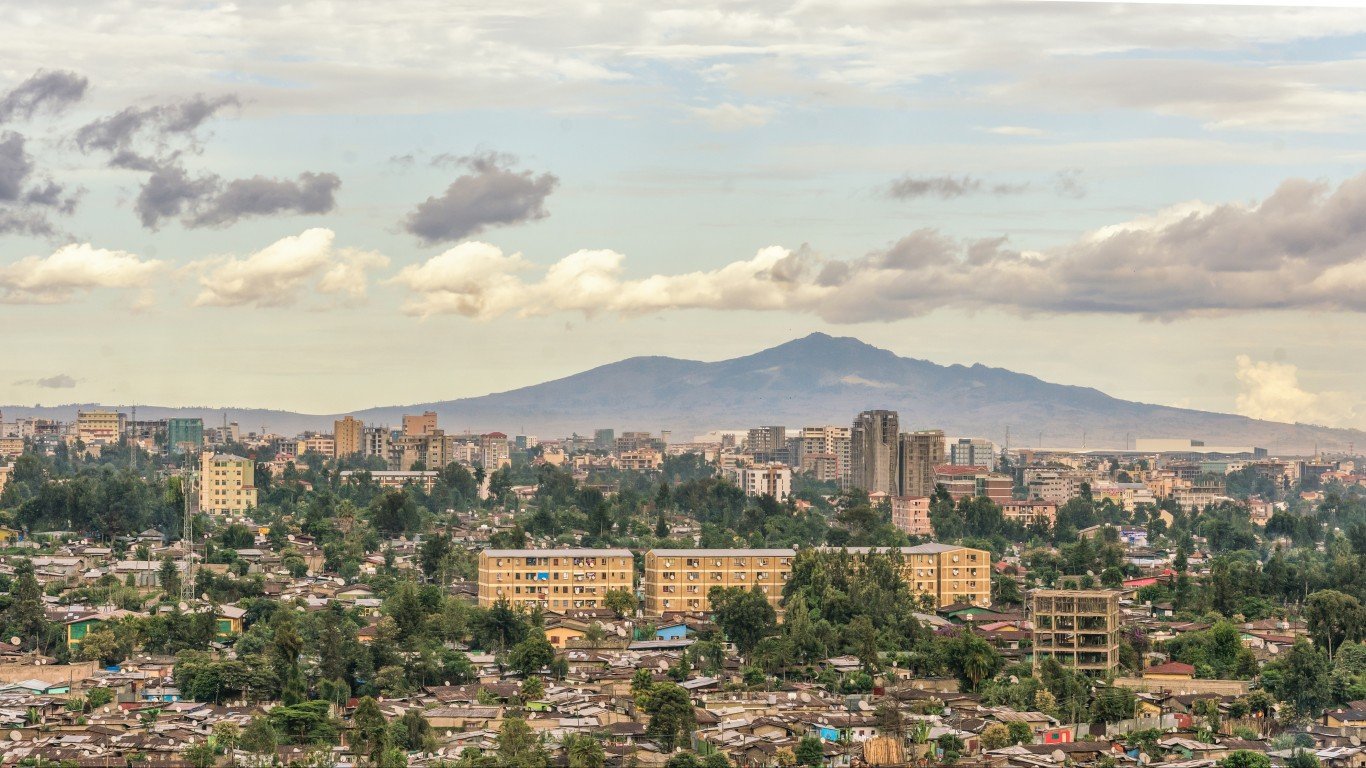
12. Ethiopia
> Imports as % of GDP, 2020: 16.93%
> Imports in current US$, 2020: $18.22 billion – #85 highest of 189 countries
> Annual imports growth, 2020: 15.60% – #5 largest increase of 170 countries
> Exports as % of GDP, 2020: 7.09% – #7 lowest of 190 countries
> Exports in current US$, 2020: $7.63 billion – #88 lowest of 189 countries
> GDP in current US$, 2020: $107.65 billion – #59 highest of 190 countries
This East African country of about 115 million people recently lost its duty-free access to the United States in response to Ethiopia’s war in the Tigray region and related “gross violations” of human rights, per the Biden administration. The country is heavily reliant on exports of coffee and fresh vegetables, and its top three export markets are China, Saudi Arabia, and the U.S. The country imports far more than it exports, importing primarily petroleum and aircraft.
[in-text-ad-2]
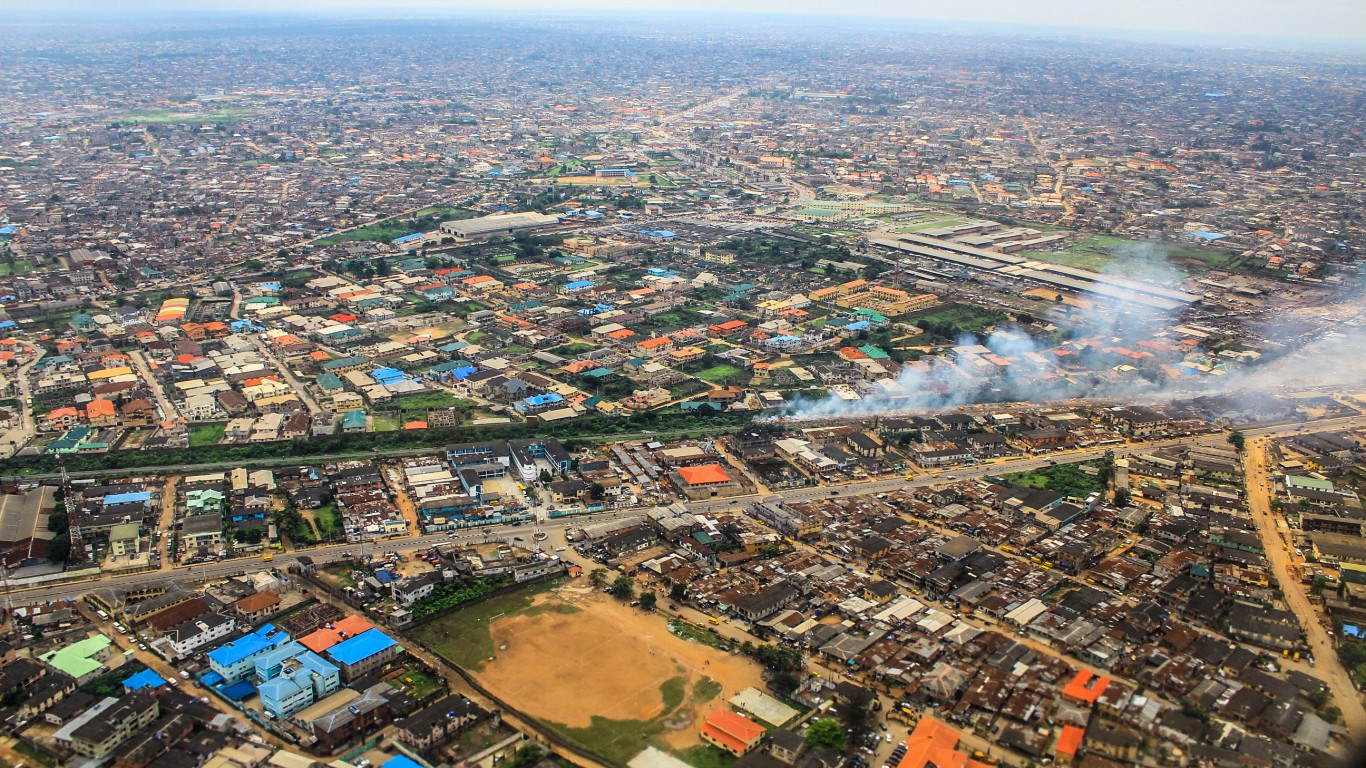
11. Nigeria
> Imports as % of GDP, 2020: 16.57%
> Imports in current US$, 2020: $71.63 billion – #47 highest of 189 countries
> Annual imports growth, 2020: -23.30% – #14 largest decline of 170 countries
> Exports as % of GDP, 2020: 8.83% – #11 lowest of 190 countries
> Exports in current US$, 2020: $38.17 billion – #63 highest of 189 countries
> GDP in current US$, 2020: $432.29 billion – #26 highest of 190 countries
Africa’s most-populous country (about 206 million people) and largest economy is planning to boost its non-oil exports over the next five years. Fuels make up about 87% of the country’s exports. Nigeria benefits from duty-free access to the U.S. market through the U.S. African Growth and Opportunity Act that’s up for renewal in 2025.

10. Indonesia
> Imports as % of GDP, 2020: 16.02%
> Imports in current US$, 2020: $169.58 billion – #32 highest of 189 countries
> Annual imports growth, 2020: -14.71% – #46 largest decline of 170 countries
> Exports as % of GDP, 2020: 17.17% – #35 lowest of 190 countries
> Exports in current US$, 2020: $181.71 billion – #32 highest of 189 countries
> GDP in current US$, 2020: $1,058.42 billion – #16 highest of 190 countries
Indonesia’s trade surplus plummeted recently after it suspended coal exports due to low inventory at its power plants. The primary exports from this country of about 274 million include fuels, vegetables, machinery and electronics, metals, and textiles and clothing. Indonesia managed a trade surplus for seven years from 2008 to 2020, and its trade deficits are relatively small.
[in-text-ad]

9. China
> Imports as % of GDP, 2020: 16.01%
> Imports in current US$, 2020: $2,357.11 billion – #2 highest of 189 countries
> Annual imports growth, 0: No data
> Exports as % of GDP, 2020: 18.50% – #39 lowest of 190 countries
> Exports in current US$, 2020: $2,723.25 billion – #1 highest of 189 countries
> GDP in current US$, 2020: $14,722.73 billion – #2 highest of 190 countries
The world’s most populous country regularly maintains an annual trade surplus with the rest of the world. The country of about 1.4 billion people broke its record for alloy aluminum imports last year, while exports of refined lead and tin surged in the same period. China maintains 17 free trade agreements and 14 regional economic partnerships. The country’s top export is machinery and electronics.
[recirclink id=1033345]

8. Japan
> Imports as % of GDP, 2020: 15.54%
> Imports in current US$, 2020: $786.22 billion – #5 highest of 189 countries
> Annual imports growth, 2020: -7.28% – #39 smallest decline of 170 countries
> Exports as % of GDP, 2020: 15.53% – #26 lowest of 190 countries
> Exports in current US$, 2020: $785.37 billion – #4 highest of 189 countries
> GDP in current US$, 2020: $5,057.76 billion – #3 highest of 190 countries
Japan’s exports and imports surged recently due to rising oil prices and a weaker yen. With a population of about 126 million, Japan has a highly diversified economy and trade pacts with dozens of countries. Japan’s primary exports are machinery and electronics and transportation equipment, which make up about 56% of its exports.
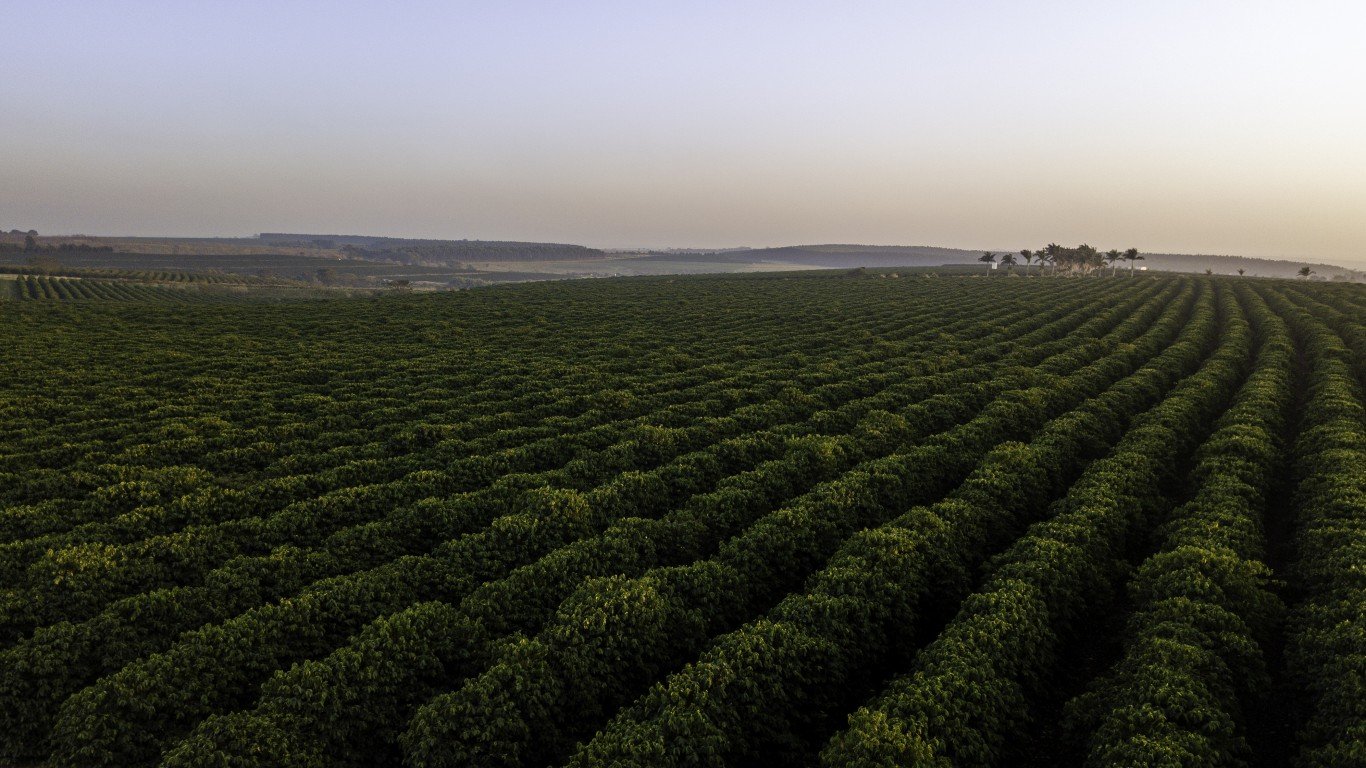
7. Brazil
> Imports as % of GDP, 2020: 15.48%
> Imports in current US$, 2020: $223.69 billion – #26 highest of 189 countries
> Annual imports growth, 2020: -9.95% – #66 smallest decline of 170 countries
> Exports as % of GDP, 2020: 16.87% – #32 lowest of 190 countries
> Exports in current US$, 2020: $243.74 billion – #25 highest of 189 countries
> GDP in current US$, 2020: $1,444.73 billion – #12 highest of 190 countries
Latin America’s largest economy with a population of about 213 million is significantly diverse. While livestock and fresh produce make up about a fourth of its exports, the country is also a major exporter of food products, minerals, fuels, chemicals, wood, metals, and machinery. The country routinely maintains an annual trade surplus.
[in-text-ad-2]

6. Tanzania
> Imports as % of GDP, 2020: 15.31%
> Imports in current US$, 2020: $9.55 billion – #88 lowest of 189 countries
> Annual imports growth, 2020: -7.58% – #42 smallest decline of 170 countries
> Exports as % of GDP, 2020: 14.30% – #21 lowest of 190 countries
> Exports in current US$, 2020: $8.92 billion – #94 lowest of 189 countries
> GDP in current US$, 2020: $62.41 billion – #74 highest of 190 countries
This western African coastal country of about 60 million maintains a large trade deficit. Its primary exports include metals, machinery, food products, livestock, and fresh vegetables. Its top export markets are regional, led by Rwanda and Kenya, while the leading sources of imports are China and India.
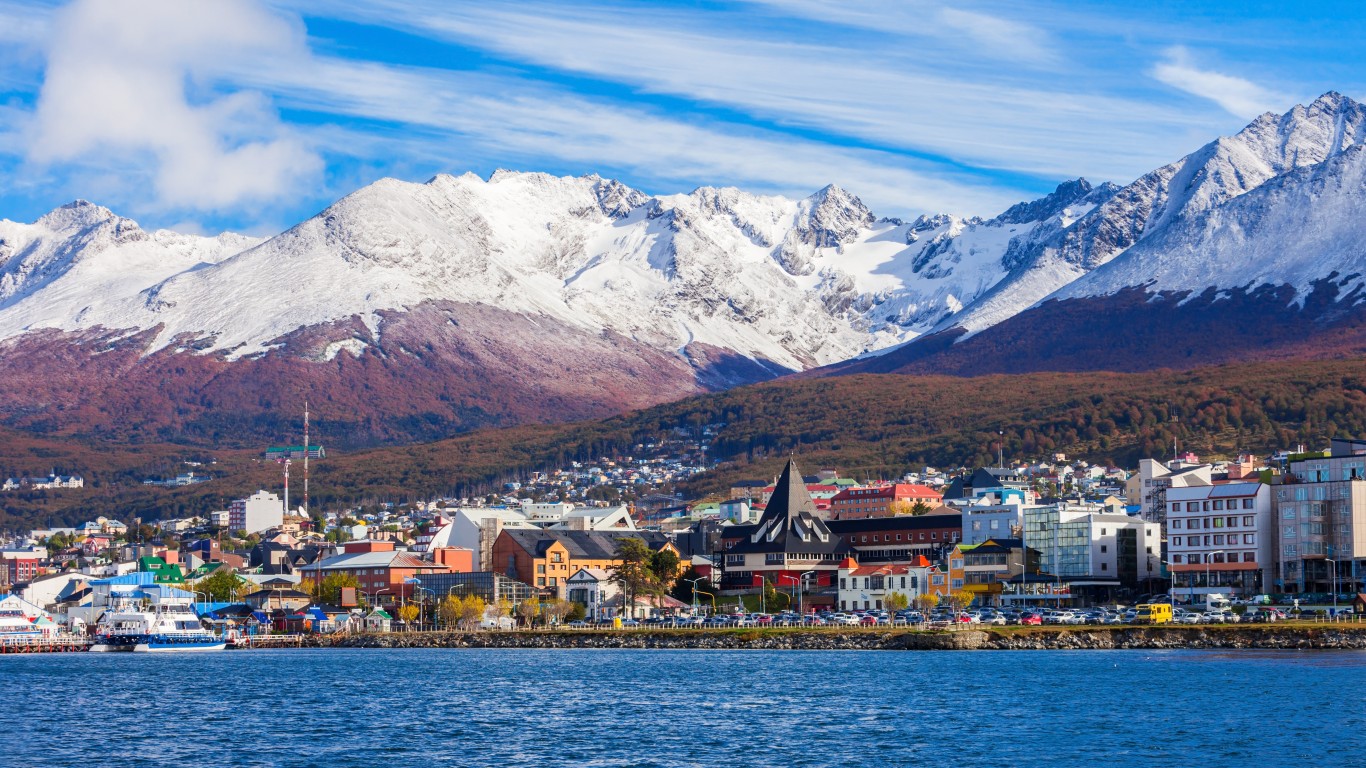
5. Argentina
> Imports as % of GDP, 2020: 13.56%
> Imports in current US$, 2020: $52.77 billion – #55 highest of 189 countries
> Annual imports growth, 2020: -17.87% – #27 largest decline of 170 countries
> Exports as % of GDP, 2020: 16.59% – #31 lowest of 190 countries
> Exports in current US$, 2020: $64.59 billion – #48 highest of 189 countries
> GDP in current US$, 2020: $389.29 billion – #29 highest of 190 countries
Argentina is still reeling from a recent economic crisis and has yet to recover from the pandemic-related downturn that exacerbated the country’s economic woes. With a population of about 43 million, the country’s main exports are vegetables and livestock, food products, and transportation equipment. Its top import and export market is neighboring Brazil.
[in-text-ad]

4. United States
> Imports as % of GDP, 2020: 13.28%
> Imports in current US$, 2020: $2,774.60 billion – #1 highest of 189 countries
> Annual imports growth, 2020: -8.93% – #60 smallest decline of 170 countries
> Exports as % of GDP, 2020: 10.16% – #15 lowest of 190 countries
> Exports in current US$, 2020: $2,123.41 billion – #2 highest of 189 countries
> GDP in current US$, 2020: $20,893.75 billion – #1 highest of 190 countries
Unlike China, which routinely maintains a trade surplus, the United States routinely maintains a trade deficit. But with a more diverse economy, the country of about 330 million people depends less on imports than China. The country’s top exports include machinery and electronics, transportation equipment, fuels, chemicals, and metals.
[recirclink id=1023112]

3. Turkmenistan
> Imports as % of GDP, 2018: 12.50%
> Imports in current US$, 2018: $5.09 billion – #60 lowest of 189 countries
> Annual imports growth, 0: No data
> Exports as % of GDP, 2018: 22.66% – #57 lowest of 190 countries
> Exports in current US$, 2018: $9.24 billion – #95 lowest of 189 countries
> GDP in current US$, 2019: $45.23 billion – #87 highest of 190 countries
This small central Asian country of about 6 million people is primarily an exporter of fuels (mostly natural gas), which make up about 81% of its exports, followed by textiles and clothing. Its primary bilateral trading partner is Russia. Its second largest export market is Italy, and its second-largest source of imports is Turkey.
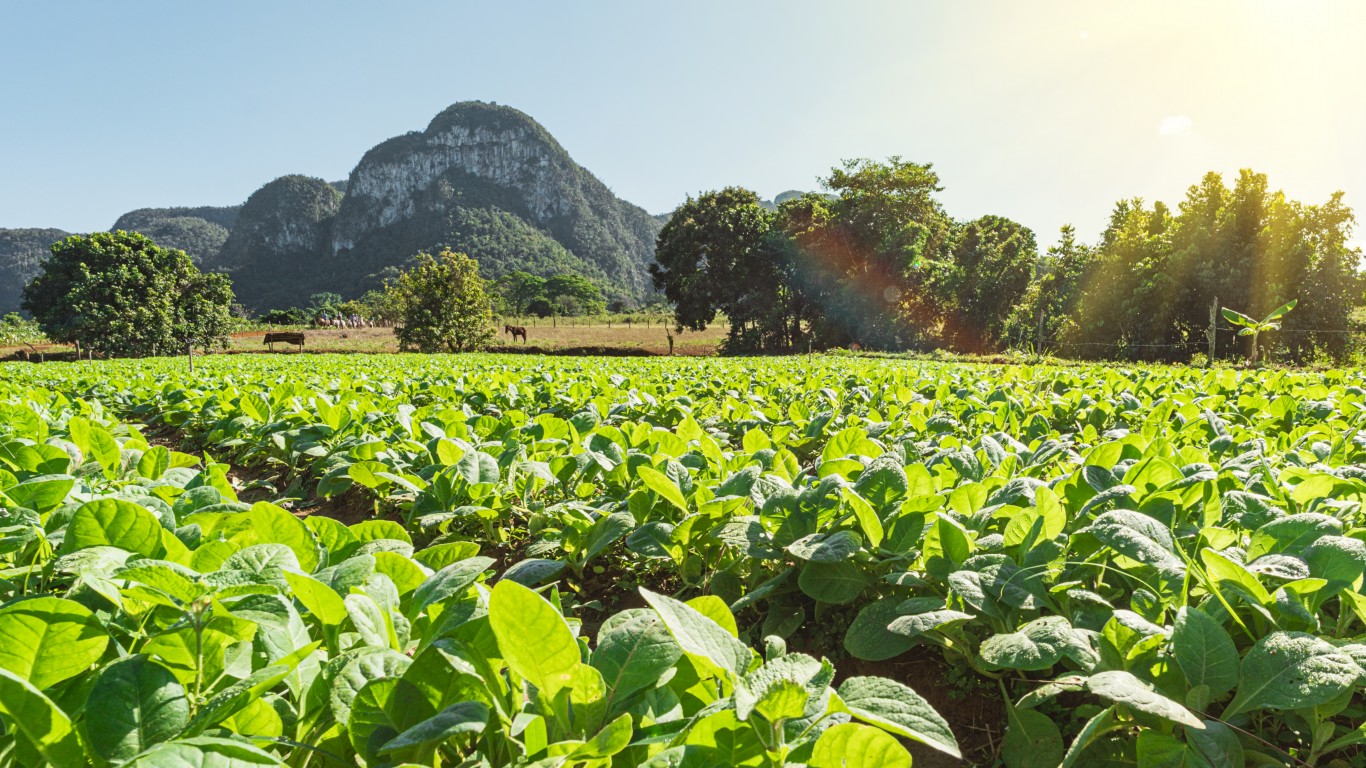
2. Cuba
> Imports as % of GDP, 2020: 7.51%
> Imports in current US$, 2020: $8.07 billion – #80 lowest of 189 countries
> Annual imports growth, 2020: -7.61% – #43 smallest decline of 170 countries
> Exports as % of GDP, 2020: 8.17% – #10 lowest of 190 countries
> Exports in current US$, 2020: $8.77 billion – #93 lowest of 189 countries
> GDP in current US$, 2020: $107.35 billion – #60 highest of 190 countries
The Communist Caribbean island country of about 11 million people is among the world’s most self-reliant based on imports as a share of GDP. Cuba has recently been reeling from the COVID-19 pandemic’s effect on its vital tourism trade. Primary exports include cigars and medicines, and primary imports include diesel power generators and refrigerators. Its primary trading partners are Venezuela, Spain, Russia, and China.
[in-text-ad-2]

1. Sudan
> Imports as % of GDP, 2020: 0.35%
> Imports in current US$, 2020: $0.07 billion – #1 lowest of 189 countries
> Annual imports growth, 2020: -3.90% – #19 smallest decline of 170 countries
> Exports as % of GDP, 2020: 0.44% – #1 lowest of 190 countries
> Exports in current US$, 2020: $0.09 billion – #6 lowest of 189 countries
> GDP in current US$, 2020: $21.33 billion – #80 lowest of 190 countries
Out of necessity, this country of 44 million is the world’s most self-reliant with only a sliver of outgoing or incoming trade thanks to years of civil war and social unrest. Sudan’s top exports are livestock, fresh vegetables, and stone and glass. Its top export market is the United Arab Emirates, and the top source of imports is China.
Contact [email protected] for any questions or corrections.