
The share of Americans under the age of 65 without health insurance fell every year between 2010, when the Affordable Care Act was signed into law, and 2016, when President Barack Obama left office. Though the uninsured rate among Americans younger than 65 has inched up over the years since, it remains well below the 17%+ figures in the years leading up to the ACA.
Without a universal health care program, employer-based health insurance covers most Americans under age 65. Under this system, 10.3% of Americans younger than 65, approximately 25 million people, lacked health insurance in 2019 — and that was before the COVID-19 pandemic put over 22 million Americans out of work.
While most of those jobs have since been restored, the official 2020 uninsured rate for Americans under 65 will likely be higher than the 2019 rate, which, in some parts of the country, was already well above the national uninsured rate levels from before the passing of the ACA.
Using data from the U.S. Census Bureau, 24/7 Tempo identified the county or county equivalent, with the worst health insurance coverage in every state. Counties were ranked based on the share of residents under age 65 — the age of eligibility for Medicare — who are uninsured.
Uninsured rates vary considerably across the country, and as a result, a county’s ranking on this list does not necessarily mean the uninsured rate is high relative to the nation as a whole. In several states, particularly in New England and parts of the Midwest, the highest uninsured rate among counties is in the single digits. Uninsured rates in the counties on this list range from 3.9% all the way up to 38.3%. (These are the cities with the worst health insurance coverage in every state.)
Click here to see the county with the worst health insurance coverage in every state
Click here to read our detailed methodology
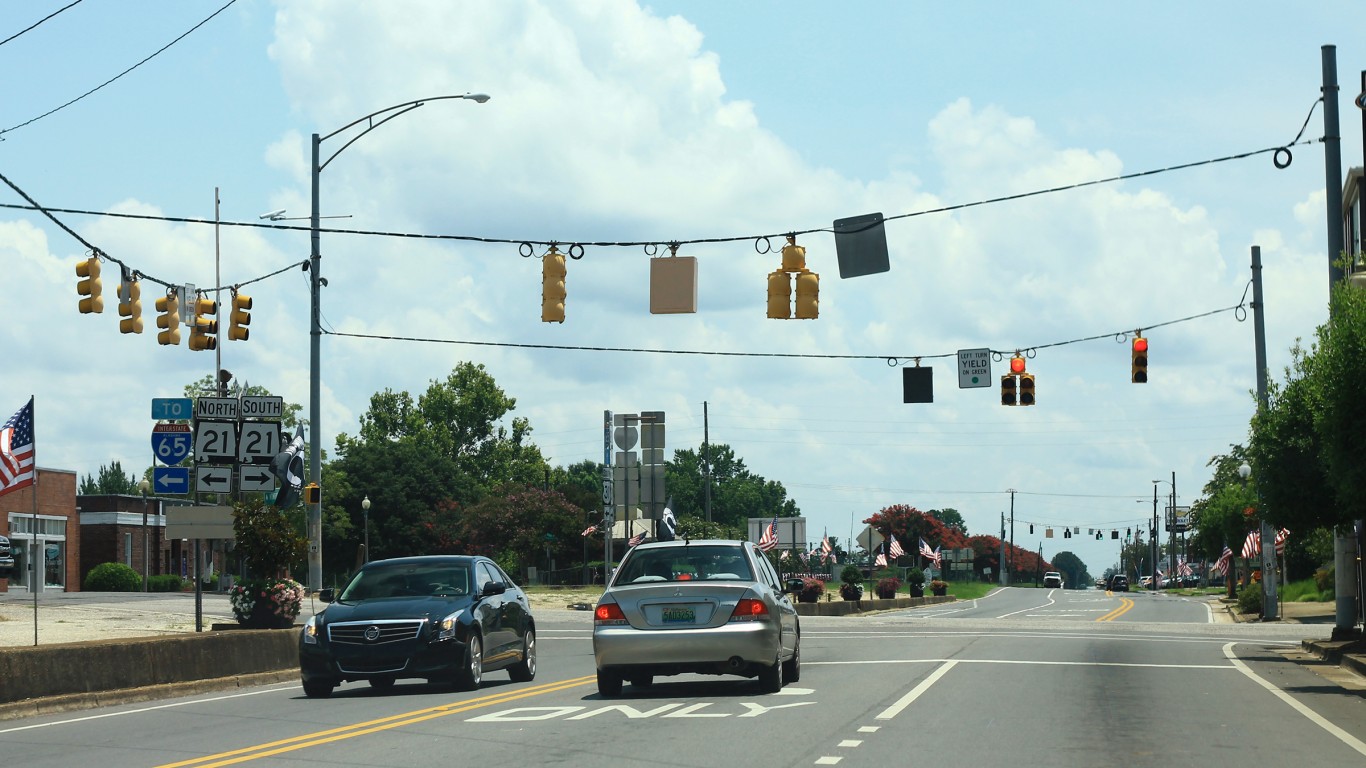
Alabama: Escambia County
> Americans under 65, no health insurance: 17.4% (Alabama: 11.3%)
> Americans under 65, Medicare coverage (or multiple types): 4.7% (Alabama: 4.9%)
> Americans under 65, Medicaid coverage (or multiple types): 20.3% (Alabama: 20.9%)
> Americans under 65, VA coverage (or multiple types): 1.1% (Alabama: 1.7%)
> Americans under 65, employer-based insurance (or multiple types): 54.8% (Alabama: 57.8%)
> Americans under 65, direct-purchase insurance (or multiple types): 7.2% (Alabama: 10.5%)
> Americans under 65, Tricare/military insurance (or many types): 1.8% (Alabama: 3.3%)
[in-text-ad]
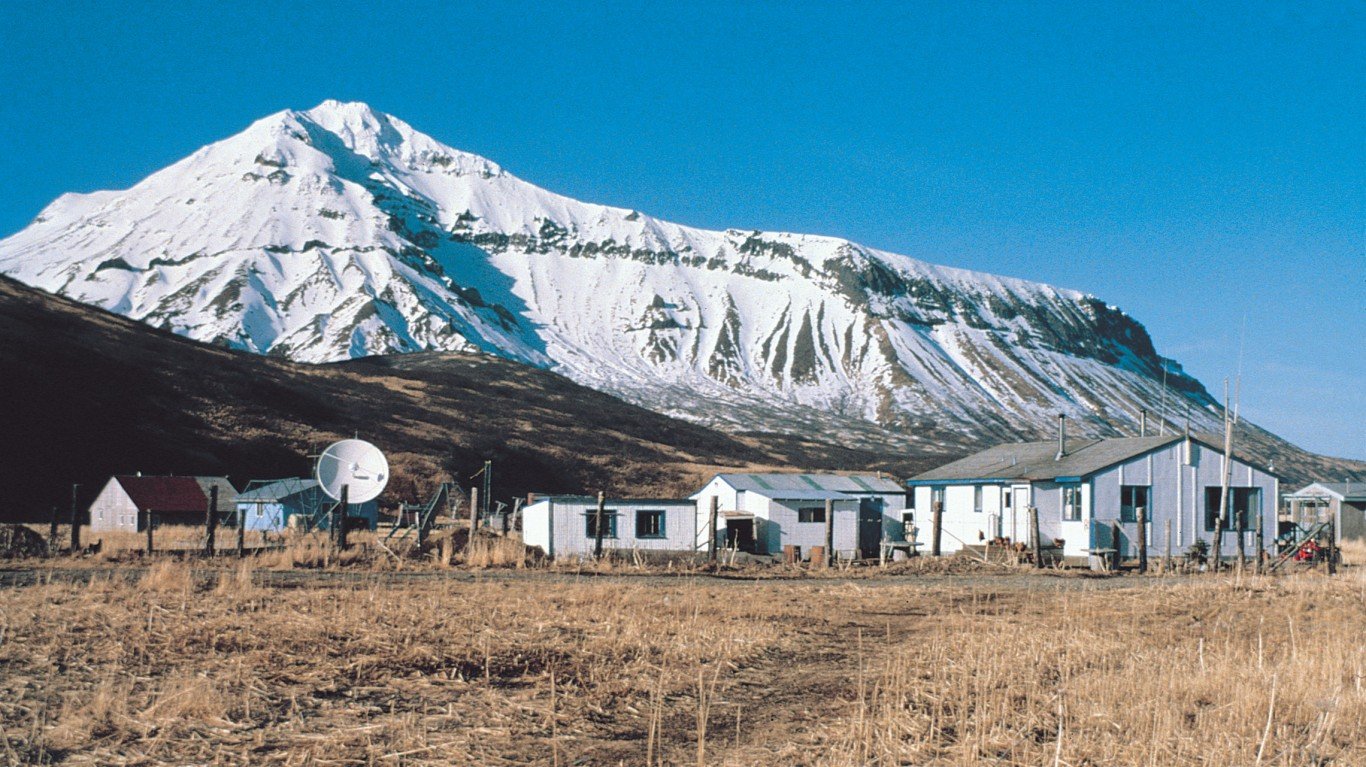
Alaska: Aleutians East Borough
> Americans under 65, no health insurance: 50.6% (Alaska: 15.3%)
> Americans under 65, Medicare coverage (or multiple types): 0.9% (Alaska: 1.9%)
> Americans under 65, Medicaid coverage (or multiple types): 13.7% (Alaska: 21.1%)
> Americans under 65, VA coverage (or multiple types): 0.4% (Alaska: 3.0%)
> Americans under 65, employer-based insurance (or multiple types): 31.8% (Alaska: 54.4%)
> Americans under 65, direct-purchase insurance (or multiple types): 4.0% (Alaska: 6.9%)
> Americans under 65, Tricare/military insurance (or many types): 0.3% (Alaska: 9.6%)
[recirclink id=887931]
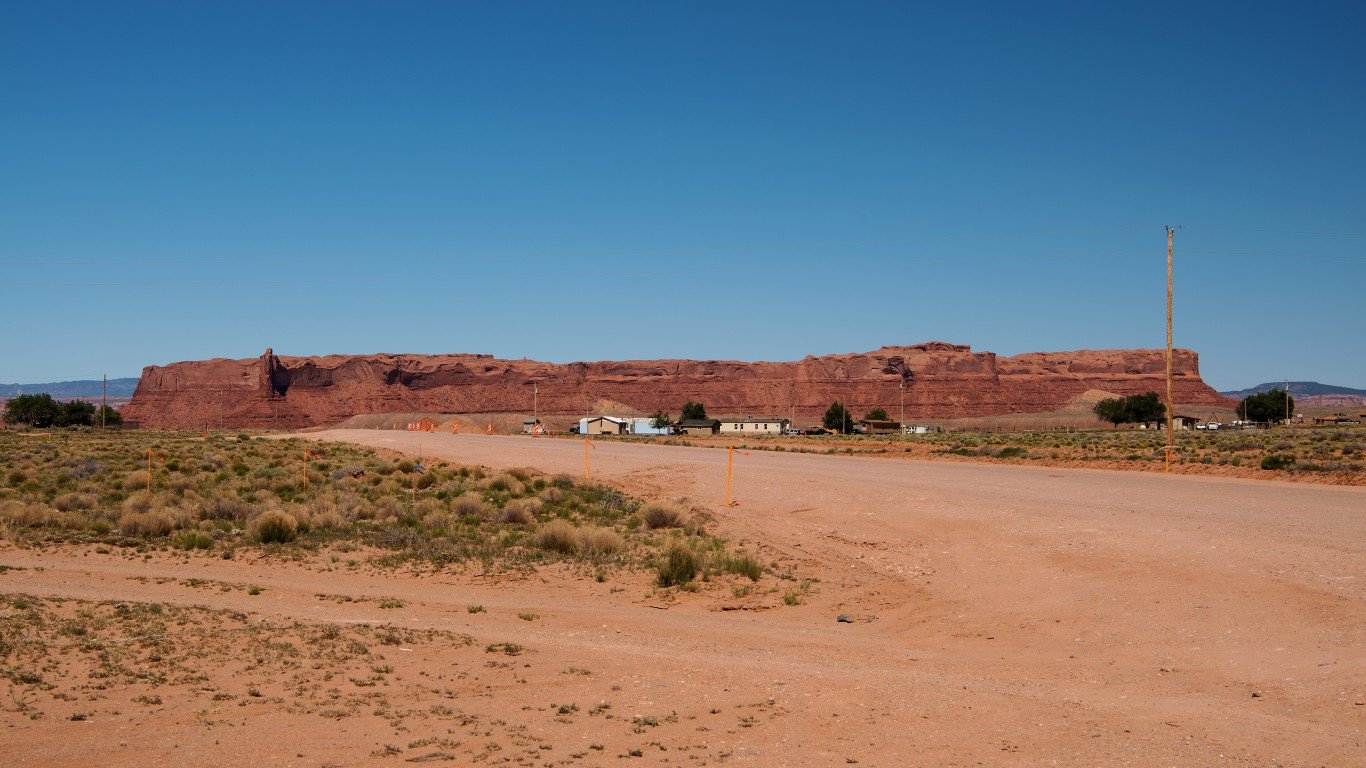
Arizona: Apache County
> Americans under 65, no health insurance: 28.7% (Arizona: 12.4%)
> Americans under 65, Medicare coverage (or multiple types): 3.6% (Arizona: 2.6%)
> Americans under 65, Medicaid coverage (or multiple types): 37.3% (Arizona: 24.1%)
> Americans under 65, VA coverage (or multiple types): 0.6% (Arizona: 1.5%)
> Americans under 65, employer-based insurance (or multiple types): 31.4% (Arizona: 55.1%)
> Americans under 65, direct-purchase insurance (or multiple types): 2.0% (Arizona: 9.7%)
> Americans under 65, Tricare/military insurance (or many types): 0.8% (Arizona: 2.4%)

Arkansas: Sevier County
> Americans under 65, no health insurance: 19.1% (Arkansas: 10.1%)
> Americans under 65, Medicare coverage (or multiple types): 2.6% (Arkansas: 5.1%)
> Americans under 65, Medicaid coverage (or multiple types): 33.2% (Arkansas: 28.6%)
> Americans under 65, VA coverage (or multiple types): 0.8% (Arkansas: 1.8%)
> Americans under 65, employer-based insurance (or multiple types): 42.9% (Arkansas: 51.8%)
> Americans under 65, direct-purchase insurance (or multiple types): 7.1% (Arkansas: 10.2%)
> Americans under 65, Tricare/military insurance (or many types): 1.3% (Arkansas: 2.3%)
[in-text-ad-2]
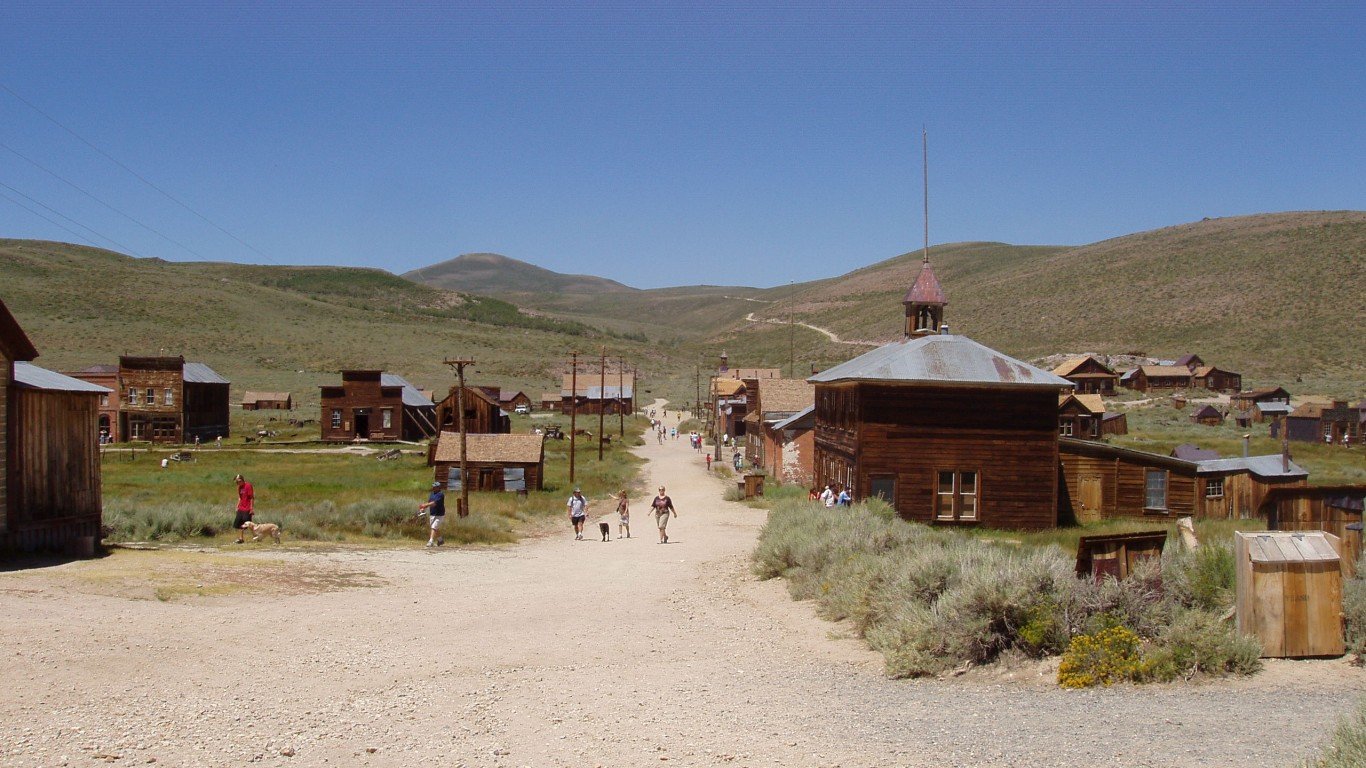
California: Mono County
> Americans under 65, no health insurance: 17.9% (California: 8.6%)
> Americans under 65, Medicare coverage (or multiple types): 2.6% (California: 2.2%)
> Americans under 65, Medicaid coverage (or multiple types): 16.6% (California: 27.1%)
> Americans under 65, VA coverage (or multiple types): 1.9% (California: 0.9%)
> Americans under 65, employer-based insurance (or multiple types): 51.9% (California: 55.7%)
> Americans under 65, direct-purchase insurance (or multiple types): 15.0% (California: 10.9%)
> Americans under 65, Tricare/military insurance (or many types): 2.9% (California: 1.4%)
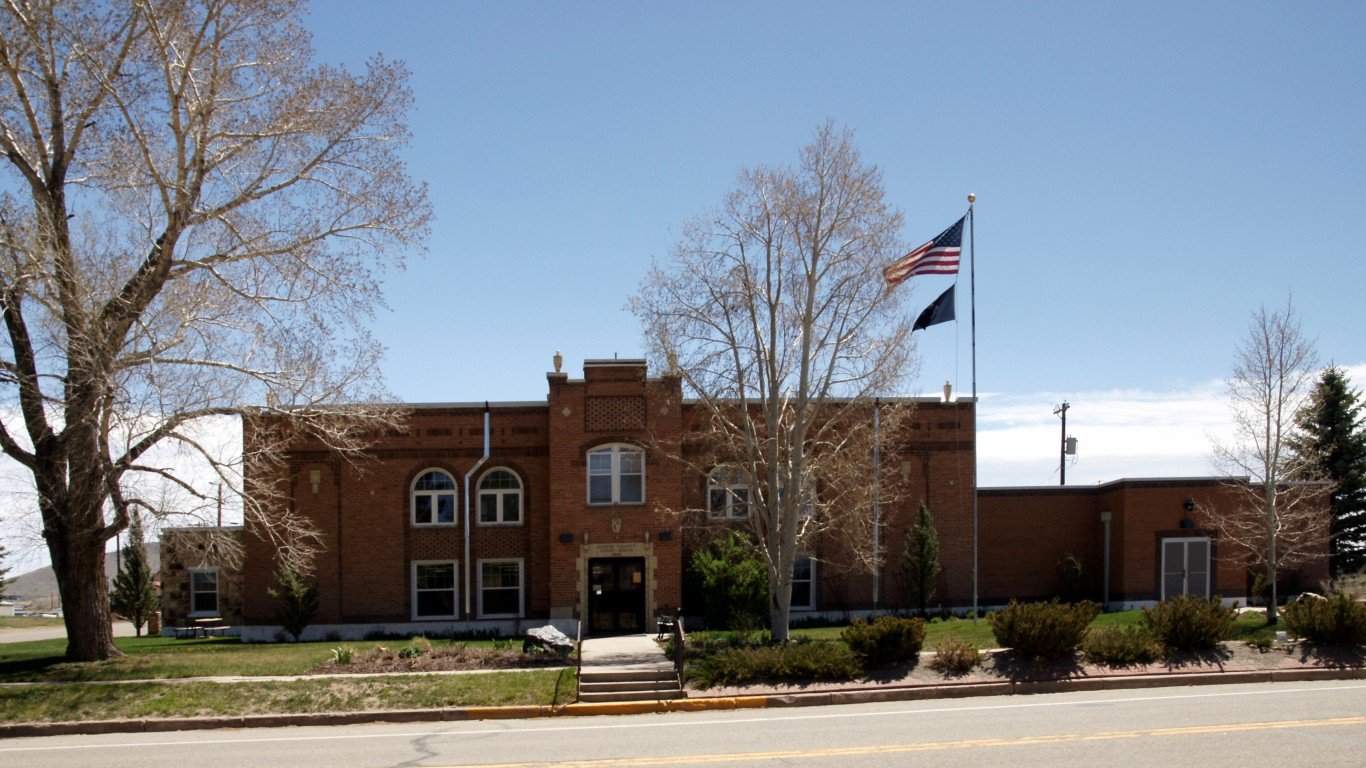
Colorado: Custer County
> Americans under 65, no health insurance: 25.4% (Colorado: 8.7%)
> Americans under 65, Medicare coverage (or multiple types): 3.8% (Colorado: 2.1%)
> Americans under 65, Medicaid coverage (or multiple types): 28.0% (Colorado: 19.8%)
> Americans under 65, VA coverage (or multiple types): 3.6% (Colorado: 1.5%)
> Americans under 65, employer-based insurance (or multiple types): 28.0% (Colorado: 60.5%)
> Americans under 65, direct-purchase insurance (or multiple types): 19.5% (Colorado: 11.4%)
> Americans under 65, Tricare/military insurance (or many types): 5.4% (Colorado: 3.5%)
[in-text-ad]

Connecticut: Fairfield County
> Americans under 65, no health insurance: 9.7% (Connecticut: 6.3%)
> Americans under 65, Medicare coverage (or multiple types): 1.6% (Connecticut: 2.4%)
> Americans under 65, Medicaid coverage (or multiple types): 18.7% (Connecticut: 21.6%)
> Americans under 65, VA coverage (or multiple types): 0.4% (Connecticut: 0.7%)
> Americans under 65, employer-based insurance (or multiple types): 63.8% (Connecticut: 65.1%)
> Americans under 65, direct-purchase insurance (or multiple types): 10.4% (Connecticut: 9.4%)
> Americans under 65, Tricare/military insurance (or many types): 0.3% (Connecticut: 1.0%)
[recirclink id=931632]
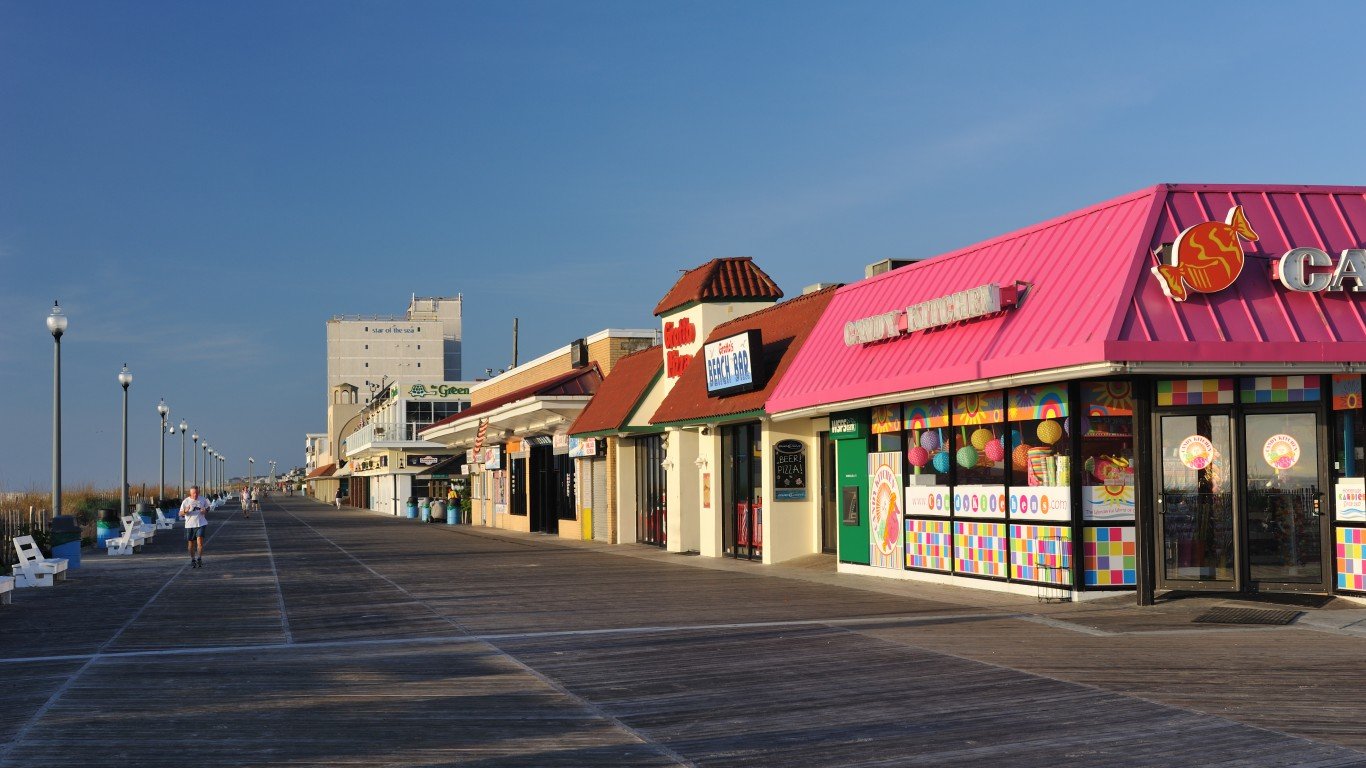
Delaware: Sussex County
> Americans under 65, no health insurance: 9.0% (Delaware: 6.8%)
> Americans under 65, Medicare coverage (or multiple types): 4.0% (Delaware: 3.3%)
> Americans under 65, Medicaid coverage (or multiple types): 26.3% (Delaware: 22.5%)
> Americans under 65, VA coverage (or multiple types): 0.9% (Delaware: 1.0%)
> Americans under 65, employer-based insurance (or multiple types): 56.5% (Delaware: 64.4%)
> Americans under 65, direct-purchase insurance (or multiple types): 9.9% (Delaware: 8.6%)
> Americans under 65, Tricare/military insurance (or many types): 1.6% (Delaware: 2.6%)

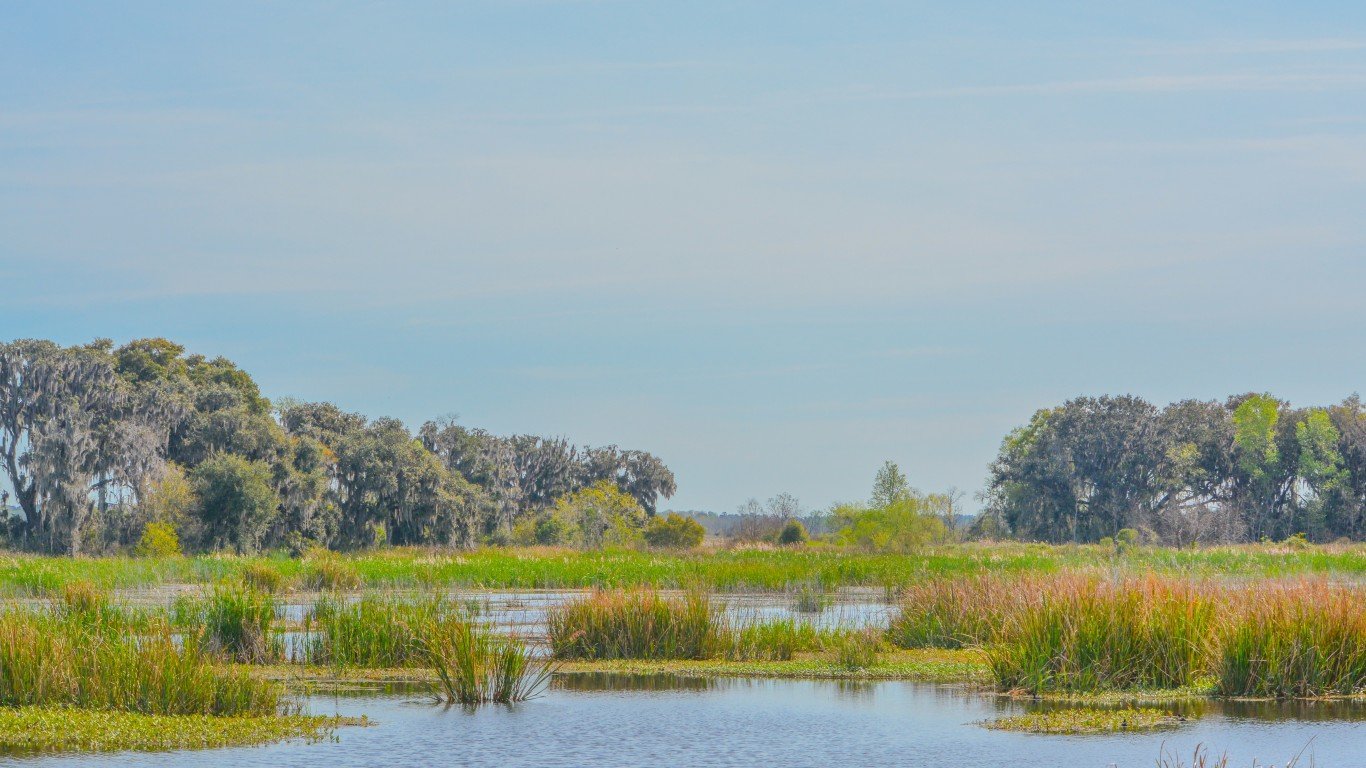
Florida: Glades County
> Americans under 65, no health insurance: 33.8% (Florida: 15.7%)
> Americans under 65, Medicare coverage (or multiple types): 5.1% (Florida: 3.1%)
> Americans under 65, Medicaid coverage (or multiple types): 27.5% (Florida: 19.2%)
> Americans under 65, VA coverage (or multiple types): 2.6% (Florida: 1.6%)
> Americans under 65, employer-based insurance (or multiple types): 29.0% (Florida: 50.6%)
> Americans under 65, direct-purchase insurance (or multiple types): 8.1% (Florida: 14.5%)
> Americans under 65, Tricare/military insurance (or many types): 0.3% (Florida: 2.7%)
[in-text-ad-2]
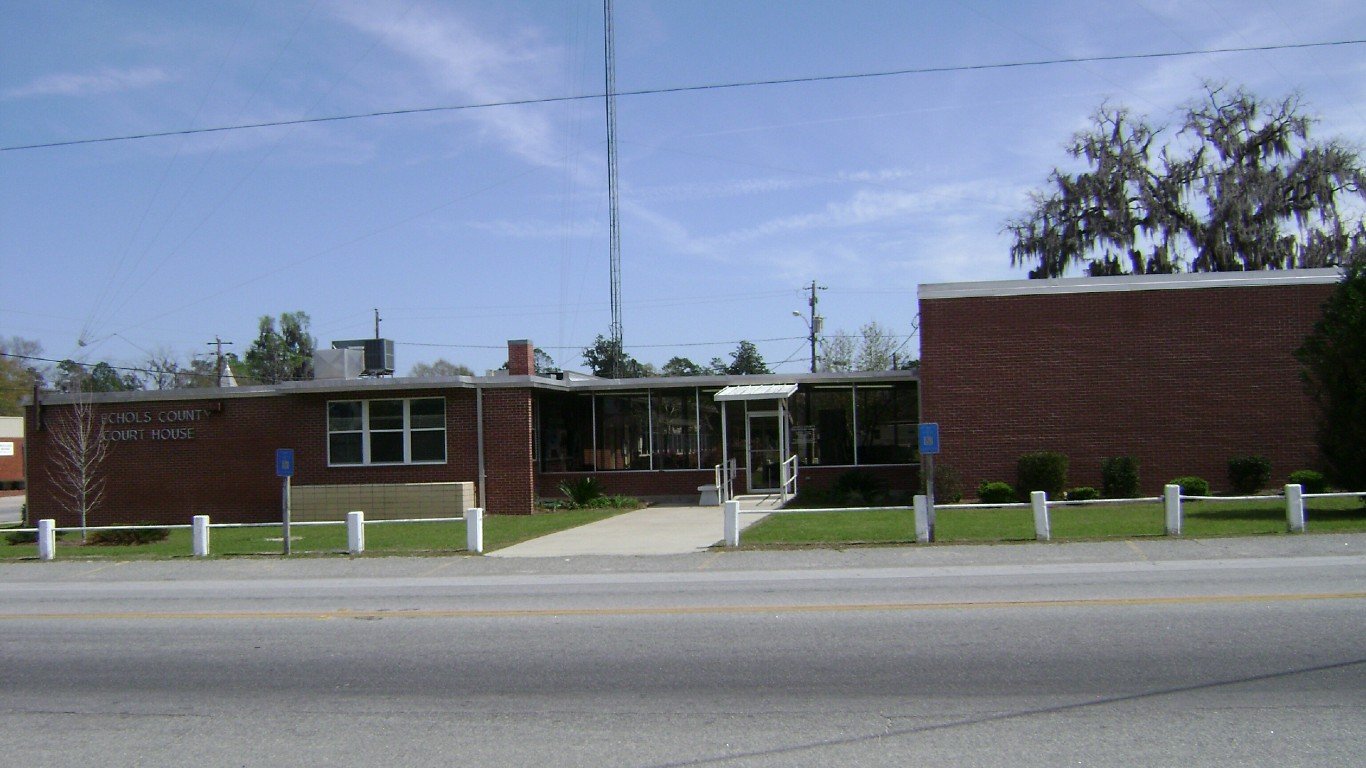
Georgia: Echols County
> Americans under 65, no health insurance: 27.5% (Georgia: 15.2%)
> Americans under 65, Medicare coverage (or multiple types): 4.6% (Georgia: 3.0%)
> Americans under 65, Medicaid coverage (or multiple types): 16.2% (Georgia: 17.9%)
> Americans under 65, VA coverage (or multiple types): 0.7% (Georgia: 1.5%)
> Americans under 65, employer-based insurance (or multiple types): 56.0% (Georgia: 56.9%)
> Americans under 65, direct-purchase insurance (or multiple types): 5.3% (Georgia: 10.2%)
> Americans under 65, Tricare/military insurance (or many types): 2.9% (Georgia: 3.4%)

Hawaii: Hawaii County
> Americans under 65, no health insurance: 6.1% (Hawaii: 4.6%)
> Americans under 65, Medicare coverage (or multiple types): 2.9% (Hawaii: 1.8%)
> Americans under 65, Medicaid coverage (or multiple types): 31.4% (Hawaii: 19.0%)
> Americans under 65, VA coverage (or multiple types): 1.6% (Hawaii: 1.5%)
> Americans under 65, employer-based insurance (or multiple types): 55.4% (Hawaii: 66.3%)
> Americans under 65, direct-purchase insurance (or multiple types): 9.1% (Hawaii: 9.5%)
> Americans under 65, Tricare/military insurance (or many types): 1.7% (Hawaii: 8.8%)
[in-text-ad]

Idaho: Owyhee County
> Americans under 65, no health insurance: 25.6% (Idaho: 12.4%)
> Americans under 65, Medicare coverage (or multiple types): 2.8% (Idaho: 2.8%)
> Americans under 65, Medicaid coverage (or multiple types): 22.7% (Idaho: 18.2%)
> Americans under 65, VA coverage (or multiple types): 1.6% (Idaho: 1.6%)
> Americans under 65, employer-based insurance (or multiple types): 39.1% (Idaho: 57.4%)
> Americans under 65, direct-purchase insurance (or multiple types): 13.0% (Idaho: 13.8%)
> Americans under 65, Tricare/military insurance (or many types): 2.1% (Idaho: 2.5%)
[recirclink id=924829]
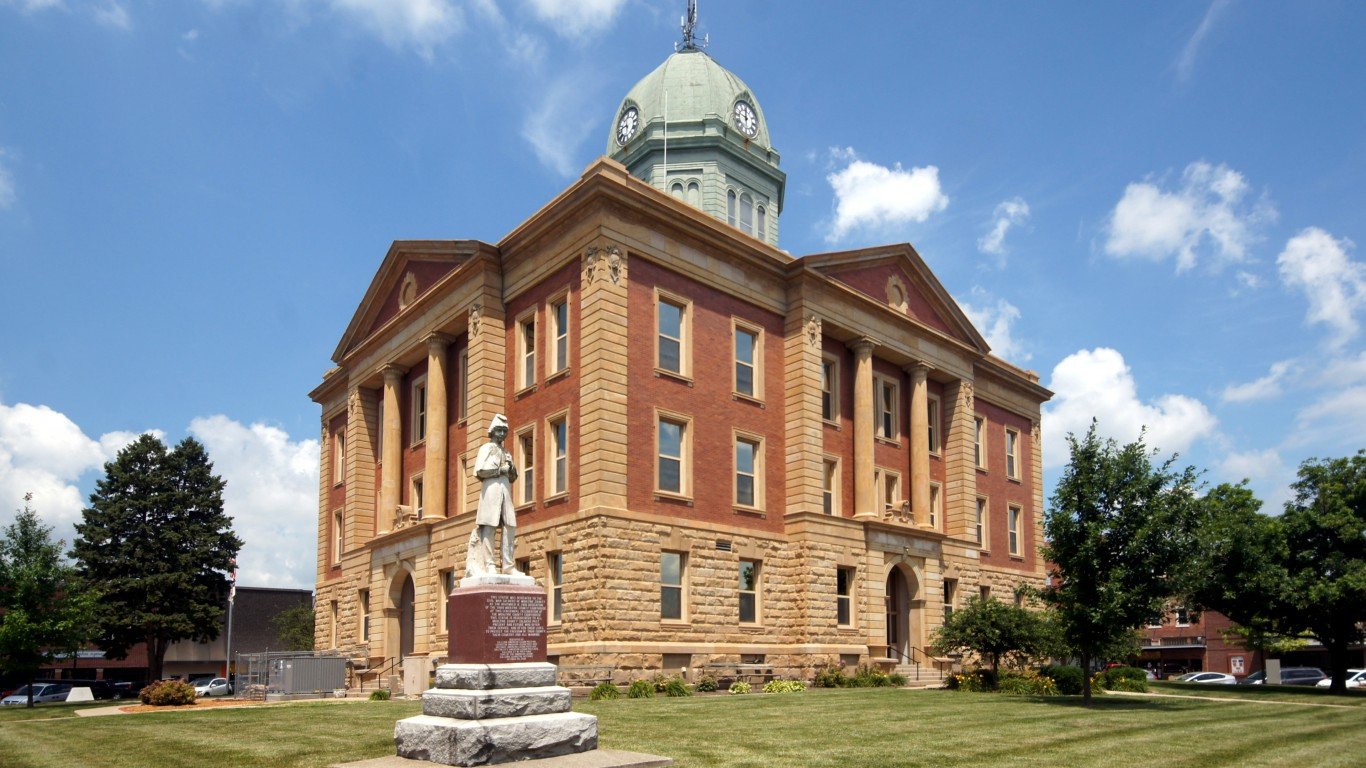
Illinois: Moultrie County
> Americans under 65, no health insurance: 18.1% (Illinois: 7.9%)
> Americans under 65, Medicare coverage (or multiple types): 1.9% (Illinois: 2.4%)
> Americans under 65, Medicaid coverage (or multiple types): 15.5% (Illinois: 21.0%)
> Americans under 65, VA coverage (or multiple types): 0.9% (Illinois: 0.8%)
> Americans under 65, employer-based insurance (or multiple types): 60.0% (Illinois: 63.6%)
> Americans under 65, direct-purchase insurance (or multiple types): 9.1% (Illinois: 9.5%)
> Americans under 65, Tricare/military insurance (or many types): 0.9% (Illinois: 0.9%)

Indiana: LaGrange County
> Americans under 65, no health insurance: 45.6% (Indiana: 9.8%)
> Americans under 65, Medicare coverage (or multiple types): 2.5% (Indiana: 3.2%)
> Americans under 65, Medicaid coverage (or multiple types): 10.5% (Indiana: 19.1%)
> Americans under 65, VA coverage (or multiple types): 0.9% (Indiana: 1.2%)
> Americans under 65, employer-based insurance (or multiple types): 38.7% (Indiana: 64.2%)
> Americans under 65, direct-purchase insurance (or multiple types): 6.2% (Indiana: 8.8%)
> Americans under 65, Tricare/military insurance (or many types): 0.3% (Indiana: 1.2%)
[in-text-ad-2]

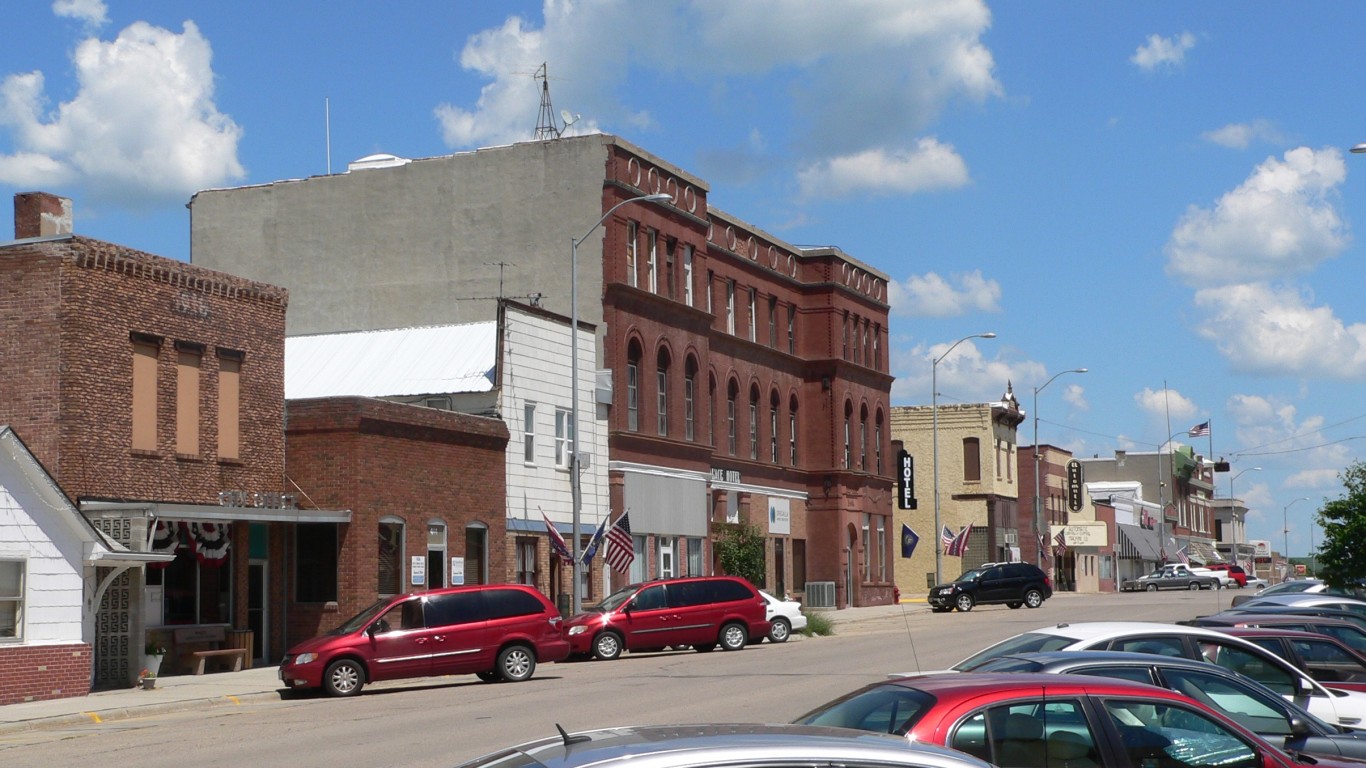
Iowa: Davis County
> Americans under 65, no health insurance: 31.1% (Iowa: 5.5%)
> Americans under 65, Medicare coverage (or multiple types): 2.0% (Iowa: 2.5%)
> Americans under 65, Medicaid coverage (or multiple types): 18.4% (Iowa: 20.4%)
> Americans under 65, VA coverage (or multiple types): 0.7% (Iowa: 1.1%)
> Americans under 65, employer-based insurance (or multiple types): 43.7% (Iowa: 67.4%)
> Americans under 65, direct-purchase insurance (or multiple types): 8.7% (Iowa: 10.6%)
> Americans under 65, Tricare/military insurance (or many types): 0.7% (Iowa: 1.3%)

Kansas: Hamilton County
> Americans under 65, no health insurance: 22.1% (Kansas: 10.3%)
> Americans under 65, Medicare coverage (or multiple types): 2.6% (Kansas: 2.7%)
> Americans under 65, Medicaid coverage (or multiple types): 16.5% (Kansas: 14.5%)
> Americans under 65, VA coverage (or multiple types): 0.0% reported (Kansas: 1.4%)
> Americans under 65, employer-based insurance (or multiple types): 50.8% (Kansas: 65.2%)
> Americans under 65, direct-purchase insurance (or multiple types): 18.8% (Kansas: 11.4%)
> Americans under 65, Tricare/military insurance (or many types): 0.4% (Kansas: 3.4%)
[in-text-ad]

Kentucky: Todd County
> Americans under 65, no health insurance: 17.7% (Kentucky: 6.7%)
> Americans under 65, Medicare coverage (or multiple types): 5.9% (Kentucky: 5.0%)
> Americans under 65, Medicaid coverage (or multiple types): 30.1% (Kentucky: 28.5%)
> Americans under 65, VA coverage (or multiple types): 1.5% (Kentucky: 1.5%)
> Americans under 65, employer-based insurance (or multiple types): 41.2% (Kentucky: 57.3%)
> Americans under 65, direct-purchase insurance (or multiple types): 9.8% (Kentucky: 8.2%)
> Americans under 65, Tricare/military insurance (or many types): 2.7% (Kentucky: 2.3%)
[recirclink id=927311]
Louisiana: Tensas Parish
> Americans under 65, no health insurance: 23.7% (Louisiana: 11.0%)
> Americans under 65, Medicare coverage (or multiple types): 4.4% (Louisiana: 4.0%)
> Americans under 65, Medicaid coverage (or multiple types): 43.2% (Louisiana: 28.4%)
> Americans under 65, VA coverage (or multiple types): 0.4% (Louisiana: 1.3%)
> Americans under 65, employer-based insurance (or multiple types): 27.4% (Louisiana: 52.3%)
> Americans under 65, direct-purchase insurance (or multiple types): 11.4% (Louisiana: 9.6%)
> Americans under 65, Tricare/military insurance (or many types): 0.6% (Louisiana: 2.2%)

Maine: Washington County
> Americans under 65, no health insurance: 15.7% (Maine: 9.8%)
> Americans under 65, Medicare coverage (or multiple types): 5.9% (Maine: 4.5%)
> Americans under 65, Medicaid coverage (or multiple types): 34.1% (Maine: 19.3%)
> Americans under 65, VA coverage (or multiple types): 2.8% (Maine: 1.8%)
> Americans under 65, employer-based insurance (or multiple types): 40.0% (Maine: 61.5%)
> Americans under 65, direct-purchase insurance (or multiple types): 10.9% (Maine: 11.0%)
> Americans under 65, Tricare/military insurance (or many types): 3.1% (Maine: 2.3%)
[in-text-ad-2]

Maryland: Prince George’s County
> Americans under 65, no health insurance: 11.2% (Maryland: 6.9%)
> Americans under 65, Medicare coverage (or multiple types): 1.9% (Maryland: 2.6%)
> Americans under 65, Medicaid coverage (or multiple types): 20.9% (Maryland: 19.1%)
> Americans under 65, VA coverage (or multiple types): 1.5% (Maryland: 1.2%)
> Americans under 65, employer-based insurance (or multiple types): 61.1% (Maryland: 65.7%)
> Americans under 65, direct-purchase insurance (or multiple types): 8.5% (Maryland: 9.6%)
> Americans under 65, Tricare/military insurance (or many types): 2.9% (Maryland: 3.1%)

Massachusetts: Nantucket County
> Americans under 65, no health insurance: 5.2% (Massachusetts: 3.2%)
> Americans under 65, Medicare coverage (or multiple types): 3.3% (Massachusetts: 2.5%)
> Americans under 65, Medicaid coverage (or multiple types): 16.2% (Massachusetts: 24.0%)
> Americans under 65, VA coverage (or multiple types): 0.3% (Massachusetts: 0.6%)
> Americans under 65, employer-based insurance (or multiple types): 51.9% (Massachusetts: 67.5%)
> Americans under 65, direct-purchase insurance (or multiple types): 29.0% (Massachusetts: 9.9%)
> Americans under 65, Tricare/military insurance (or many types): 0.7% (Massachusetts: 0.8%)
[in-text-ad]
Michigan: Oscoda County
> Americans under 65, no health insurance: 18.0% (Michigan: 6.5%)
> Americans under 65, Medicare coverage (or multiple types): 8.2% (Michigan: 3.7%)
> Americans under 65, Medicaid coverage (or multiple types): 30.6% (Michigan: 24.2%)
> Americans under 65, VA coverage (or multiple types): 2.1% (Michigan: 1.0%)
> Americans under 65, employer-based insurance (or multiple types): 39.9% (Michigan: 63.3%)
> Americans under 65, direct-purchase insurance (or multiple types): 10.5% (Michigan: 9.1%)
> Americans under 65, Tricare/military insurance (or many types): 2.1% (Michigan: 0.9%)
[recirclink id=923401]
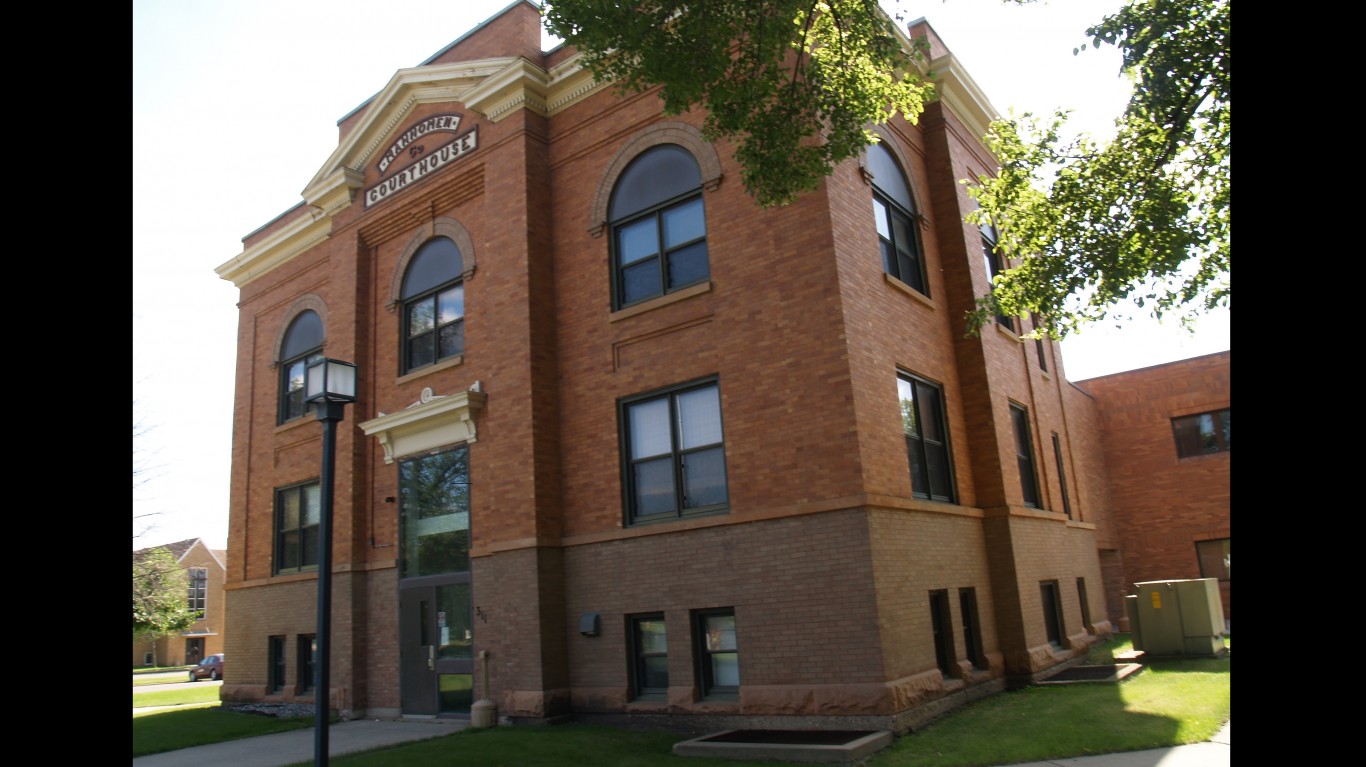
Minnesota: Mahnomen County
> Americans under 65, no health insurance: 16.6% (Minnesota: 5.2%)
> Americans under 65, Medicare coverage (or multiple types): 2.3% (Minnesota: 2.1%)
> Americans under 65, Medicaid coverage (or multiple types): 46.5% (Minnesota: 19.4%)
> Americans under 65, VA coverage (or multiple types): 1.8% (Minnesota: 1.0%)
> Americans under 65, employer-based insurance (or multiple types): 32.3% (Minnesota: 68.6%)
> Americans under 65, direct-purchase insurance (or multiple types): 6.7% (Minnesota: 9.9%)
> Americans under 65, Tricare/military insurance (or many types): 0.5% (Minnesota: 1.0%)

Mississippi: Sharkey County
> Americans under 65, no health insurance: 21.0% (Mississippi: 14.5%)
> Americans under 65, Medicare coverage (or multiple types): 8.7% (Mississippi: 4.7%)
> Americans under 65, Medicaid coverage (or multiple types): 35.7% (Mississippi: 25.1%)
> Americans under 65, VA coverage (or multiple types): 1.4% (Mississippi: 1.4%)
> Americans under 65, employer-based insurance (or multiple types): 33.6% (Mississippi: 51.2%)
> Americans under 65, direct-purchase insurance (or multiple types): 8.1% (Mississippi: 9.5%)
> Americans under 65, Tricare/military insurance (or many types): 1.0% (Mississippi: 3.0%)
[in-text-ad-2]
Missouri: Scotland County
> Americans under 65, no health insurance: 39.6% (Missouri: 11.1%)
> Americans under 65, Medicare coverage (or multiple types): 1.6% (Missouri: 3.8%)
> Americans under 65, Medicaid coverage (or multiple types): 14.7% (Missouri: 15.8%)
> Americans under 65, VA coverage (or multiple types): 0.3% (Missouri: 1.4%)
> Americans under 65, employer-based insurance (or multiple types): 42.8% (Missouri: 62.9%)
> Americans under 65, direct-purchase insurance (or multiple types): 7.6% (Missouri: 10.5%)
> Americans under 65, Tricare/military insurance (or many types): 0.5% (Missouri: 2.0%)

Montana: Glacier County
> Americans under 65, no health insurance: 42.3% (Montana: 10.9%)
> Americans under 65, Medicare coverage (or multiple types): 2.0% (Montana: 3.0%)
> Americans under 65, Medicaid coverage (or multiple types): 31.1% (Montana: 21.4%)
> Americans under 65, VA coverage (or multiple types): 1.1% (Montana: 2.1%)
> Americans under 65, employer-based insurance (or multiple types): 23.0% (Montana: 54.9%)
> Americans under 65, direct-purchase insurance (or multiple types): 3.9% (Montana: 13.9%)
> Americans under 65, Tricare/military insurance (or many types): 0.4% (Montana: 3.0%)
[in-text-ad]
Nebraska: Thurston County
> Americans under 65, no health insurance: 28.5% (Nebraska: 9.5%)
> Americans under 65, Medicare coverage (or multiple types): 1.9% (Nebraska: 2.2%)
> Americans under 65, Medicaid coverage (or multiple types): 26.9% (Nebraska: 13.4%)
> Americans under 65, VA coverage (or multiple types): 0.6% (Nebraska: 1.4%)
> Americans under 65, employer-based insurance (or multiple types): 40.3% (Nebraska: 66.1%)
> Americans under 65, direct-purchase insurance (or multiple types): 5.5% (Nebraska: 12.9%)
> Americans under 65, Tricare/military insurance (or many types): 0.0% reported (Nebraska: 2.7%)
[recirclink id=887931]
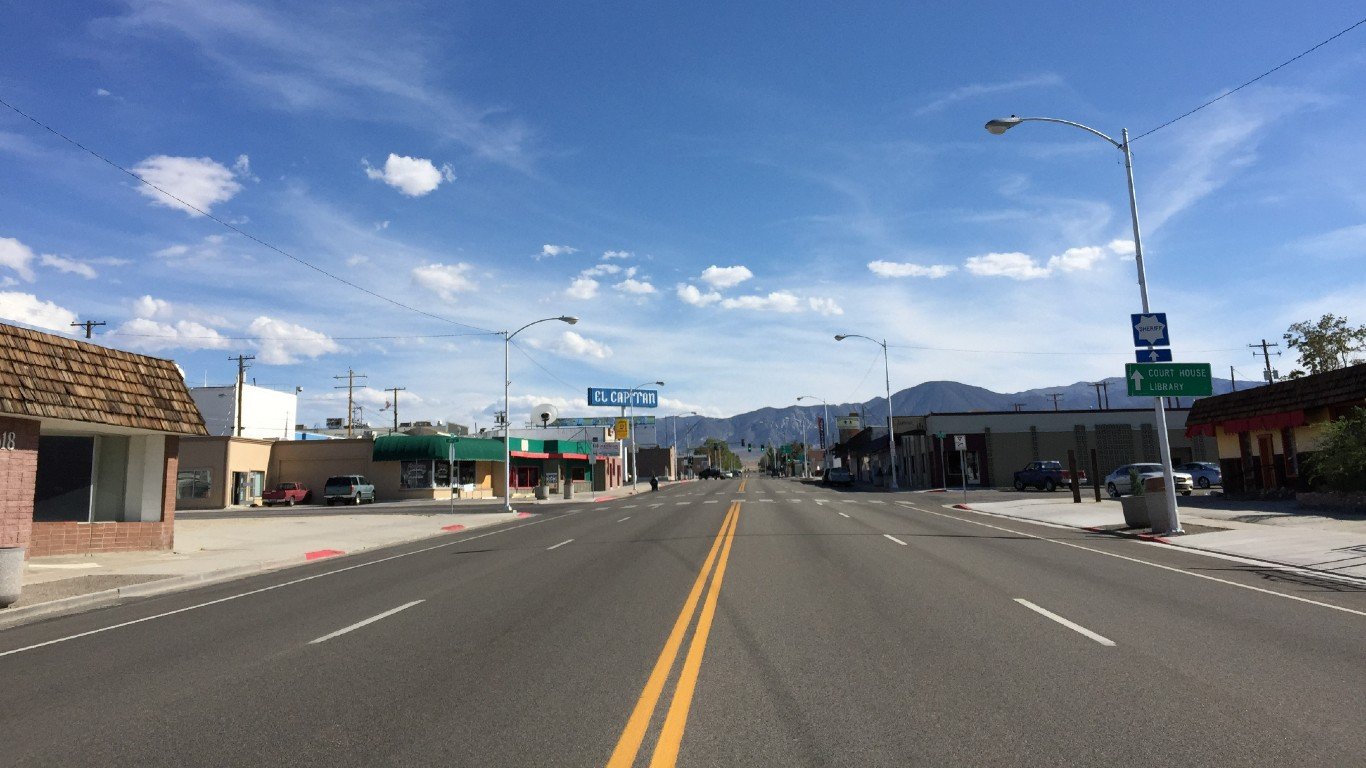
Nevada: Mineral County
> Americans under 65, no health insurance: 14.1% (Nevada: 12.9%)
> Americans under 65, Medicare coverage (or multiple types): 3.6% (Nevada: 2.5%)
> Americans under 65, Medicaid coverage (or multiple types): 34.9% (Nevada: 20.0%)
> Americans under 65, VA coverage (or multiple types): 3.7% (Nevada: 1.7%)
> Americans under 65, employer-based insurance (or multiple types): 47.2% (Nevada: 58.7%)
> Americans under 65, direct-purchase insurance (or multiple types): 3.4% (Nevada: 9.1%)
> Americans under 65, Tricare/military insurance (or many types): 0.7% (Nevada: 2.7%)

New Hampshire: Carroll County
> Americans under 65, no health insurance: 12.2% (New Hampshire: 7.1%)
> Americans under 65, Medicare coverage (or multiple types): 4.6% (New Hampshire: 3.2%)
> Americans under 65, Medicaid coverage (or multiple types): 22.4% (New Hampshire: 14.6%)
> Americans under 65, VA coverage (or multiple types): 0.9% (New Hampshire: 1.3%)
> Americans under 65, employer-based insurance (or multiple types): 55.0% (New Hampshire: 69.8%)
> Americans under 65, direct-purchase insurance (or multiple types): 11.1% (New Hampshire: 9.3%)
> Americans under 65, Tricare/military insurance (or many types): 0.9% (New Hampshire: 1.5%)
[in-text-ad-2]

New Jersey: Passaic County
> Americans under 65, no health insurance: 14.2% (New Jersey: 9.0%)
> Americans under 65, Medicare coverage (or multiple types): 2.6% (New Jersey: 2.4%)
> Americans under 65, Medicaid coverage (or multiple types): 27.4% (New Jersey: 17.7%)
> Americans under 65, VA coverage (or multiple types): 0.2% (New Jersey: 0.4%)
> Americans under 65, employer-based insurance (or multiple types): 52.8% (New Jersey: 66.5%)
> Americans under 65, direct-purchase insurance (or multiple types): 6.6% (New Jersey: 8.9%)
> Americans under 65, Tricare/military insurance (or many types): 0.3% (New Jersey: 0.7%)
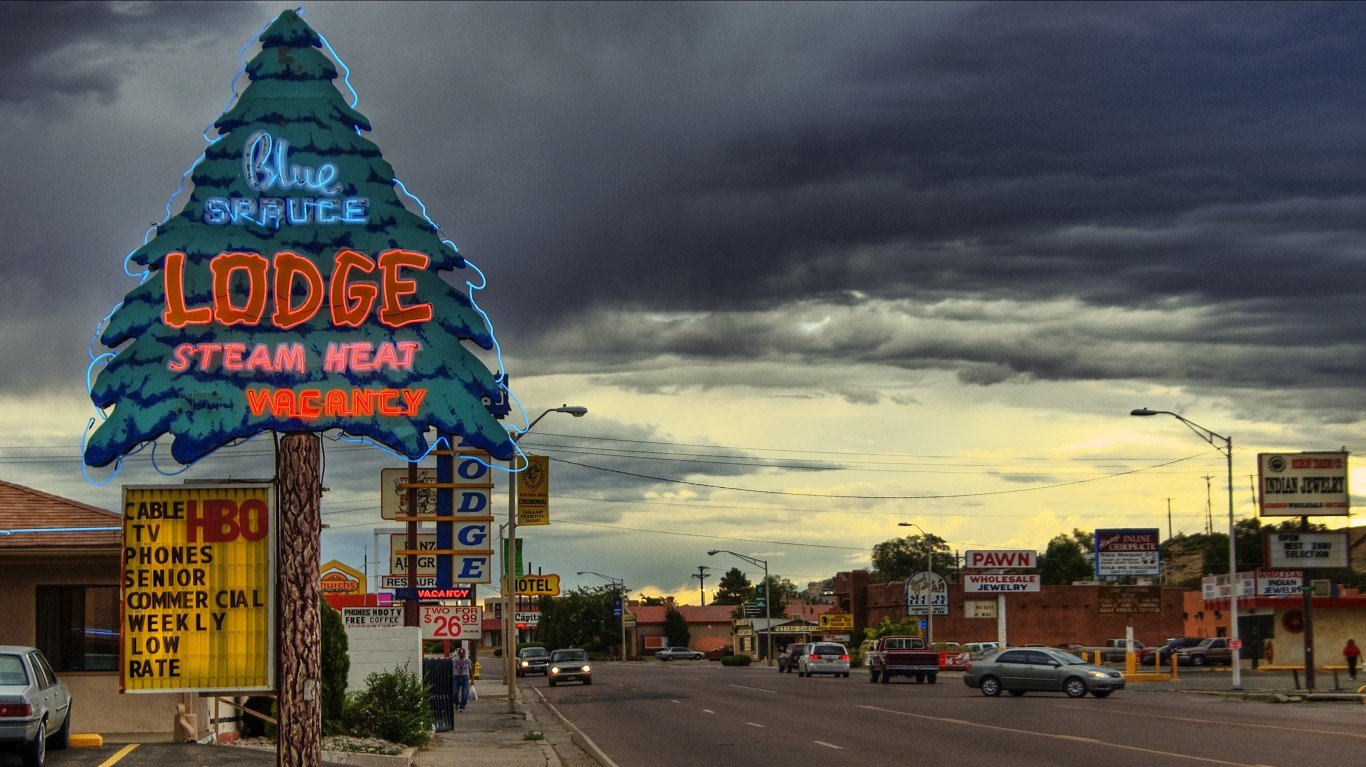
New Mexico: McKinley County
> Americans under 65, no health insurance: 22.2% (New Mexico: 11.4%)
> Americans under 65, Medicare coverage (or multiple types): 3.0% (New Mexico: 3.6%)
> Americans under 65, Medicaid coverage (or multiple types): 54.2% (New Mexico: 35.6%)
> Americans under 65, VA coverage (or multiple types): 0.9% (New Mexico: 1.7%)
> Americans under 65, employer-based insurance (or multiple types): 22.3% (New Mexico: 46.4%)
> Americans under 65, direct-purchase insurance (or multiple types): 3.3% (New Mexico: 8.0%)
> Americans under 65, Tricare/military insurance (or many types): 1.0% (New Mexico: 3.3%)
[in-text-ad]
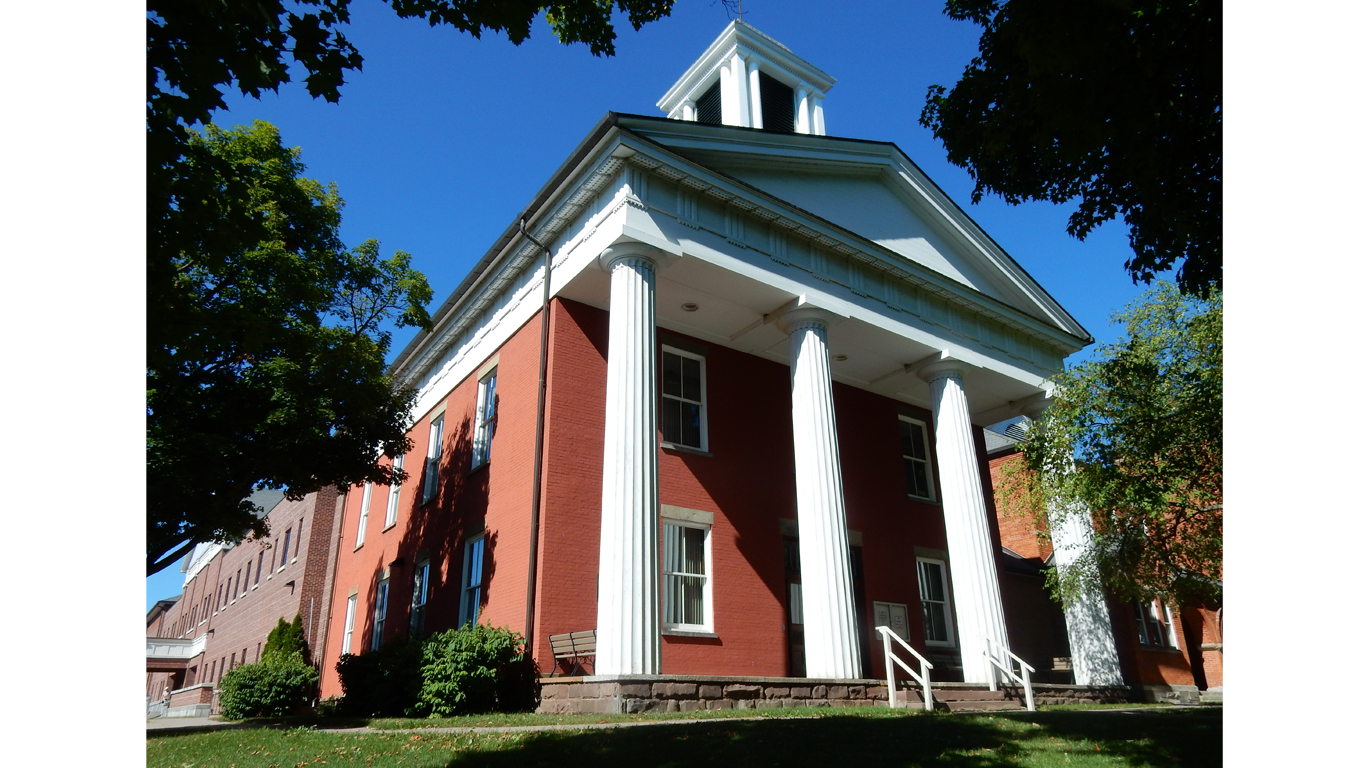
New York: Yates County
> Americans under 65, no health insurance: 21.7% (New York: 6.7%)
> Americans under 65, Medicare coverage (or multiple types): 5.1% (New York: 2.8%)
> Americans under 65, Medicaid coverage (or multiple types): 19.7% (New York: 26.9%)
> Americans under 65, VA coverage (or multiple types): 1.0% (New York: 0.6%)
> Americans under 65, employer-based insurance (or multiple types): 48.3% (New York: 59.7%)
> Americans under 65, direct-purchase insurance (or multiple types): 10.3% (New York: 10.8%)
> Americans under 65, Tricare/military insurance (or many types): 0.7% (New York: 0.7%)
[recirclink id=931632]

North Carolina: Swain County
> Americans under 65, no health insurance: 26.1% (North Carolina: 12.6%)
> Americans under 65, Medicare coverage (or multiple types): 4.4% (North Carolina: 3.5%)
> Americans under 65, Medicaid coverage (or multiple types): 25.3% (North Carolina: 19.4%)
> Americans under 65, VA coverage (or multiple types): 1.7% (North Carolina: 1.7%)
> Americans under 65, employer-based insurance (or multiple types): 37.1% (North Carolina: 55.9%)
> Americans under 65, direct-purchase insurance (or multiple types): 10.1% (North Carolina: 11.7%)
> Americans under 65, Tricare/military insurance (or many types): 3.1% (North Carolina: 3.8%)
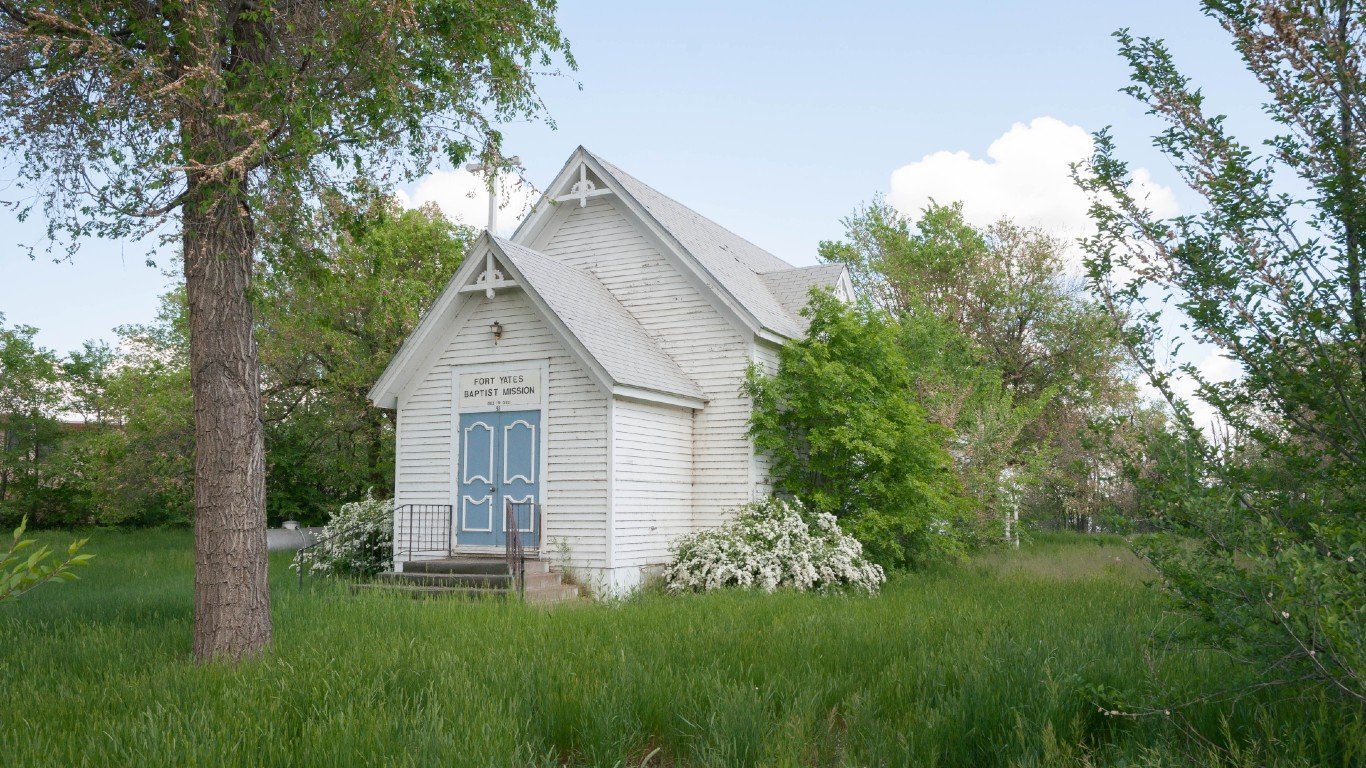
North Dakota: Sioux County
> Americans under 65, no health insurance: 34.0% (North Dakota: 8.5%)
> Americans under 65, Medicare coverage (or multiple types): 2.2% (North Dakota: 2.1%)
> Americans under 65, Medicaid coverage (or multiple types): 32.2% (North Dakota: 11.4%)
> Americans under 65, VA coverage (or multiple types): 1.2% (North Dakota: 1.4%)
> Americans under 65, employer-based insurance (or multiple types): 27.1% (North Dakota: 67.6%)
> Americans under 65, direct-purchase insurance (or multiple types): 7.2% (North Dakota: 14.3%)
> Americans under 65, Tricare/military insurance (or many types): 1.1% (North Dakota: 3.4%)
[in-text-ad-2]
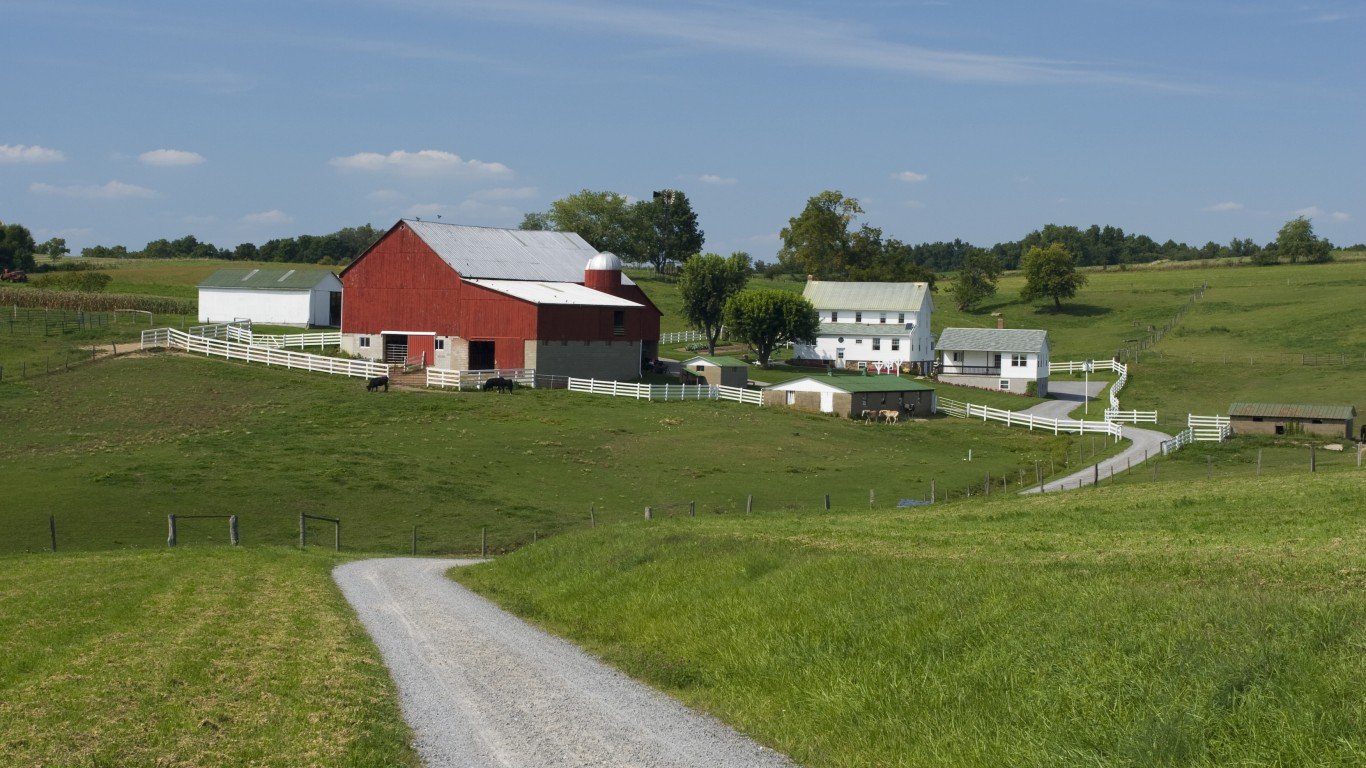
Ohio: Holmes County
> Americans under 65, no health insurance: 44.6% (Ohio: 7.2%)
> Americans under 65, Medicare coverage (or multiple types): 1.7% (Ohio: 3.3%)
> Americans under 65, Medicaid coverage (or multiple types): 8.8% (Ohio: 22.8%)
> Americans under 65, VA coverage (or multiple types): 0.6% (Ohio: 1.2%)
> Americans under 65, employer-based insurance (or multiple types): 36.8% (Ohio: 64.0%)
> Americans under 65, direct-purchase insurance (or multiple types): 10.7% (Ohio: 7.8%)
> Americans under 65, Tricare/military insurance (or many types): 0.3% (Ohio: 1.2%)
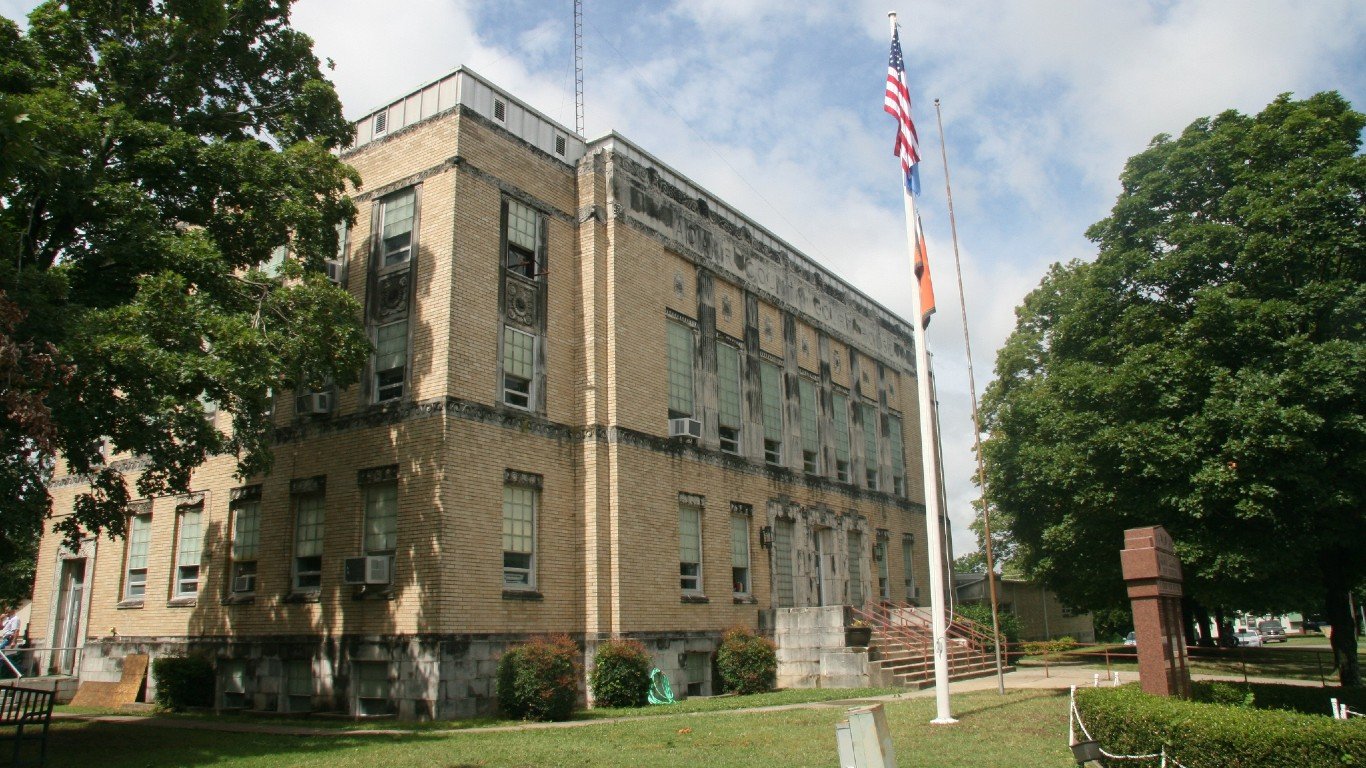
Oklahoma: Adair County
> Americans under 65, no health insurance: 31.7% (Oklahoma: 16.5%)
> Americans under 65, Medicare coverage (or multiple types): 5.1% (Oklahoma: 3.9%)
> Americans under 65, Medicaid coverage (or multiple types): 31.7% (Oklahoma: 18.8%)
> Americans under 65, VA coverage (or multiple types): 1.6% (Oklahoma: 1.8%)
> Americans under 65, employer-based insurance (or multiple types): 29.1% (Oklahoma: 54.4%)
> Americans under 65, direct-purchase insurance (or multiple types): 7.6% (Oklahoma: 9.9%)
> Americans under 65, Tricare/military insurance (or many types): 0.8% (Oklahoma: 3.1%)
[in-text-ad]

Oregon: Lincoln County
> Americans under 65, no health insurance: 12.9% (Oregon: 8.0%)
> Americans under 65, Medicare coverage (or multiple types): 4.9% (Oregon: 2.8%)
> Americans under 65, Medicaid coverage (or multiple types): 34.5% (Oregon: 24.7%)
> Americans under 65, VA coverage (or multiple types): 2.7% (Oregon: 1.6%)
> Americans under 65, employer-based insurance (or multiple types): 41.3% (Oregon: 59.2%)
> Americans under 65, direct-purchase insurance (or multiple types): 12.1% (Oregon: 11.0%)
> Americans under 65, Tricare/military insurance (or many types): 1.8% (Oregon: 1.4%)
[recirclink id=924829]
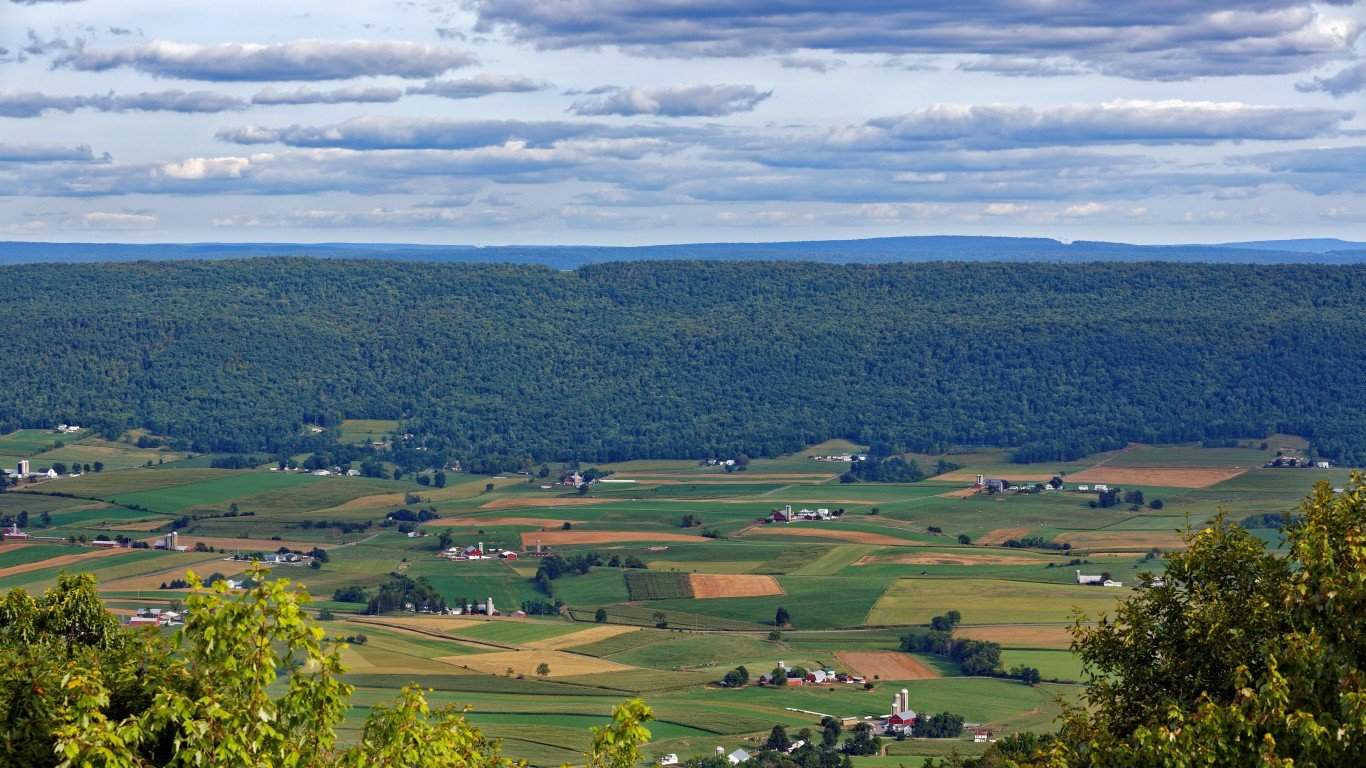
Pennsylvania: Mifflin County
> Americans under 65, no health insurance: 14.9% (Pennsylvania: 6.8%)
> Americans under 65, Medicare coverage (or multiple types): 4.0% (Pennsylvania: 3.2%)
> Americans under 65, Medicaid coverage (or multiple types): 25.5% (Pennsylvania: 21.1%)
> Americans under 65, VA coverage (or multiple types): 1.3% (Pennsylvania: 1.0%)
> Americans under 65, employer-based insurance (or multiple types): 54.5% (Pennsylvania: 65.2%)
> Americans under 65, direct-purchase insurance (or multiple types): 7.7% (Pennsylvania: 10.2%)
> Americans under 65, Tricare/military insurance (or many types): 0.9% (Pennsylvania: 1.0%)

Rhode Island: Providence County
> Americans under 65, no health insurance: 6.2% (Rhode Island: 5.3%)
> Americans under 65, Medicare coverage (or multiple types): 3.7% (Rhode Island: 3.4%)
> Americans under 65, Medicaid coverage (or multiple types): 28.1% (Rhode Island: 23.2%)
> Americans under 65, VA coverage (or multiple types): 0.8% (Rhode Island: 1.0%)
> Americans under 65, employer-based insurance (or multiple types): 59.3% (Rhode Island: 64.1%)
> Americans under 65, direct-purchase insurance (or multiple types): 10.2% (Rhode Island: 10.8%)
> Americans under 65, Tricare/military insurance (or many types): 0.7% (Rhode Island: 1.4%)
[in-text-ad-2]
South Carolina: Jasper County
> Americans under 65, no health insurance: 18.9% (South Carolina: 12.6%)
> Americans under 65, Medicare coverage (or multiple types): 4.7% (South Carolina: 3.8%)
> Americans under 65, Medicaid coverage (or multiple types): 28.1% (South Carolina: 20.7%)
> Americans under 65, VA coverage (or multiple types): 1.8% (South Carolina: 1.8%)
> Americans under 65, employer-based insurance (or multiple types): 41.6% (South Carolina: 56.5%)
> Americans under 65, direct-purchase insurance (or multiple types): 10.8% (South Carolina: 10.4%)
> Americans under 65, Tricare/military insurance (or many types): 2.9% (South Carolina: 3.7%)

South Dakota: Buffalo County
> Americans under 65, no health insurance: 41.7% (South Dakota: 11.2%)
> Americans under 65, Medicare coverage (or multiple types): 5.1% (South Dakota: 2.7%)
> Americans under 65, Medicaid coverage (or multiple types): 35.6% (South Dakota: 15.3%)
> Americans under 65, VA coverage (or multiple types): 1.1% (South Dakota: 1.9%)
> Americans under 65, employer-based insurance (or multiple types): 13.1% (South Dakota: 61.1%)
> Americans under 65, direct-purchase insurance (or multiple types): 6.8% (South Dakota: 13.7%)
> Americans under 65, Tricare/military insurance (or many types): 0.5% (South Dakota: 3.4%)
[in-text-ad]
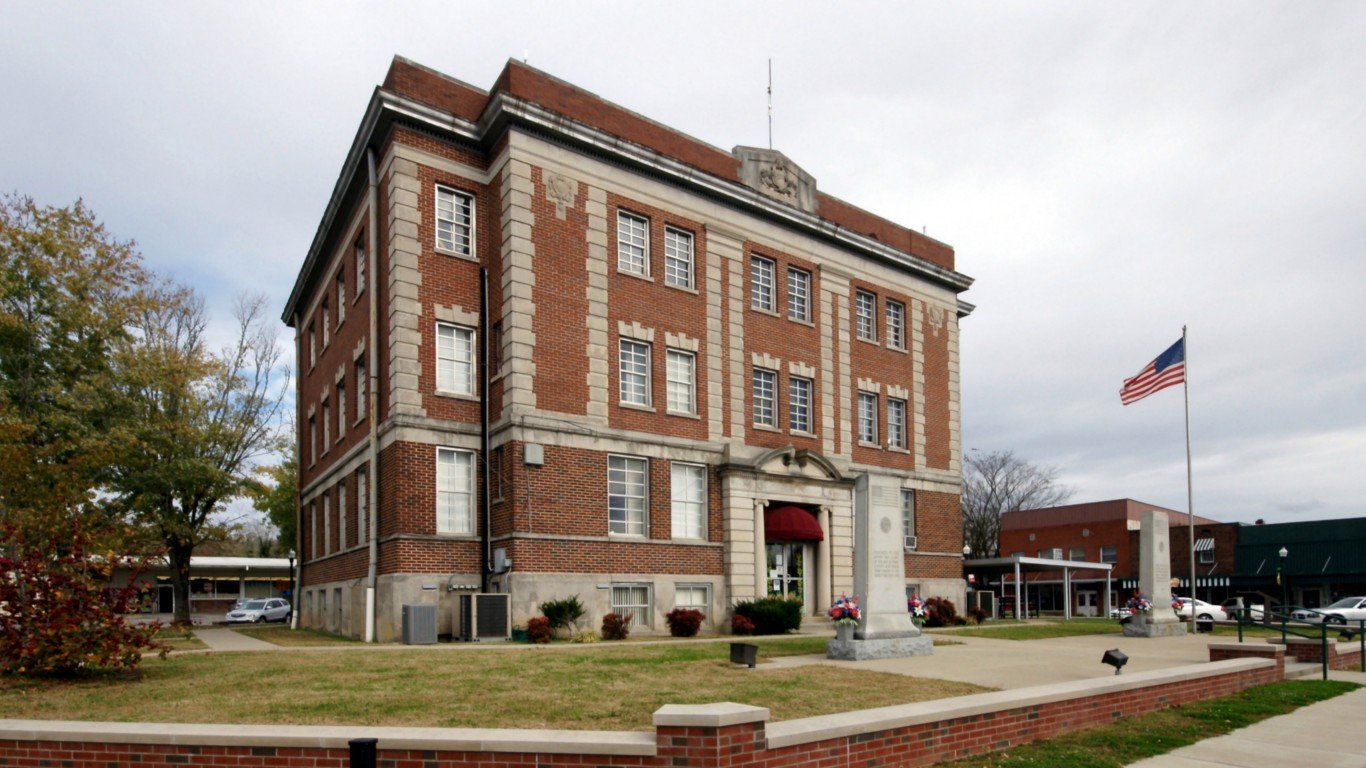
Tennessee: Perry County
> Americans under 65, no health insurance: 20.0% (Tennessee: 11.4%)
> Americans under 65, Medicare coverage (or multiple types): 5.2% (Tennessee: 3.8%)
> Americans under 65, Medicaid coverage (or multiple types): 34.0% (Tennessee: 21.6%)
> Americans under 65, VA coverage (or multiple types): 1.4% (Tennessee: 1.6%)
> Americans under 65, employer-based insurance (or multiple types): 42.1% (Tennessee: 57.8%)
> Americans under 65, direct-purchase insurance (or multiple types): 6.6% (Tennessee: 10.1%)
> Americans under 65, Tricare/military insurance (or many types): 1.2% (Tennessee: 2.7%)
[recirclink id=927311]
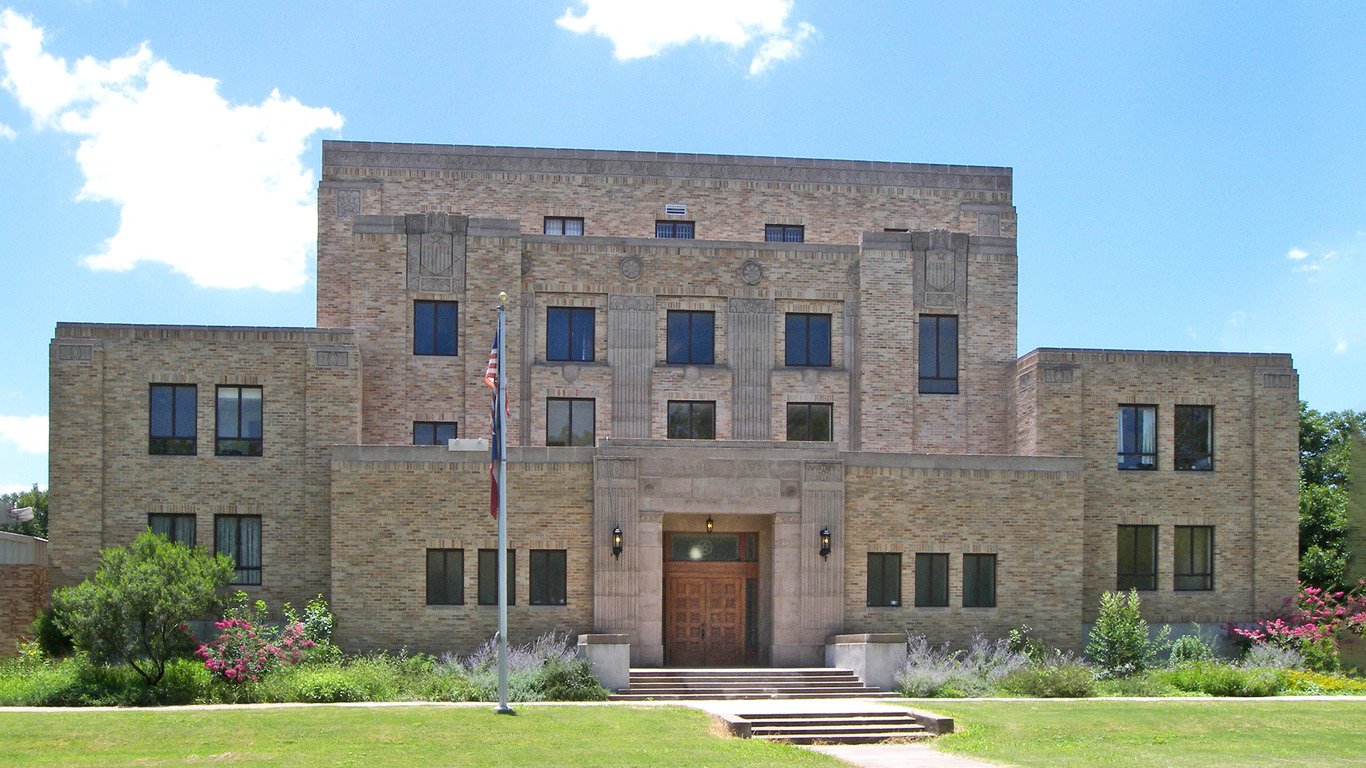
Texas: Menard County
> Americans under 65, no health insurance: 44.7% (Texas: 19.4%)
> Americans under 65, Medicare coverage (or multiple types): 5.3% (Texas: 2.2%)
> Americans under 65, Medicaid coverage (or multiple types): 14.3% (Texas: 17.2%)
> Americans under 65, VA coverage (or multiple types): 1.7% (Texas: 1.3%)
> Americans under 65, employer-based insurance (or multiple types): 31.7% (Texas: 54.5%)
> Americans under 65, direct-purchase insurance (or multiple types): 12.9% (Texas: 9.4%)
> Americans under 65, Tricare/military insurance (or many types): 1.7% (Texas: 2.3%)
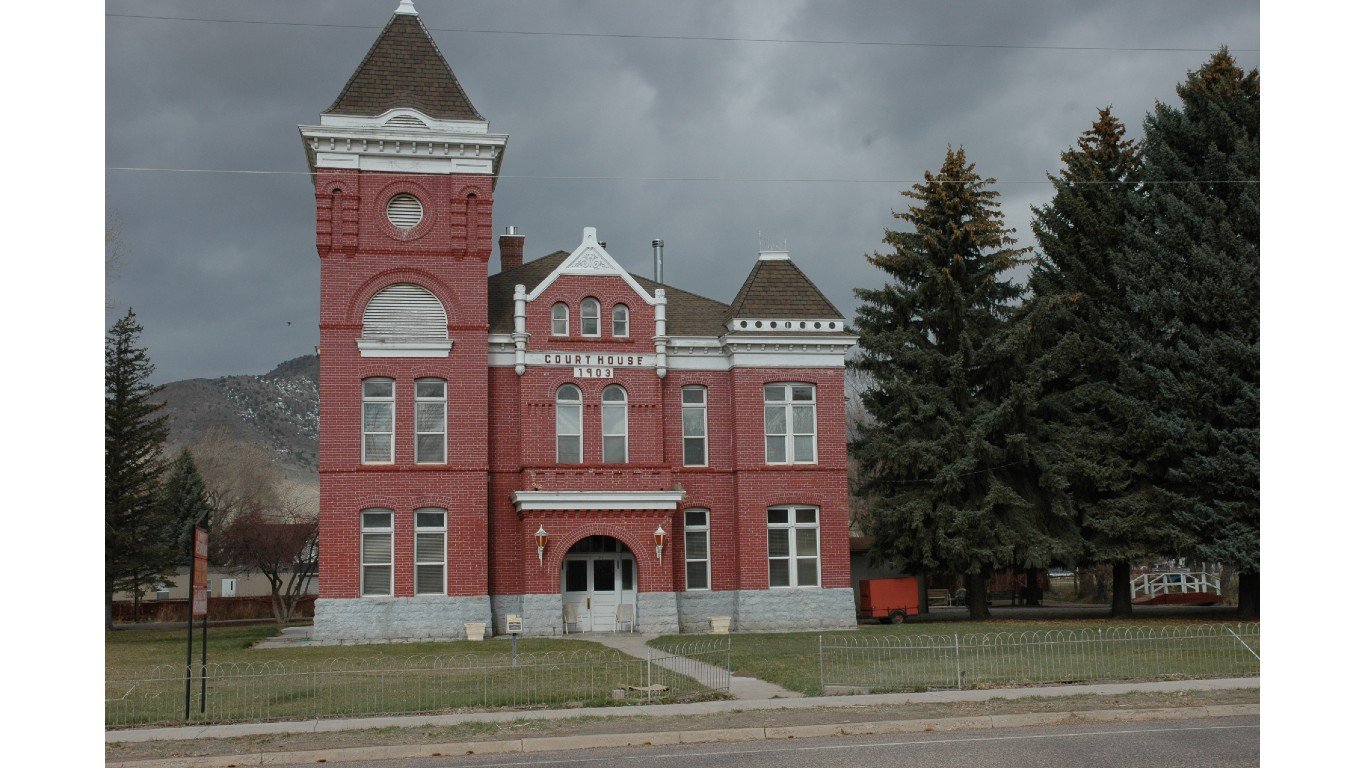
Utah: Piute County
> Americans under 65, no health insurance: 25.9% (Utah: 10.4%)
> Americans under 65, Medicare coverage (or multiple types): 5.8% (Utah: 1.5%)
> Americans under 65, Medicaid coverage (or multiple types): 19.4% (Utah: 10.7%)
> Americans under 65, VA coverage (or multiple types): 0.0% reported (Utah: 0.8%)
> Americans under 65, employer-based insurance (or multiple types): 41.3% (Utah: 68.4%)
> Americans under 65, direct-purchase insurance (or multiple types): 14.0% (Utah: 12.5%)
> Americans under 65, Tricare/military insurance (or many types): 1.0% (Utah: 1.8%)
[in-text-ad-2]

Vermont: Windham County
> Americans under 65, no health insurance: 6.6% (Vermont: 4.8%)
> Americans under 65, Medicare coverage (or multiple types): 4.7% (Vermont: 3.8%)
> Americans under 65, Medicaid coverage (or multiple types): 34.7% (Vermont: 27.1%)
> Americans under 65, VA coverage (or multiple types): 1.0% (Vermont: 1.2%)
> Americans under 65, employer-based insurance (or multiple types): 49.0% (Vermont: 60.5%)
> Americans under 65, direct-purchase insurance (or multiple types): 11.8% (Vermont: 10.1%)
> Americans under 65, Tricare/military insurance (or many types): 1.0% (Vermont: 1.6%)

Virginia: Accomack County
> Americans under 65, no health insurance: 21.3% (Virginia: 10.0%)
> Americans under 65, Medicare coverage (or multiple types): 2.9% (Virginia: 2.7%)
> Americans under 65, Medicaid coverage (or multiple types): 21.1% (Virginia: 12.6%)
> Americans under 65, VA coverage (or multiple types): 1.3% (Virginia: 2.1%)
> Americans under 65, employer-based insurance (or multiple types): 48.3% (Virginia: 63.9%)
> Americans under 65, direct-purchase insurance (or multiple types): 8.2% (Virginia: 11.0%)
> Americans under 65, Tricare/military insurance (or many types): 3.7% (Virginia: 7.1%)
[in-text-ad]

Washington: Adams County
> Americans under 65, no health insurance: 18.0% (Washington: 7.3%)
> Americans under 65, Medicare coverage (or multiple types): 2.4% (Washington: 2.5%)
> Americans under 65, Medicaid coverage (or multiple types): 40.2% (Washington: 22.0%)
> Americans under 65, VA coverage (or multiple types): 1.1% (Washington: 1.6%)
> Americans under 65, employer-based insurance (or multiple types): 36.0% (Washington: 62.3%)
> Americans under 65, direct-purchase insurance (or multiple types): 7.9% (Washington: 9.7%)
> Americans under 65, Tricare/military insurance (or many types): 0.4% (Washington: 3.6%)
[recirclink id=923401]
West Virginia: Monroe County
> Americans under 65, no health insurance: 12.0% (West Virginia: 7.4%)
> Americans under 65, Medicare coverage (or multiple types): 7.2% (West Virginia: 5.4%)
> Americans under 65, Medicaid coverage (or multiple types): 36.1% (West Virginia: 30.3%)
> Americans under 65, VA coverage (or multiple types): 1.6% (West Virginia: 1.8%)
> Americans under 65, employer-based insurance (or multiple types): 46.7% (West Virginia: 57.1%)
> Americans under 65, direct-purchase insurance (or multiple types): 6.9% (West Virginia: 6.4%)
> Americans under 65, Tricare/military insurance (or many types): 0.5% (West Virginia: 1.6%)

Wisconsin: Menominee County
> Americans under 65, no health insurance: 28.4% (Wisconsin: 6.4%)
> Americans under 65, Medicare coverage (or multiple types): 3.4% (Wisconsin: 2.7%)
> Americans under 65, Medicaid coverage (or multiple types): 34.8% (Wisconsin: 18.0%)
> Americans under 65, VA coverage (or multiple types): 1.1% (Wisconsin: 1.1%)
> Americans under 65, employer-based insurance (or multiple types): 33.1% (Wisconsin: 69.1%)
> Americans under 65, direct-purchase insurance (or multiple types): 5.2% (Wisconsin: 9.4%)
> Americans under 65, Tricare/military insurance (or many types): 0.2% (Wisconsin: 1.0%)
[in-text-ad-2]

Wyoming: Fremont County
> Americans under 65, no health insurance: 22.2% (Wyoming: 13.5%)
> Americans under 65, Medicare coverage (or multiple types): 3.3% (Wyoming: 2.3%)
> Americans under 65, Medicaid coverage (or multiple types): 19.3% (Wyoming: 12.1%)
> Americans under 65, VA coverage (or multiple types): 2.5% (Wyoming: 1.8%)
> Americans under 65, employer-based insurance (or multiple types): 50.3% (Wyoming: 64.1%)
> Americans under 65, direct-purchase insurance (or multiple types): 7.9% (Wyoming: 11.4%)
> Americans under 65, Tricare/military insurance (or many types): 1.0% (Wyoming: 3.0%)
Methodology
To determine the county with the worst health insurance coverage in every state, 24/7 Tempo reviewed five-year estimates of the percentage of the noninstitutionalized civilian population under 65 without health insurance from the U.S. Census Bureau’s 2019 American Community Survey.
Of the 3,220 counties or county equivalents, 3,141 had boundaries that fell within one of the 50 states, while the rest were in the District of Columbia or Puerto Rico.
Counties were excluded if the noninstitutionalized civilian population under 65 was less than 1,000, or if the sampling error associated with a county’s data was deemed too high.
The sampling error was defined as too high if the coefficient of variation — a statistical assessment of how reliable an estimate is — for a county’s under 65 uninsured rate was above 15% and greater than two standard deviations above the mean CV for all counties’ under 65 uninsured rates. We similarly excluded counties that had a sampling error too high for their under 65 noninstitutionalized civilian population, using the same definition.
We selected the under 65 age group because Americans become eligible for Medicare at age 65, and the uninsured rate for the population above this age is less than 1% nationwide. However, because the Census doesn’t publish insurance coverage estimates specifically for the under 65 age group, we aggregated the data from more granular age breakouts.
To ensure each aggregate estimate’s sampling error could be assessed using the definition above, we derived a margin of error for each aggregate estimate using the successive differences replication variance estimation methodology recommended and used by the U.S. Census Bureau.
The remaining 2,945 places were ranked within their state based on their under 65 uninsured rates. To break ties, we used the number of insured people in the same population group.
The share of the population covered by each type of insurance — Medicare, Medicaid, VA, employer, direct-purchase, and Tricare/military — are for the same cohort and are also aggregated from five-year ACS estimates. The estimates reflect people who are covered by that type of insurance alone or in combination with other types on the list. So, when a person is covered by more than one type of insurance, they are included in each group.
Contact [email protected] for any questions or corrections.