During the first year of the COVID-19 pandemic, the U.S. violent crime rate rose to its highest level in a decade. The increase was driven by a rise in aggravated assault and, most notably, a historic 29% surge in homicides that made 2020 the deadliest year in the United States since the mid-1990s.
Violent crime is a broad category of offenses that includes rаpe, robbery, aggravated assault, and murder. All told, more than 1.3 million violent crimes were reported in the U.S. – or 399 for every 100,000 people – in 2020, an increase of 18 incidents per 100,000 people from the previous year.
The increase in violent crime was not uniform across the country, however, and several U.S. metropolitan areas bore the brunt of the surge in criminal violence.
Using data from the FBI’s 2020 Uniform Crime Report, 24/7 Wall St. identified the 50 metro areas where crime is soaring. Metro areas are ranked by the year-over-year change in violent crimes reported for every 100,000 residents.
Surges in violence in American metro areas came during a tumultuous year. The COVID-19 pandemic shut down schools and left millions of Americans out of work. Footage of the murder of George Floyd by a Minneapolis police officer rattled confidence in American law enforcement and sparked nationwide protests. Firearms sales soared, and tens of millions of new guns proliferated across communities nationwide. Here is a look at the states buying the most guns.
Most metro areas on this list have a higher violent crime rate than the U.S. as a whole, and many also had high rates of violence before the most recent annual surge. The majority of metro areas on this list are in the South or the Midwest. Metro areas with the largest increases in violence are also more likely to have higher than average levels of underlying socioeconomic problems, such as poverty. Here is a look at the city where the most people live below the poverty line in every state.
Click here to see metros where crime is soaring
Click here to read our detailed methodology

50. Greensboro-High Point, NC
> 1-yr. change in violent crime rate: 45.9 more crimes per 100k people
> Violent crimes reported in 2020: 4,479 — 26th highest of 209 metros
> Violent crimes reported in 2019: 4,098 — 26th highest of 209 metros
> Violent crimes per 100K people in 2020: 576.2 — 31st highest of 209 metros
> Violent crimes per 100K people in 2019: 530.2 — 33rd highest of 209 metros
> Population: 771,851
[in-text-ad]

49. Fairbanks, AK
> 1-yr. change in violent crime rate: 46.8 more crimes per 100k people
> Violent crimes reported in 2020: 277 — 27th lowest of 209 metros
> Violent crimes reported in 2019: 267 — 25th lowest of 209 metros
> Violent crimes per 100K people in 2020: 841.4 — 9th highest of 209 metros
> Violent crimes per 100K people in 2019: 794.5 — 8th highest of 209 metros
> Population: 96,849
[recirclink id=1011842]
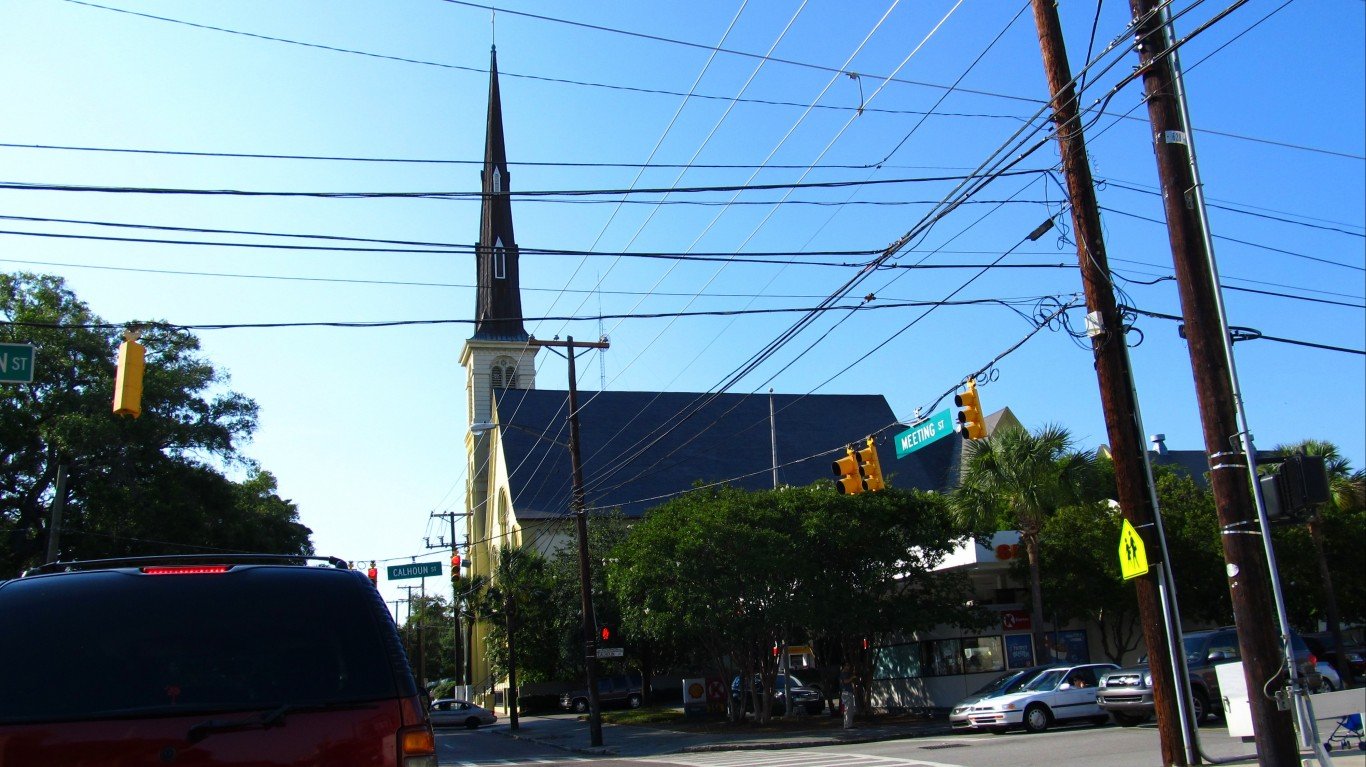
48. Charleston-North Charleston, SC
> 1-yr. change in violent crime rate: 48.2 more crimes per 100k people
> Violent crimes reported in 2020: 3,657 — 31st highest of 209 metros
> Violent crimes reported in 2019: 3,202 — 33rd highest of 209 metros
> Violent crimes per 100K people in 2020: 446.2 — 62nd highest of 209 metros
> Violent crimes per 100K people in 2019: 398.0 — 76th highest of 209 metros
> Population: 802,122

47. Chico, CA
> 1-yr. change in violent crime rate: 49.0 more crimes per 100k people
> Violent crimes reported in 2020: 1,069 — 97th highest of 209 metros
> Violent crimes reported in 2019: 1,024 — 95th highest of 209 metros
> Violent crimes per 100K people in 2020: 492.8 — 45th highest of 209 metros
> Violent crimes per 100K people in 2019: 443.8 — 55th highest of 209 metros
> Population: 219,186
[in-text-ad-2]

46. Grants Pass, OR
> 1-yr. change in violent crime rate: 49.1 more crimes per 100k people
> Violent crimes reported in 2020: 252 — 22nd lowest of 209 metros
> Violent crimes reported in 2019: 209 — 16th lowest of 209 metros
> Violent crimes per 100K people in 2020: 287.7 — 77th lowest of 209 metros
> Violent crimes per 100K people in 2019: 238.7 — 58th lowest of 209 metros
> Population: 87,487

45. Pittsfield, MA
> 1-yr. change in violent crime rate: 50.5 more crimes per 100k people
> Violent crimes reported in 2020: 533 — 63rd lowest of 209 metros
> Violent crimes reported in 2019: 475 — 59th lowest of 209 metros
> Violent crimes per 100K people in 2020: 431.2 — 66th highest of 209 metros
> Violent crimes per 100K people in 2019: 380.7 — 84th highest of 209 metros
> Population: 124,944
[in-text-ad]

44. Raleigh-Cary, NC
> 1-yr. change in violent crime rate: 51.0 more crimes per 100k people
> Violent crimes reported in 2020: 3,180 — 36th highest of 209 metros
> Violent crimes reported in 2019: 2,404 — 42nd highest of 209 metros
> Violent crimes per 100K people in 2020: 223.6 — 44th lowest of 209 metros
> Violent crimes per 100K people in 2019: 172.6 — 19th lowest of 209 metros
> Population: 1,390,785
[recirclink id=1029908]

43. Vallejo, CA
> 1-yr. change in violent crime rate: 52.8 more crimes per 100k people
> Violent crimes reported in 2020: 2,350 — 50th highest of 209 metros
> Violent crimes reported in 2019: 2,114 — 54th highest of 209 metros
> Violent crimes per 100K people in 2020: 525.7 — 37th highest of 209 metros
> Violent crimes per 100K people in 2019: 472.9 — 45th highest of 209 metros
> Population: 447,643

42. Yuma, AZ
> 1-yr. change in violent crime rate: 52.9 more crimes per 100k people
> Violent crimes reported in 2020: 717 — 86th lowest of 209 metros
> Violent crimes reported in 2019: 595 — 70th lowest of 209 metros
> Violent crimes per 100K people in 2020: 330.7 — 92nd lowest of 209 metros
> Violent crimes per 100K people in 2019: 277.8 — 78th lowest of 209 metros
> Population: 213,787
[in-text-ad-2]

41. Detroit-Warren-Dearborn, MI
> 1-yr. change in violent crime rate: 53.3 more crimes per 100k people
> Violent crimes reported in 2020: 24,568 — 3rd highest of 209 metros
> Violent crimes reported in 2019: 22,332 — 3rd highest of 209 metros
> Violent crimes per 100K people in 2020: 570.2 — 32nd highest of 209 metros
> Violent crimes per 100K people in 2019: 516.9 — 39th highest of 209 metros
> Population: 4,319,629

40. Springfield, OH
> 1-yr. change in violent crime rate: 54.0 more crimes per 100k people
> Violent crimes reported in 2020: 401 — 45th lowest of 209 metros
> Violent crimes reported in 2019: 330 — 36th lowest of 209 metros
> Violent crimes per 100K people in 2020: 300.5 — 81st lowest of 209 metros
> Violent crimes per 100K people in 2019: 246.5 — 61st lowest of 209 metros
> Population: 134,083
[in-text-ad]

39. Fargo, ND-MN
> 1-yr. change in violent crime rate: 54.0 more crimes per 100k people
> Violent crimes reported in 2020: 871 — 101st lowest of 209 metros
> Violent crimes reported in 2019: 735 — 91st lowest of 209 metros
> Violent crimes per 100K people in 2020: 350.7 — 103rd lowest of 209 metros
> Violent crimes per 100K people in 2019: 296.7 — 88th lowest of 209 metros
> Population: 246,145
[recirclink id=1033410]

38. Missoula, MT
> 1-yr. change in violent crime rate: 54.6 more crimes per 100k people
> Violent crimes reported in 2020: 489 — 58th lowest of 209 metros
> Violent crimes reported in 2019: 418 — 51st lowest of 209 metros
> Violent crimes per 100K people in 2020: 404.0 — 81st highest of 209 metros
> Violent crimes per 100K people in 2019: 349.3 — 100th highest of 209 metros
> Population: 119,600

37. Ann Arbor, MI
> 1-yr. change in violent crime rate: 56.9 more crimes per 100k people
> Violent crimes reported in 2020: 1,521 — 76th highest of 209 metros
> Violent crimes reported in 2019: 1,327 — 80th highest of 209 metros
> Violent crimes per 100K people in 2020: 412.3 — 78th highest of 209 metros
> Violent crimes per 100K people in 2019: 355.5 — 95th highest of 209 metros
> Population: 367,601
[in-text-ad-2]

36. Hot Springs, AR
> 1-yr. change in violent crime rate: 59.4 more crimes per 100k people
> Violent crimes reported in 2020: 582 — 69th lowest of 209 metros
> Violent crimes reported in 2019: 520 — 66th lowest of 209 metros
> Violent crimes per 100K people in 2020: 583.4 — 29th highest of 209 metros
> Violent crimes per 100K people in 2019: 524.0 — 38th highest of 209 metros
> Population: 99,386

35. Durham-Chapel Hill, NC
> 1-yr. change in violent crime rate: 61.3 more crimes per 100k people
> Violent crimes reported in 2020: 3,272 — 34th highest of 209 metros
> Violent crimes reported in 2019: 2,830 — 38th highest of 209 metros
> Violent crimes per 100K people in 2020: 500.4 — 42nd highest of 209 metros
> Violent crimes per 100K people in 2019: 439.1 — 56th highest of 209 metros
> Population: 644,367
[in-text-ad]
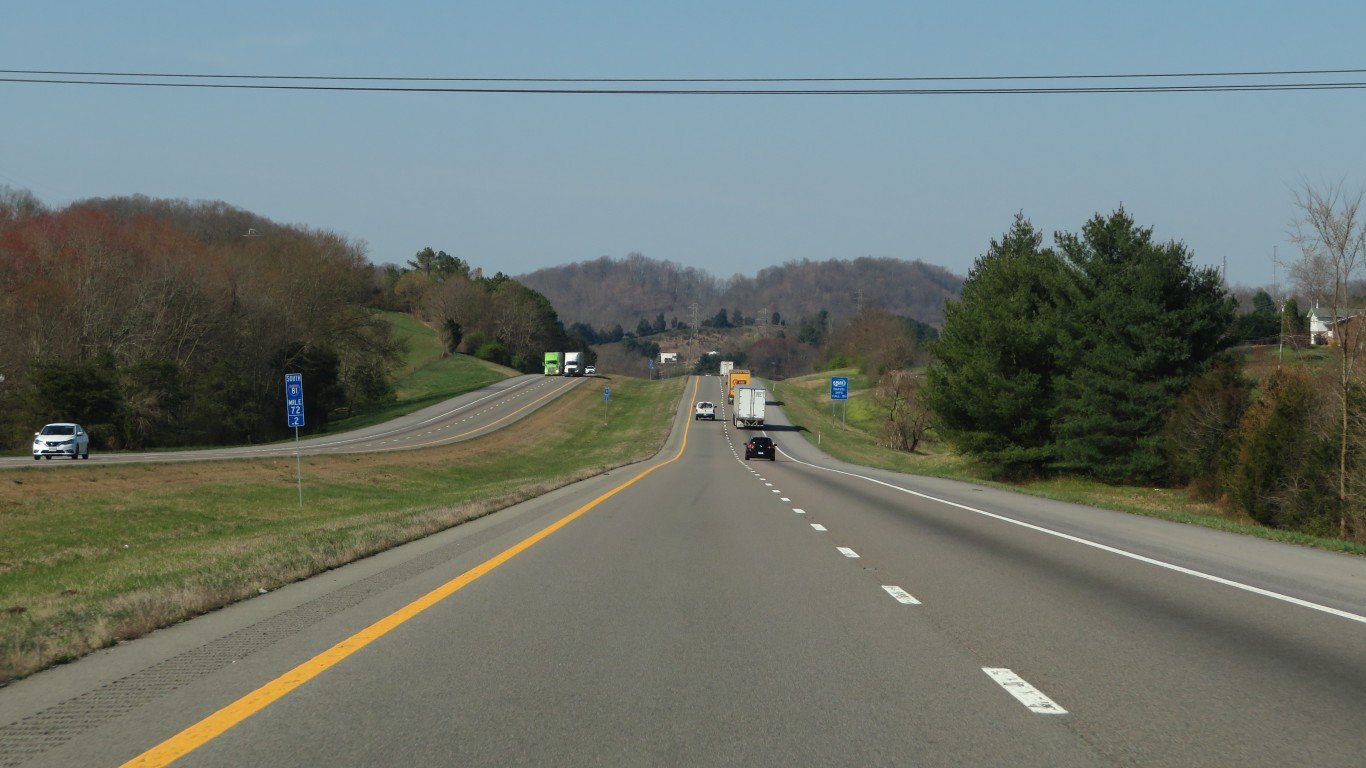
34. Kingsport-Bristol, TN-VA
> 1-yr. change in violent crime rate: 62.8 more crimes per 100k people
> Violent crimes reported in 2020: 1,116 — 94th highest of 209 metros
> Violent crimes reported in 2019: 920 — 99th highest of 209 metros
> Violent crimes per 100K people in 2020: 363.6 — 100th highest of 209 metros
> Violent crimes per 100K people in 2019: 300.8 — 90th lowest of 209 metros
> Population: 307,707
[recirclink id=1038777]

33. Cedar Rapids, IA
> 1-yr. change in violent crime rate: 63.4 more crimes per 100k people
> Violent crimes reported in 2020: 691 — 82nd lowest of 209 metros
> Violent crimes reported in 2019: 514 — 65th lowest of 209 metros
> Violent crimes per 100K people in 2020: 251.9 — 59th lowest of 209 metros
> Violent crimes per 100K people in 2019: 188.5 — 25th lowest of 209 metros
> Population: 273,032

32. Beaumont-Port Arthur, TX
> 1-yr. change in violent crime rate: 64.5 more crimes per 100k people
> Violent crimes reported in 2020: 2,372 — 49th highest of 209 metros
> Violent crimes reported in 2019: 2,133 — 51st highest of 209 metros
> Violent crimes per 100K people in 2020: 605.7 — 26th highest of 209 metros
> Violent crimes per 100K people in 2019: 541.2 — 31st highest of 209 metros
> Population: 392,563
[in-text-ad-2]
31. Goldsboro, NC
> 1-yr. change in violent crime rate: 66.7 more crimes per 100k people
> Violent crimes reported in 2020: 593 — 70th lowest of 209 metros
> Violent crimes reported in 2019: 511 — 63rd lowest of 209 metros (tied)
> Violent crimes per 100K people in 2020: 481.4 — 49th highest of 209 metros
> Violent crimes per 100K people in 2019: 414.7 — 68th highest of 209 metros
> Population: 123,131

30. San Luis Obispo-Paso Robles, CA
> 1-yr. change in violent crime rate: 67.3 more crimes per 100k people
> Violent crimes reported in 2020: 816 — 95th lowest of 209 metros
> Violent crimes reported in 2019: 630 — 74th lowest of 209 metros
> Violent crimes per 100K people in 2020: 289.6 — 78th lowest of 209 metros
> Violent crimes per 100K people in 2019: 222.3 — 47th lowest of 209 metros
> Population: 283,111
[in-text-ad]

29. Gainesville, FL
> 1-yr. change in violent crime rate: 68.2 more crimes per 100k people
> Violent crimes reported in 2020: 2,516 — 47th highest of 209 metros
> Violent crimes reported in 2019: 2,282 — 46th highest of 209 metros
> Violent crimes per 100K people in 2020: 760.3 — 13th highest of 209 metros
> Violent crimes per 100K people in 2019: 692.1 — 13th highest of 209 metros
> Population: 328,517
[recirclink id=1055273]

28. Lansing-East Lansing, MI
> 1-yr. change in violent crime rate: 68.2 more crimes per 100k people
> Violent crimes reported in 2020: 2,741 — 41st highest of 209 metros
> Violent crimes reported in 2019: 2,367 — 43rd highest of 209 metros
> Violent crimes per 100K people in 2020: 498.1 — 44th highest of 209 metros
> Violent crimes per 100K people in 2019: 429.9 — 60th highest of 209 metros
> Population: 550,391

27. Burlington, NC
> 1-yr. change in violent crime rate: 70.1 more crimes per 100k people
> Violent crimes reported in 2020: 820 — 96th lowest of 209 metros
> Violent crimes reported in 2019: 686 — 82nd lowest of 209 metros
> Violent crimes per 100K people in 2020: 477.7 — 51st highest of 209 metros
> Violent crimes per 100K people in 2019: 407.6 — 71st highest of 209 metros
> Population: 169,509
[in-text-ad-2]

26. Bakersfield, CA
> 1-yr. change in violent crime rate: 71.2 more crimes per 100k people
> Violent crimes reported in 2020: 6,216 — 21st highest of 209 metros
> Violent crimes reported in 2019: 5,567 — 22nd highest of 209 metros
> Violent crimes per 100K people in 2020: 692.3 — 15th highest of 209 metros
> Violent crimes per 100K people in 2019: 621.1 — 17th highest of 209 metros
> Population: 900,202

25. Idaho Falls, ID
> 1-yr. change in violent crime rate: 79.1 more crimes per 100k people
> Violent crimes reported in 2020: 439 — 52nd lowest of 209 metros (tied)
> Violent crimes reported in 2019: 310 — 32nd lowest of 209 metros
> Violent crimes per 100K people in 2020: 283.6 — 74th lowest of 209 metros
> Violent crimes per 100K people in 2019: 204.5 — 35th lowest of 209 metros
> Population: 151,516
[in-text-ad]

24. New Bern, NC
> 1-yr. change in violent crime rate: 79.6 more crimes per 100k people
> Violent crimes reported in 2020: 451 — 55th lowest of 209 metros
> Violent crimes reported in 2019: 355 — 40th lowest of 209 metros
> Violent crimes per 100K people in 2020: 363.8 — 99th highest of 209 metros
> Violent crimes per 100K people in 2019: 284.3 — 83rd lowest of 209 metros
> Population: 127,904
[recirclink id=1011842]

23. Springfield, IL
> 1-yr. change in violent crime rate: 82.6 more crimes per 100k people
> Violent crimes reported in 2020: 1,369 — 83rd highest of 209 metros
> Violent crimes reported in 2019: 1,205 — 84th highest of 209 metros
> Violent crimes per 100K people in 2020: 666.5 — 17th highest of 209 metros
> Violent crimes per 100K people in 2019: 584.0 — 20th highest of 209 metros
> Population: 207,003

22. Grand Junction, CO
> 1-yr. change in violent crime rate: 83.1 more crimes per 100k people
> Violent crimes reported in 2020: 565 — 66th lowest of 209 metros
> Violent crimes reported in 2019: 435 — 54th lowest of 209 metros
> Violent crimes per 100K people in 2020: 366.6 — 95th highest of 209 metros
> Violent crimes per 100K people in 2019: 283.5 — 82nd lowest of 209 metros
> Population: 154,210
[in-text-ad-2]

21. Sioux Falls, SD
> 1-yr. change in violent crime rate: 89.5 more crimes per 100k people
> Violent crimes reported in 2020: 1,304 — 88th highest of 209 metros
> Violent crimes reported in 2019: 1,043 — 94th highest of 209 metros
> Violent crimes per 100K people in 2020: 477.7 — 52nd highest of 209 metros
> Violent crimes per 100K people in 2019: 388.1 — 79th highest of 209 metros
> Population: 268,833
20. Kalamazoo-Portage, MI
> 1-yr. change in violent crime rate: 90.7 more crimes per 100k people
> Violent crimes reported in 2020: 1,763 — 66th highest of 209 metros
> Violent crimes reported in 2019: 1,523 — 72nd highest of 209 metros
> Violent crimes per 100K people in 2020: 663.3 — 21st highest of 209 metros
> Violent crimes per 100K people in 2019: 572.5 — 23rd highest of 209 metros
> Population: 265,066
[in-text-ad]

19. Sumter, SC
> 1-yr. change in violent crime rate: 93.4 more crimes per 100k people
> Violent crimes reported in 2020: 1,140 — 92nd highest of 209 metros
> Violent crimes reported in 2019: 1,006 — 96th highest of 209 metros
> Violent crimes per 100K people in 2020: 812.0 — 10th highest of 209 metros
> Violent crimes per 100K people in 2019: 718.6 — 11th highest of 209 metros
> Population: 140,466
[recirclink id=1029908]

18. Twin Falls, ID
> 1-yr. change in violent crime rate: 96.6 more crimes per 100k people
> Violent crimes reported in 2020: 435 — 51st lowest of 209 metros
> Violent crimes reported in 2019: 321 — 33rd lowest of 209 metros
> Violent crimes per 100K people in 2020: 383.4 — 84th highest of 209 metros
> Violent crimes per 100K people in 2019: 286.8 — 85th lowest of 209 metros
> Population: 109,784

17. Jonesboro, AR
> 1-yr. change in violent crime rate: 103.6 more crimes per 100k people
> Violent crimes reported in 2020: 893 — 105th highest of 209 metros
> Violent crimes reported in 2019: 743 — 92nd lowest of 209 metros
> Violent crimes per 100K people in 2020: 659.6 — 22nd highest of 209 metros
> Violent crimes per 100K people in 2019: 556.0 — 27th highest of 209 metros
> Population: 133,860
[in-text-ad-2]

16. Yakima, WA
> 1-yr. change in violent crime rate: 105.6
> Violent crimes reported in 2020: 966 — 100th highest of 209 metros
> Violent crimes reported in 2019: 703 — 86th lowest of 209 metros
> Violent crimes per 100K people in 2020: 385.2 — 83rd highest of 209 metros
> Violent crimes per 100K people in 2019: 279.6 — 79th lowest of 209 metros
> Population: 250,873

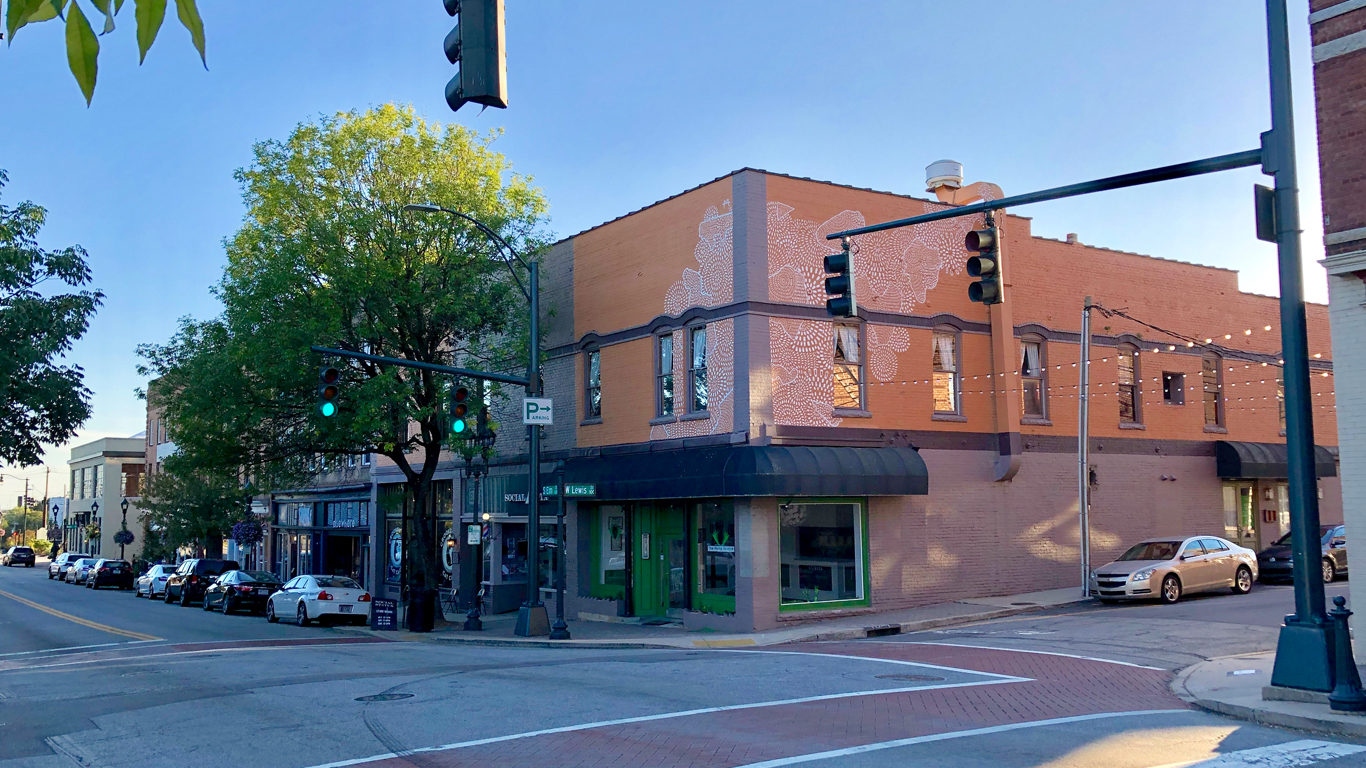
15. Decatur, IL
> 1-yr. change in violent crime rate: 106.3 more crimes per 100k people
> Violent crimes reported in 2020: 540 — 65th lowest of 209 metros
> Violent crimes reported in 2019: 434 — 53rd lowest of 209 metros
> Violent crimes per 100K people in 2020: 525.6 — 38th highest of 209 metros
> Violent crimes per 100K people in 2019: 419.3 — 67th highest of 209 metros
> Population: 104,009
[in-text-ad]

14. Greeley, CO
> 1-yr. change in violent crime rate: 108.3 more crimes per 100k people
> Violent crimes reported in 2020: 1,074 — 96th highest of 209 metros
> Violent crimes reported in 2019: 694 — 84th lowest of 209 metros
> Violent crimes per 100K people in 2020: 324.2 — 90th lowest of 209 metros
> Violent crimes per 100K people in 2019: 215.9 — 38th lowest of 209 metros
> Population: 324,492
[recirclink id=1033410]

13. Davenport-Moline-Rock Island, IA-IL
> 1-yr. change in violent crime rate: 109.5 more crimes per 100k people
> Violent crimes reported in 2020: 1,798 — 64th highest of 209 metros
> Violent crimes reported in 2019: 1,392 — 78th highest of 209 metros
> Violent crimes per 100K people in 2020: 475.9 — 53rd highest of 209 metros
> Violent crimes per 100K people in 2019: 366.4 — 92nd highest of 209 metros
> Population: 378,923

12. Sioux City, IA-NE-SD
> 1-yr. change in violent crime rate: 112.7 more crimes per 100k people
> Violent crimes reported in 2020: 619 — 74th lowest of 209 metros
> Violent crimes reported in 2019: 452 — 57th lowest of 209 metros
> Violent crimes per 100K people in 2020: 428.3 — 70th highest of 209 metros
> Violent crimes per 100K people in 2019: 315.6 — 95th lowest of 209 metros
> Population: 144,670
[in-text-ad-2]

11. Niles, MI
> 1-yr. change in violent crime rate: 113.4 more crimes per 100k people
> Violent crimes reported in 2020: 1,013 — 98th highest of 209 metros
> Violent crimes reported in 2019: 845 — 105th highest of 209 metros
> Violent crimes per 100K people in 2020: 664.2 — 19th highest of 209 metros
> Violent crimes per 100K people in 2019: 550.7 — 29th highest of 209 metros
> Population: 153,401

10. Danville, IL
> 1-yr. change in violent crime rate: 114.6 more crimes per 100k people
> Violent crimes reported in 2020: 785 — 93rd lowest of 209 metros
> Violent crimes reported in 2019: 710 — 88th lowest of 209 metros
> Violent crimes per 100K people in 2020: 1,050.3 — 4th highest of 209 metros
> Violent crimes per 100K people in 2019: 935.7 — 3rd highest of 209 metros
> Population: 75,758
[in-text-ad]

9. Alexandria, LA
> 1-yr. change in violent crime rate: 118.6 more crimes per 100k people
> Violent crimes reported in 2020: 1,464 — 80th highest of 209 metros
> Violent crimes reported in 2019: 1,291 — 81st highest of 209 metros
> Violent crimes per 100K people in 2020: 967.8 — 6th highest of 209 metros
> Violent crimes per 100K people in 2019: 849.2 — 5th highest of 209 metros
> Population: 152,037
[recirclink id=1038777]

8. Shreveport-Bossier City, LA
> 1-yr. change in violent crime rate: 119.8 more crimes per 100k people
> Violent crimes reported in 2020: 2,683 — 42nd highest of 209 metros
> Violent crimes reported in 2019: 2,225 — 48th highest of 209 metros
> Violent crimes per 100K people in 2020: 683.0 — 16th highest of 209 metros
> Violent crimes per 100K people in 2019: 563.2 — 25th highest of 209 metros
> Population: 394,706

7. Rapid City, SD
> 1-yr. change in violent crime rate: 132.9 more crimes per 100k people
> Violent crimes reported in 2020: 957 — 102nd highest of 209 metros
> Violent crimes reported in 2019: 749 — 94th lowest of 209 metros
> Violent crimes per 100K people in 2020: 665.1 — 18th highest of 209 metros
> Violent crimes per 100K people in 2019: 532.2 — 32nd highest of 209 metros
> Population: 142,191
[in-text-ad-2]

6. Dubuque, IA
> 1-yr. change in violent crime rate: 134.2 more crimes per 100k people
> Violent crimes reported in 2020: 262 — 26th lowest of 209 metros
> Violent crimes reported in 2019: 130 — 6th lowest of 209 metros
> Violent crimes per 100K people in 2020: 268.6 — 65th lowest of 209 metros
> Violent crimes per 100K people in 2019: 134.4 — 7th lowest of 209 metros
> Population: 97,311

5. Rockford, IL
> 1-yr. change in violent crime rate: 136.2 more crimes per 100k people
> Violent crimes reported in 2020: 2,566 — 46th highest of 209 metros
> Violent crimes reported in 2019: 2,124 — 52nd highest of 209 metros
> Violent crimes per 100K people in 2020: 770.7 — 12th highest of 209 metros
> Violent crimes per 100K people in 2019: 634.5 — 14th highest of 209 metros
> Population: 336,116
[in-text-ad]

4. Little Rock-North Little Rock-Conway, AR
> 1-yr. change in violent crime rate: 156.6 more crimes per 100k people
> Violent crimes reported in 2020: 7,014 — 18th highest of 209 metros
> Violent crimes reported in 2019: 5,819 — 21st highest of 209 metros
> Violent crimes per 100K people in 2020: 938.8 — 7th highest of 209 metros
> Violent crimes per 100K people in 2019: 782.3 — 10th highest of 209 metros
> Population: 744,483
[recirclink id=1055273]

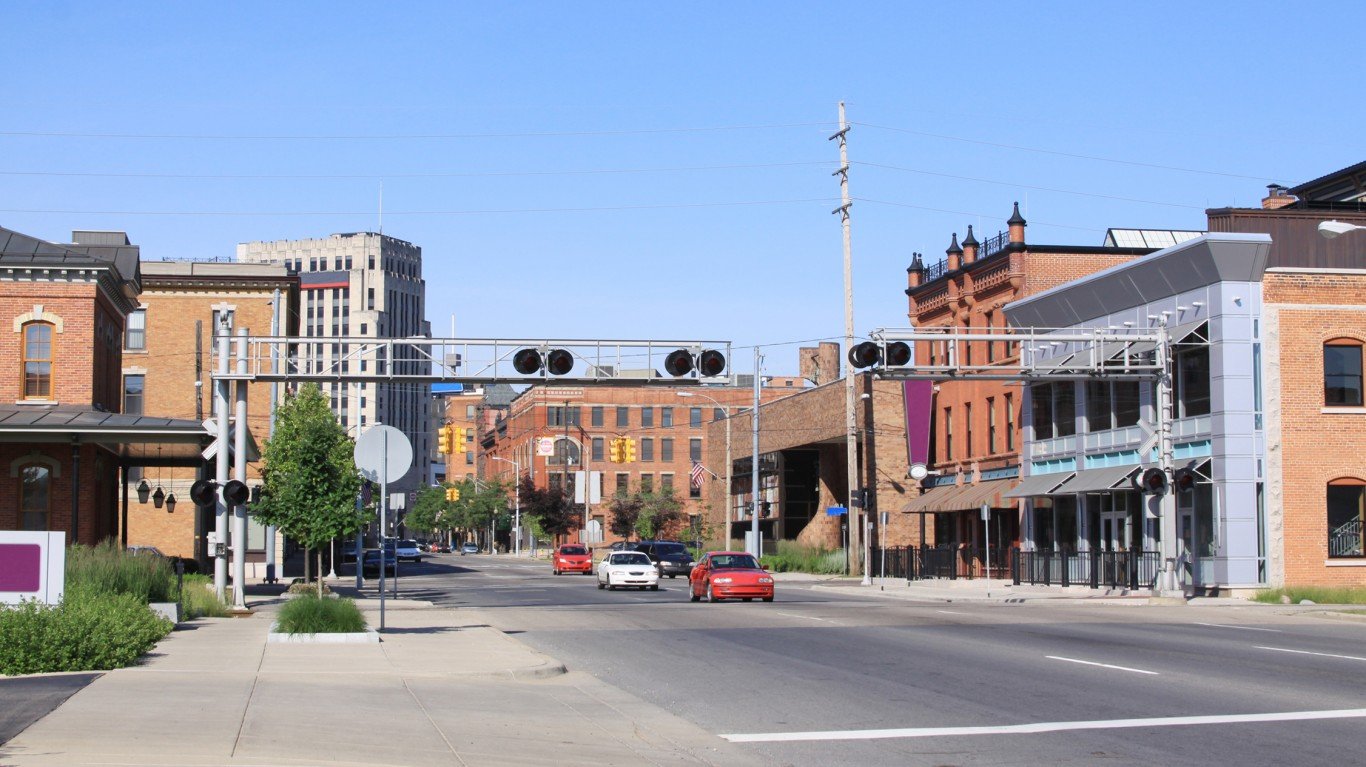
3. Saginaw, MI
> 1-yr. change in violent crime rate: 171.0 more crimes per 100k people
> Violent crimes reported in 2020: 1,501 — 77th highest of 209 metros
> Violent crimes reported in 2019: 1,180 — 87th highest of 209 metros
> Violent crimes per 100K people in 2020: 794.6 — 11th highest of 209 metros
> Violent crimes per 100K people in 2019: 623.6 — 16th highest of 209 metros
> Population: 190,539

2. Pine Bluff, AR
> 1-yr. change in violent crime rate: 202.4 more crimes per 100k people
> Violent crimes reported in 2020: 950 — 103rd highest of 209 metros
> Violent crimes reported in 2019: 788 — 100th lowest of 209 metros
> Violent crimes per 100K people in 2020: 1,097.8 — 3rd highest of 209 metros
> Violent crimes per 100K people in 2019: 895.4 — 4th highest of 209 metros
> Population: 89,437
[in-text-ad-2]

1. Monroe, LA
> 1-yr. change in violent crime rate: 496.0 more crimes per 100k people
> Violent crimes reported in 2020: 2,605 — 45th highest of 209 metros
> Violent crimes reported in 2019: 1,631 — 67th highest of 209 metros
> Violent crimes per 100K people in 2020: 1,308.5 — the highest of 209 metros
> Violent crimes per 100K people in 2019: 812.5 — 7th highest of 209 metros
> Population: 200,261
Methodology
To determine the metro areas where crime is soaring, 24/7 Wall St. reviewed the change in violent crime rate per 100,000 people from the FBI’s 2019 and 2020 Uniform Crime Reports. Violent crime includes murder, non-negligent manslaughter, rаpe, robbery, and aggravated assault.
Limited data was available in the 2020 UCR for areas in Alabama, Maryland, Pennsylvania, and Illinois, though metro areas in these states were not excluded from analysis. Only metro areas for which the boundaries defined by the FBI match the boundaries as defined by the U.S. Census Bureau were considered. Because some state and local agencies changed reporting practices between 2019 and 2020, the figures aren’t comparable, and those states and areas were excluded.
Population figures are one-year estimates from the U.S. Census Bureau’s 2019 American Community Survey. However, these estimates were not used to calculate crime rates. Crime rates per 100,000 people were calculated using population figures provided by the FBI in the 2020 and 2019 UCR.
Contact [email protected] for any questions or corrections.