Burglary – defined as the unlawful entry of a structure, such as a home or business, to commit a theft or felony – is the most serious nonviolent offense tracked by the FBI. There were just over 1 million burglaries reported in the United States in 2020, resulting in billions of dollars in stolen property.
Most burglaries in the U.S. are committed in residential properties, and more often during the day than at night. Not only do victims of burglaries typically suffer material loss, but they can also be impacted psychologically. Many burglary victims have reported heightened anxiety, difficulty sleeping, feelings of vulnerability, and even post-traumatic stress disorder in some cases.
Encouragingly, burglaries are becoming less common in the United States, with total reported cases dropping by 7% in the most recent year of available data. The decline in the burglary rates nationwide are being driven by steep declines in burglary rates in some major metropolitan areas. Here is a look at the American cities with the fewest break-ins.
Using data from the FBI’s 2020 Uniform Crime Report, 24/7 Wall St. identified the 50 metro areas where the burglary rate is falling fastest. Metro areas are ranked by the year-over-year change in the number of burglaries reported for every 100,000 people.
Among the metro areas on this list, burglary rates have declined anywhere from 68 incidents for every 100,000 people to 276 per 100,000. Nationwide, the burglary rate fell by 26 incidents per 100,000 people. Most of the metro areas on this list are in the South, including eight in Florida alone.
Though burglary rates are falling in the metro areas on this list, most still have a higher burglary rate than the national rate of 314 incidents per 100,000 people. Burglary – along with vehicle theft and larceny – is one component of the overall property crime category. In nearly every metro area on this list, the property crime rate also fell in the last year. Here is a look at the states where property crime is soaring.
Click here to see the metros where the burglary rate is falling
Click here to read our detailed methodology

50. Palm Bay-Melbourne-Titusville, FL
> Change in reported burglary rate, 2019-2020: -68.4
> Burglaries reported in 2020: 1,629 — 56th highest of 200 metros
> Burglaries per 100K people in 2020: 268.4 — 74th lowest of 200 metros
> 1-yr. change in all property crime per 100K people: -289.9 — 56th lowest of 188 metros
> Property crimes per 100K people in 2020: 1,756.6 — 72nd lowest of 190 metros
> Population: 601,942
[in-text-ad]

49. Riverside-San Bernardino-Ontario, CA
> Change in reported burglary rate, 2019-2020: -69.0
> Burglaries reported in 2020: 17,140 — 3rd highest of 200 metros
> Burglaries per 100K people in 2020: 368.5 — 79th highest of 200 metros
> 1-yr. change in all property crime per 100K people: -290.6 — 55th lowest of 188 metros
> Property crimes per 100K people in 2020: 1,984.5 — 93rd highest of 190 metros
> Population: 4,650,631
[recirclink id=1059954]

48. Yuma, AZ
> Change in reported burglary rate, 2019-2020: -69.0
> Burglaries reported in 2020: 653 — 79th lowest of 200 metros
> Burglaries per 100K people in 2020: 301.2 — 89th lowest of 200 metros
> 1-yr. change in all property crime per 100K people: -238.5 — 71st lowest of 188 metros
> Property crimes per 100K people in 2020: 1,492.0 — 51st lowest of 190 metros
> Population: 213,787

47. Gainesville, FL
> Change in reported burglary rate, 2019-2020: -69.5
> Burglaries reported in 2020: 1,120 — 85th highest of 200 metros
> Burglaries per 100K people in 2020: 338.5 — 90th highest of 200 metros
> 1-yr. change in all property crime per 100K people: -213.5 — 75th lowest of 188 metros
> Property crimes per 100K people in 2020: 2,240.5 — 56th highest of 190 metros
> Population: 328,517
[in-text-ad-2]
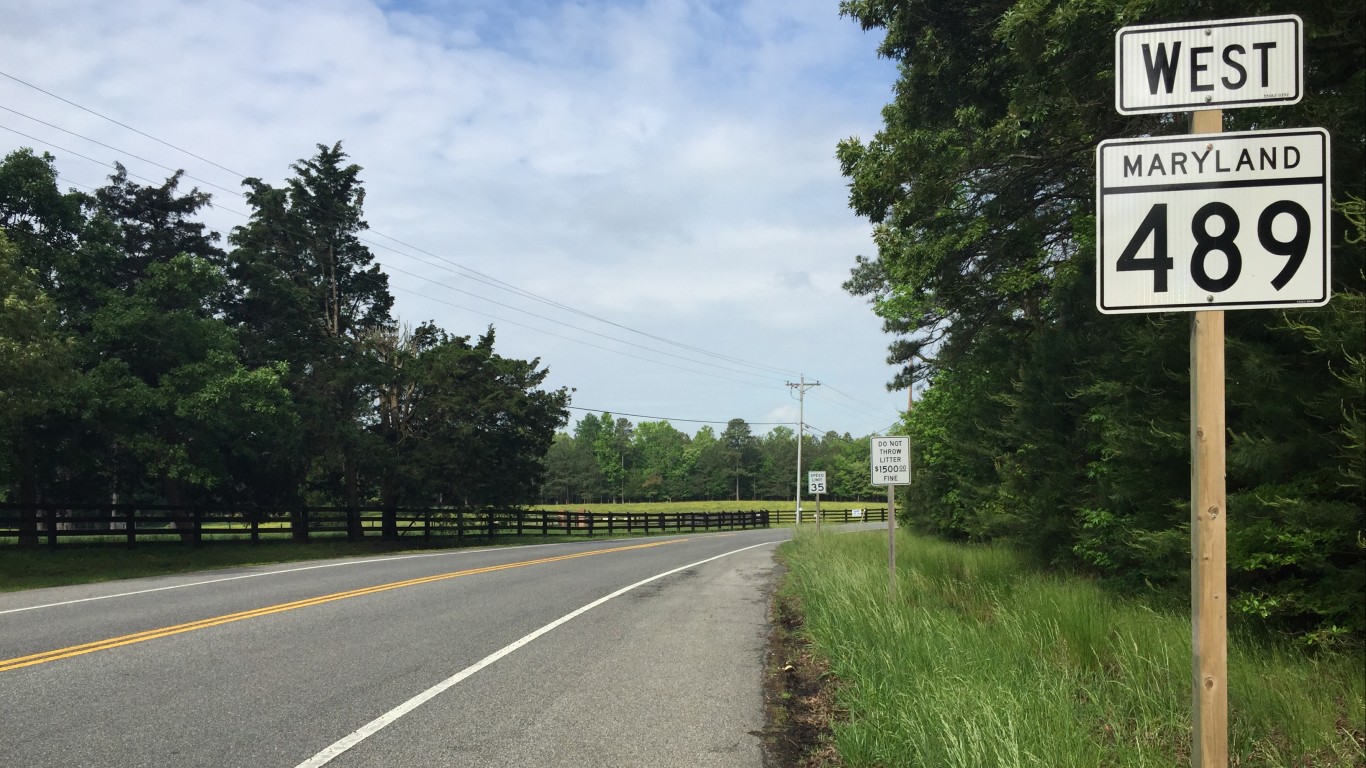
46. California-Lexington Park, MD
> Change in reported burglary rate, 2019-2020: -71.1
> Burglaries reported in 2020: 255 — 20th lowest of 200 metros (tied)
> Burglaries per 100K people in 2020: 223.6 — 54th lowest of 200 metros
> 1-yr. change in all property crime per 100K people: -299.3 — 52nd lowest of 188 metros
> Property crimes per 100K people in 2020: 1,364.5 — 43rd lowest of 190 metros
> Population: 113,510

45. Johnson City, TN
> Change in reported burglary rate, 2019-2020: -72.6
> Burglaries reported in 2020: 567 — 69th lowest of 200 metros
> Burglaries per 100K people in 2020: 277.7 — 80th lowest of 200 metros
> 1-yr. change in all property crime per 100K people: -71.9 — 55th highest of 188 metros
> Property crimes per 100K people in 2020: 2,140.7 — 72nd highest of 190 metros
> Population: 203,697
[in-text-ad]

44. Roanoke, VA
> Change in reported burglary rate, 2019-2020: -74.1
> Burglaries reported in 2020: 656 — 80th lowest of 200 metros
> Burglaries per 100K people in 2020: 209.3 — 47th lowest of 200 metros
> 1-yr. change in all property crime per 100K people: -283.9 — 60th lowest of 188 metros
> Property crimes per 100K people in 2020: 2,107.6 — 76th highest of 190 metros
> Population: 312,796
[recirclink id=1066891]
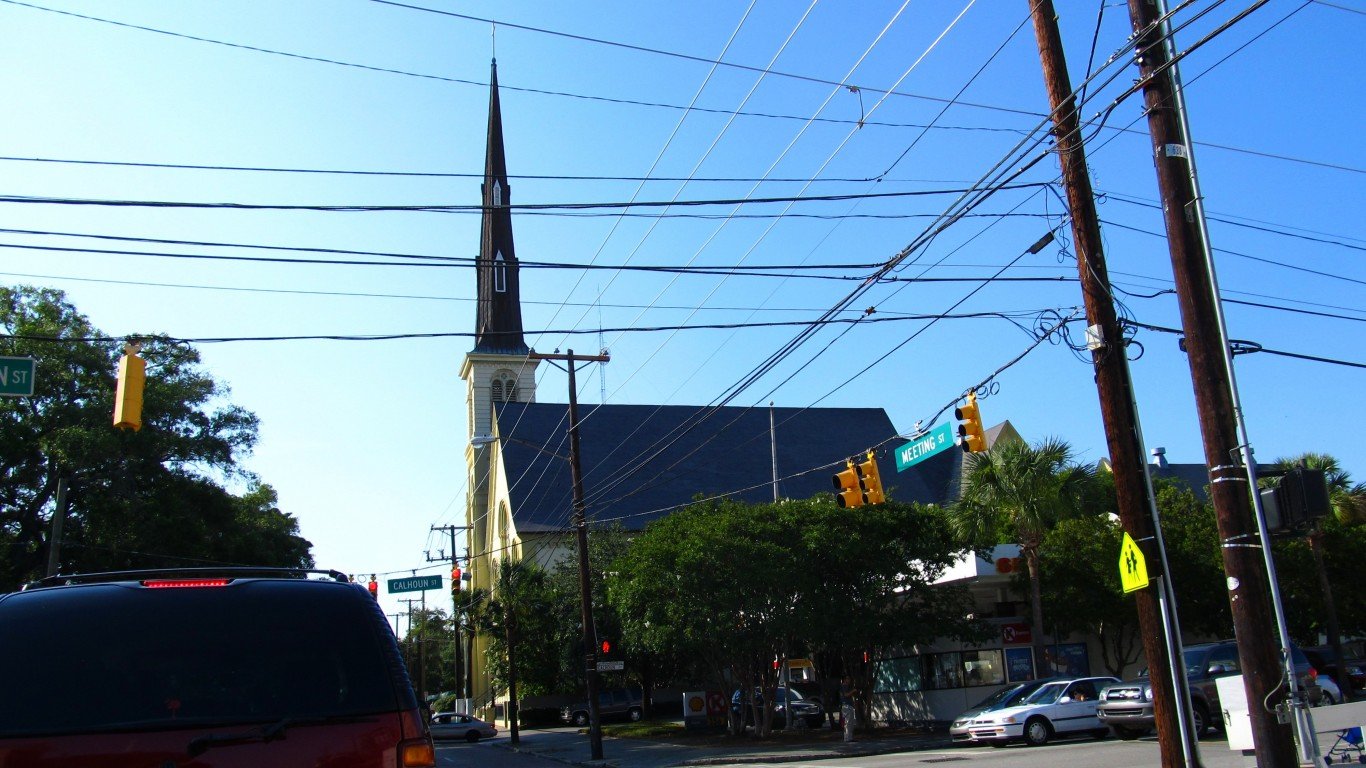
43. Charleston-North Charleston, SC
> Change in reported burglary rate, 2019-2020: -74.3
> Burglaries reported in 2020: 2,533 — 33rd highest of 200 metros
> Burglaries per 100K people in 2020: 309.0 — 97th lowest of 200 metros
> 1-yr. change in all property crime per 100K people: -198.2 — 79th lowest of 188 metros
> Property crimes per 100K people in 2020: 2,480.6 — 40th highest of 190 metros
> Population: 802,122

42. St. George, UT
> Change in reported burglary rate, 2019-2020: -81.9
> Burglaries reported in 2020: 273 — 25th lowest of 200 metros
> Burglaries per 100K people in 2020: 149.9 — 19th lowest of 200 metros
> 1-yr. change in all property crime per 100K people: -277.8 — 62nd lowest of 188 metros
> Property crimes per 100K people in 2020: 1,163.3 — 25th lowest of 190 metros
> Population: 177,556
[in-text-ad-2]

41. Huntington-Ashland, WV-KY-OH
> Change in reported burglary rate, 2019-2020: -82.7
> Burglaries reported in 2020: 1,015 — 88th highest of 200 metros
> Burglaries per 100K people in 2020: 286.8 — 82nd lowest of 200 metros
> 1-yr. change in all property crime per 100K people: -201.9 — 78th lowest of 188 metros
> Property crimes per 100K people in 2020: 1,472.9 — 47th lowest of 190 metros
> Population: 355,873

40. Clarksville, TN-KY
> Change in reported burglary rate, 2019-2020: -83.1
> Burglaries reported in 2020: 893 — 93rd highest of 200 metros
> Burglaries per 100K people in 2020: 286.4 — 81st lowest of 200 metros
> 1-yr. change in all property crime per 100K people: -407.9 — 24th lowest of 188 metros
> Property crimes per 100K people in 2020: 1,852.5 — 83rd lowest of 190 metros
> Population: 311,073
[in-text-ad]

39. Fort Smith, AR-OK
> Change in reported burglary rate, 2019-2020: -83.4
> Burglaries reported in 2020: 1,303 — 75th highest of 200 metros
> Burglaries per 100K people in 2020: 519.9 — 28th highest of 200 metros
> 1-yr. change in all property crime per 100K people: -299.8 — 50th lowest of 188 metros
> Property crimes per 100K people in 2020: 2,882.6 — 19th highest of 190 metros
> Population: 249,152
[recirclink id=1023032]

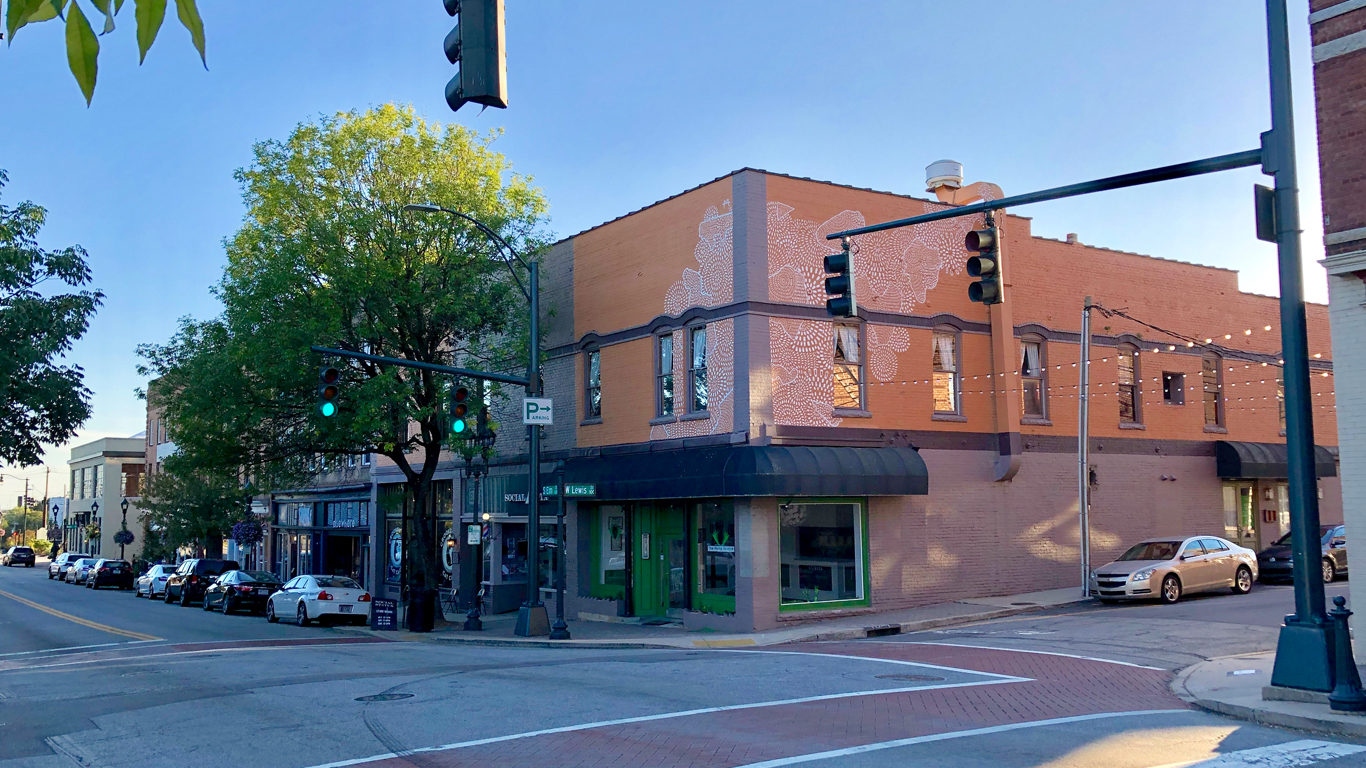
38. Rockford, IL
> Change in reported burglary rate, 2019-2020: -85.4
> Burglaries reported in 2020: 1,132 — 83rd highest of 200 metros
> Burglaries per 100K people in 2020: 340.0 — 88th highest of 200 metros
> 1-yr. change in all property crime per 100K people: N/A
> Property crimes per 100K people in 2020: N/A
> Population: 336,116

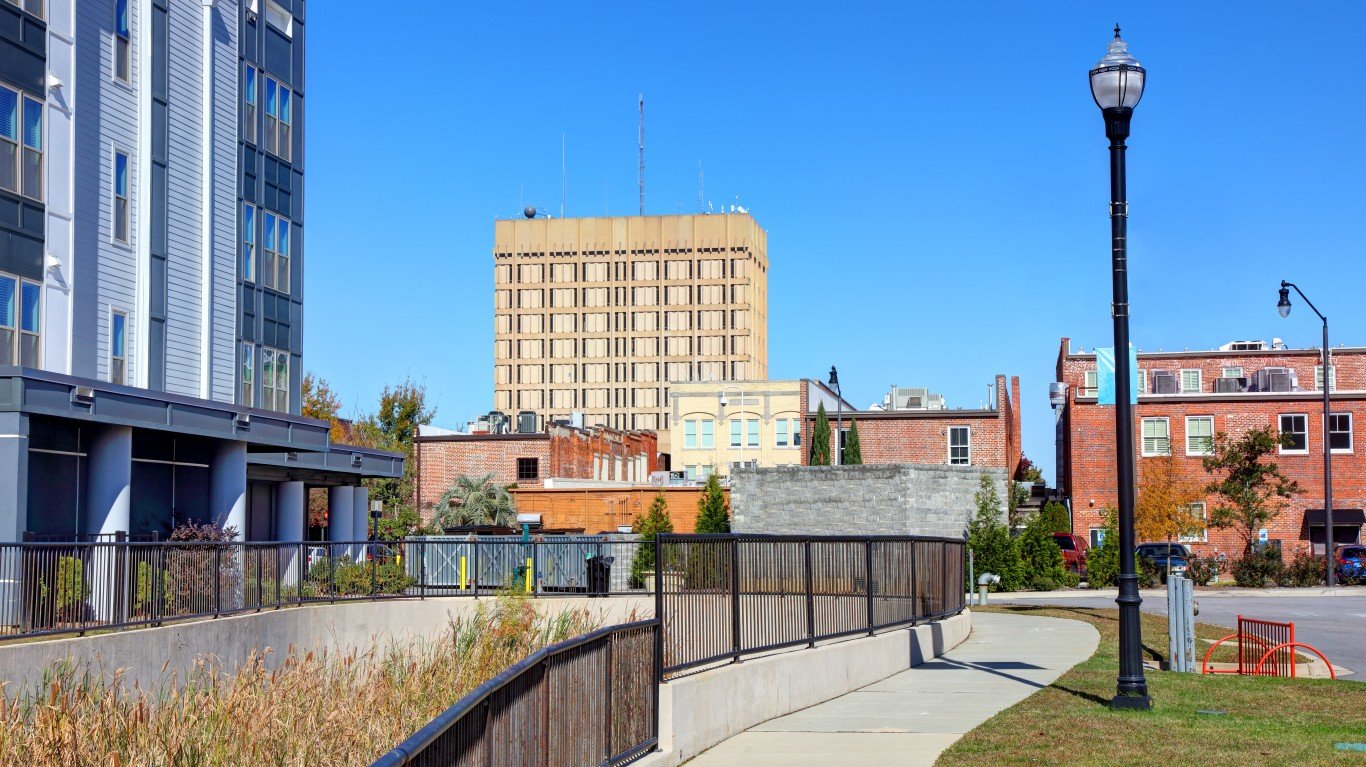
37. Spartanburg, SC
> Change in reported burglary rate, 2019-2020: -85.4
> Burglaries reported in 2020: 1,703 — 53rd highest of 200 metros
> Burglaries per 100K people in 2020: 525.1 — 27th highest of 200 metros
> 1-yr. change in all property crime per 100K people: -299.0 — 53rd lowest of 188 metros
> Property crimes per 100K people in 2020: 2,446.7 — 41st highest of 190 metros
> Population: 319,785
[in-text-ad-2]

36. Fort Wayne, IN
> Change in reported burglary rate, 2019-2020: -85.9
> Burglaries reported in 2020: 851 — 100th lowest of 200 metros
> Burglaries per 100K people in 2020: 204.7 — 43rd lowest of 200 metros
> 1-yr. change in all property crime per 100K people: -365.5 — 33rd lowest of 188 metros
> Property crimes per 100K people in 2020: 1,748.2 — 71st lowest of 190 metros
> Population: 413,263

35. Alexandria, LA
> Change in reported burglary rate, 2019-2020: -87.7
> Burglaries reported in 2020: 1,541 — 61st highest of 200 metros
> Burglaries per 100K people in 2020: 1,018.7 — the highest of 200 metros
> 1-yr. change in all property crime per 100K people: -520.0 — 10th lowest of 188 metros
> Property crimes per 100K people in 2020: 4,018.7 — 2nd highest of 190 metros
> Population: 152,037
[in-text-ad]

34. Wilmington, NC
> Change in reported burglary rate, 2019-2020: -88.3
> Burglaries reported in 2020: 1,127 — 84th highest of 200 metros
> Burglaries per 100K people in 2020: 372.4 — 74th highest of 200 metros
> 1-yr. change in all property crime per 100K people: -179.7 — 91st lowest of 188 metros
> Property crimes per 100K people in 2020: 2,001.9 — 90th highest of 190 metros
> Population: 297,533
[recirclink id=1030620]

33. Canton-Massillon, OH
> Change in reported burglary rate, 2019-2020: -88.4
> Burglaries reported in 2020: 1,591 — 58th highest of 200 metros
> Burglaries per 100K people in 2020: 401.5 — 58th highest of 200 metros
> 1-yr. change in all property crime per 100K people: -66.8 — 53rd highest of 188 metros
> Property crimes per 100K people in 2020: 2,156.5 — 66th highest of 190 metros
> Population: 397,520

32. Orlando-Kissimmee-Sanford, FL
> Change in reported burglary rate, 2019-2020: -90.6
> Burglaries reported in 2020: 7,138 — 13th highest of 200 metros
> Burglaries per 100K people in 2020: 268.4 — 75th lowest of 200 metros
> 1-yr. change in all property crime per 100K people: -537.9 — 9th lowest of 188 metros
> Property crimes per 100K people in 2020: 1,862.1 — 86th lowest of 190 metros
> Population: 2,608,147
[in-text-ad-2]

31. Detroit-Warren-Dearborn, MI
> Change in reported burglary rate, 2019-2020: -91.5
> Burglaries reported in 2020: 9,472 — 5th highest of 200 metros
> Burglaries per 100K people in 2020: 219.8 — 51st lowest of 200 metros
> 1-yr. change in all property crime per 100K people: -349.1 — 38th lowest of 188 metros
> Property crimes per 100K people in 2020: 1,333.3 — 37th lowest of 190 metros
> Population: 4,319,629

30. Chico, CA
> Change in reported burglary rate, 2019-2020: -97.5
> Burglaries reported in 2020: 833 — 97th lowest of 200 metros
> Burglaries per 100K people in 2020: 384.0 — 67th highest of 200 metros
> 1-yr. change in all property crime per 100K people: -311.4 — 48th lowest of 188 metros
> Property crimes per 100K people in 2020: 1,995.0 — 92nd highest of 190 metros
> Population: 219,186
[in-text-ad]

29. Jacksonville, FL
> Change in reported burglary rate, 2019-2020: -97.8
> Burglaries reported in 2020: 4,996 — 20th highest of 200 metros
> Burglaries per 100K people in 2020: 316.0 — 100th lowest of 200 metros
> 1-yr. change in all property crime per 100K people: -352.3 — 36th lowest of 188 metros
> Property crimes per 100K people in 2020: 2,153.1 — 67th highest of 190 metros
> Population: 1,559,514
[recirclink id=1020198]

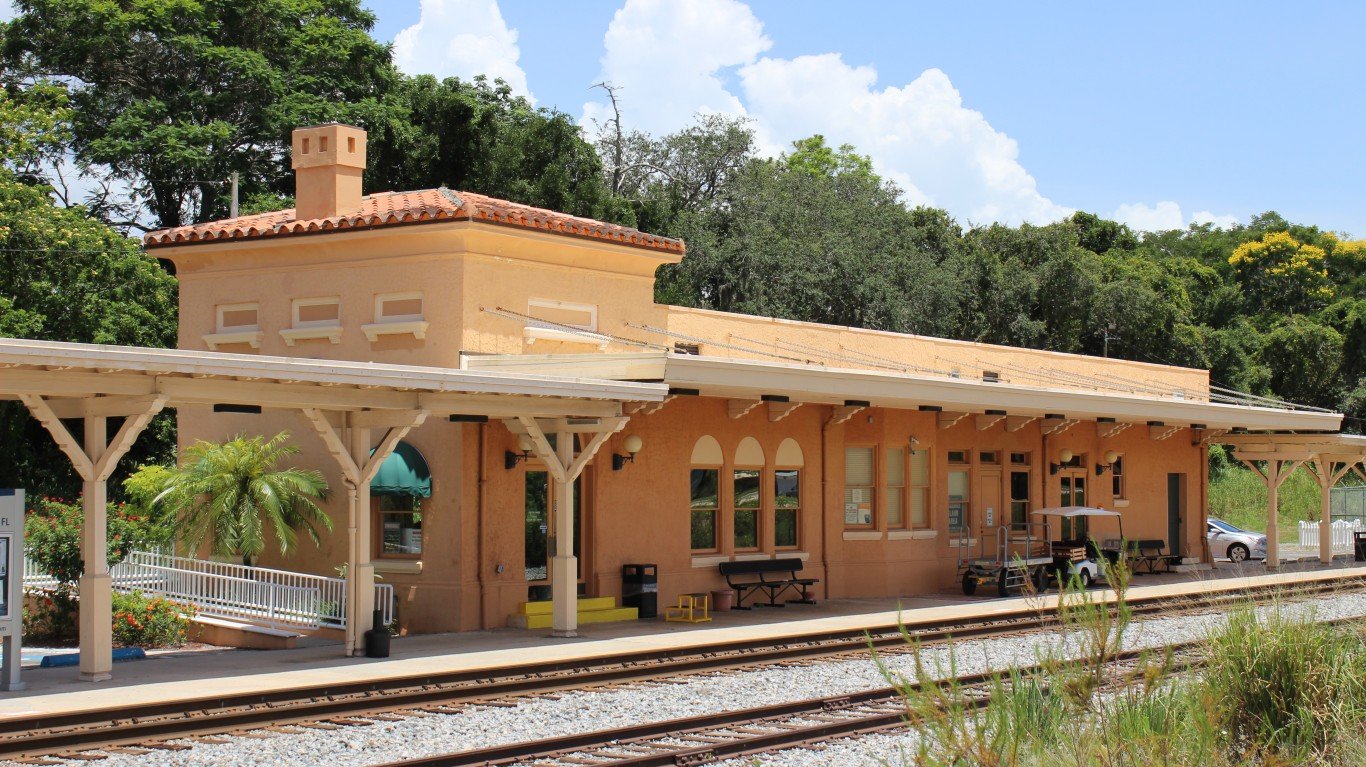
28. The Villages, FL
> Change in reported burglary rate, 2019-2020: -99.9
> Burglaries reported in 2020: 191 — 10th lowest of 200 metros
> Burglaries per 100K people in 2020: 139.3 — 15th lowest of 200 metros
> 1-yr. change in all property crime per 100K people: -151.7 — 81st highest of 188 metros
> Property crimes per 100K people in 2020: 705.3 — 2nd lowest of 190 metros
> Population: 132,420

27. Toledo, OH
> Change in reported burglary rate, 2019-2020: -104.2
> Burglaries reported in 2020: 2,337 — 39th highest of 200 metros
> Burglaries per 100K people in 2020: 365.2 — 80th highest of 200 metros
> 1-yr. change in all property crime per 100K people: -428.4 — 22nd lowest of 188 metros
> Property crimes per 100K people in 2020: 2,024.4 — 87th highest of 190 metros
> Population: 641,816
[in-text-ad-2]
26. Goldsboro, NC
> Change in reported burglary rate, 2019-2020: -104.4
> Burglaries reported in 2020: 758 — 92nd lowest of 200 metros
> Burglaries per 100K people in 2020: 615.4 — 12th highest of 200 metros
> 1-yr. change in all property crime per 100K people: -227.8 — 73rd lowest of 188 metros
> Property crimes per 100K people in 2020: 2,512.0 — 37th highest of 190 metros
> Population: 123,131

25. Lafayette, LA
> Change in reported burglary rate, 2019-2020: -104.5
> Burglaries reported in 2020: 2,523 — 34th highest of 200 metros
> Burglaries per 100K people in 2020: 514.9 — 29th highest of 200 metros
> 1-yr. change in all property crime per 100K people: -395.5 — 28th lowest of 188 metros
> Property crimes per 100K people in 2020: 2,487.4 — 39th highest of 190 metros
> Population: 489,207
[in-text-ad]

24. Monroe, LA
> Change in reported burglary rate, 2019-2020: -111.7
> Burglaries reported in 2020: 1,665 — 55th highest of 200 metros
> Burglaries per 100K people in 2020: 836.3 — 4th highest of 200 metros
> 1-yr. change in all property crime per 100K people: -506.8 — 13th lowest of 188 metros
> Property crimes per 100K people in 2020: 3,654.3 — 4th highest of 190 metros
> Population: 200,261
[recirclink id=1059954]

23. Anchorage, AK
> Change in reported burglary rate, 2019-2020: -112.6
> Burglaries reported in 2020: 1,488 — 63rd highest of 200 metros
> Burglaries per 100K people in 2020: 487.5 — 34th highest of 200 metros
> 1-yr. change in all property crime per 100K people: -914.3 — the lowest of 188 metros
> Property crimes per 100K people in 2020: 3,404.7 — 10th highest of 190 metros
> Population: 396,317

22. Tallahassee, FL
> Change in reported burglary rate, 2019-2020: -115.1
> Burglaries reported in 2020: 1,728 — 51st highest of 200 metros
> Burglaries per 100K people in 2020: 445.2 — 45th highest of 200 metros
> 1-yr. change in all property crime per 100K people: -703.9 — 4th lowest of 188 metros
> Property crimes per 100K people in 2020: 2,226.7 — 57th highest of 190 metros
> Population: 386,454
[in-text-ad-2]

21. Abilene, TX
> Change in reported burglary rate, 2019-2020: -117.2
> Burglaries reported in 2020: 568 — 70th lowest of 200 metros
> Burglaries per 100K people in 2020: 329.8 — 96th highest of 200 metros
> 1-yr. change in all property crime per 100K people: -312.3 — 47th lowest of 188 metros
> Property crimes per 100K people in 2020: 1,793.1 — 77th lowest of 190 metros
> Population: 171,795
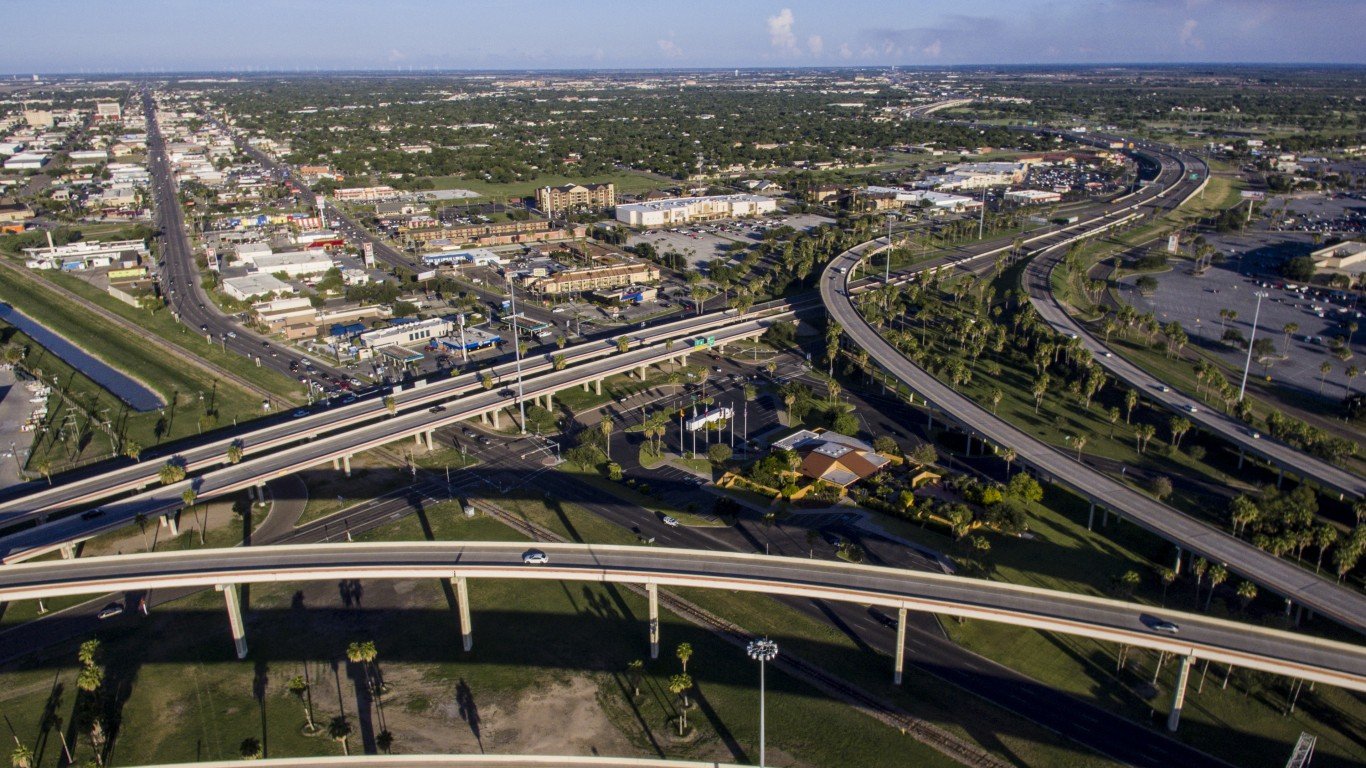
20. Brownsville-Harlingen, TX
> Change in reported burglary rate, 2019-2020: -119.4
> Burglaries reported in 2020: 1,165 — 81st highest of 200 metros
> Burglaries per 100K people in 2020: 275.1 — 79th lowest of 200 metros
> 1-yr. change in all property crime per 100K people: -578.1 — 6th lowest of 188 metros
> Property crimes per 100K people in 2020: 1,950.8 — 95th lowest of 190 metros
> Population: 423,163
[in-text-ad]

19. Greenville, NC
> Change in reported burglary rate, 2019-2020: -119.8
> Burglaries reported in 2020: 638 — 78th lowest of 200 metros
> Burglaries per 100K people in 2020: 350.3 — 85th highest of 200 metros
> 1-yr. change in all property crime per 100K people: -406.0 — 26th lowest of 188 metros
> Property crimes per 100K people in 2020: 2,012.3 — 89th highest of 190 metros
> Population: 180,742
[recirclink id=1066891]

18. Elmira, NY
> Change in reported burglary rate, 2019-2020: -126.9
> Burglaries reported in 2020: 131 — 3rd lowest of 200 metros
> Burglaries per 100K people in 2020: 159.1 — 21st lowest of 200 metros
> 1-yr. change in all property crime per 100K people: -122.2 — 72nd highest of 188 metros
> Property crimes per 100K people in 2020: 1,613.9 — 59th lowest of 190 metros
> Population: 83,456

17. Elizabethtown-Fort Knox, KY
> Change in reported burglary rate, 2019-2020: -127.1
> Burglaries reported in 2020: 279 — 26th lowest of 200 metros
> Burglaries per 100K people in 2020: 180.9 — 30th lowest of 200 metros
> 1-yr. change in all property crime per 100K people: -300.2 — 49th lowest of 188 metros
> Property crimes per 100K people in 2020: 833.8 — 4th lowest of 190 metros
> Population: 154,713
[in-text-ad-2]

16. Stockton, CA
> Change in reported burglary rate, 2019-2020: -130.5
> Burglaries reported in 2020: 2,817 — 28th highest of 200 metros
> Burglaries per 100K people in 2020: 369.1 — 78th highest of 200 metros
> 1-yr. change in all property crime per 100K people: -503.4 — 14th lowest of 188 metros
> Property crimes per 100K people in 2020: 2,332.8 — 49th highest of 190 metros
> Population: 762,148

15. Bakersfield, CA
> Change in reported burglary rate, 2019-2020: -139.3
> Burglaries reported in 2020: 6,358 — 14th highest of 200 metros
> Burglaries per 100K people in 2020: 708.1 — 5th highest of 200 metros
> 1-yr. change in all property crime per 100K people: -196.7 — 81st lowest of 188 metros
> Property crimes per 100K people in 2020: 3,106.0 — 13th highest of 190 metros
> Population: 900,202
[in-text-ad]

14. Lake Havasu City-Kingman, AZ
> Change in reported burglary rate, 2019-2020: -141.1
> Burglaries reported in 2020: 889 — 94th highest of 200 metros
> Burglaries per 100K people in 2020: 414.2 — 55th highest of 200 metros
> 1-yr. change in all property crime per 100K people: -475.5 — 18th lowest of 188 metros
> Property crimes per 100K people in 2020: 2,163.3 — 63rd highest of 190 metros
> Population: 212,181
[recirclink id=1023032]

13. Modesto, CA
> Change in reported burglary rate, 2019-2020: -145.8
> Burglaries reported in 2020: 1,825 — 49th highest of 200 metros
> Burglaries per 100K people in 2020: 332.3 — 95th highest of 200 metros
> 1-yr. change in all property crime per 100K people: -622.7 — 5th lowest of 188 metros
> Property crimes per 100K people in 2020: 1,974.3 — 94th highest of 190 metros
> Population: 550,660

12. Panama City, FL
> Change in reported burglary rate, 2019-2020: -146.4
> Burglaries reported in 2020: 775 — 94th lowest of 200 metros
> Burglaries per 100K people in 2020: 443.2 — 46th highest of 200 metros
> 1-yr. change in all property crime per 100K people: -421.7 — 23rd lowest of 188 metros
> Property crimes per 100K people in 2020: 2,645.6 — 30th highest of 190 metros
> Population: 174,705
[in-text-ad-2]

11. Vineland-Bridgeton, NJ
> Change in reported burglary rate, 2019-2020: -146.4
> Burglaries reported in 2020: 593 — 73rd lowest of 200 metros
> Burglaries per 100K people in 2020: 399.1 — 60th highest of 200 metros
> 1-yr. change in all property crime per 100K people: -557.2 — 7th lowest of 188 metros
> Property crimes per 100K people in 2020: 2,148.1 — 70th highest of 190 metros
> Population: 149,527
10. Burlington, NC
> Change in reported burglary rate, 2019-2020: -160.1
> Burglaries reported in 2020: 738 — 89th lowest of 200 metros
> Burglaries per 100K people in 2020: 429.9 — 50th highest of 200 metros
> 1-yr. change in all property crime per 100K people: -268.8 — 64th lowest of 188 metros
> Property crimes per 100K people in 2020: 2,370.9 — 45th highest of 190 metros
> Population: 169,509
[in-text-ad]

9. New Bern, NC
> Change in reported burglary rate, 2019-2020: -175.5
> Burglaries reported in 2020: 657 — 81st lowest of 200 metros
> Burglaries per 100K people in 2020: 530.0 — 25th highest of 200 metros
> 1-yr. change in all property crime per 100K people: -214.8 — 74th lowest of 188 metros
> Property crimes per 100K people in 2020: 2,150.8 — 69th highest of 190 metros
> Population: 127,904
[recirclink id=1030620]

8. Sioux City, IA-NE-SD
> Change in reported burglary rate, 2019-2020: -176.0
> Burglaries reported in 2020: 569 — 71st lowest of 200 metros (tied)
> Burglaries per 100K people in 2020: 393.7 — 64th highest of 200 metros
> 1-yr. change in all property crime per 100K people: -500.3 — 15th lowest of 188 metros
> Property crimes per 100K people in 2020: 2,301.4 — 51st highest of 190 metros
> Population: 144,670

7. Las Vegas-Henderson-Paradise, NV
> Change in reported burglary rate, 2019-2020: -197.6
> Burglaries reported in 2020: 8,683 — 7th highest of 200 metros
> Burglaries per 100K people in 2020: 375.2 — 73rd highest of 200 metros
> 1-yr. change in all property crime per 100K people: -517.5 — 11th lowest of 188 metros
> Property crimes per 100K people in 2020: 2,046.5 — 84th highest of 190 metros
> Population: 2,266,715
[in-text-ad-2]
6. Sebring-Avon Park, FL
> Change in reported burglary rate, 2019-2020: -205.5
> Burglaries reported in 2020: 333 — 33rd lowest of 200 metros
> Burglaries per 100K people in 2020: 311.8 — 99th lowest of 200 metros
> 1-yr. change in all property crime per 100K people: -449.0 — 21st lowest of 188 metros
> Property crimes per 100K people in 2020: 1,769.0 — 73rd lowest of 190 metros
> Population: 106,221

5. Madera, CA
> Change in reported burglary rate, 2019-2020: -208.3
> Burglaries reported in 2020: 353 — 38th lowest of 200 metros
> Burglaries per 100K people in 2020: 225.6 — 56th lowest of 200 metros
> 1-yr. change in all property crime per 100K people: -350.6 — 37th lowest of 188 metros
> Property crimes per 100K people in 2020: 1,362.6 — 41st lowest of 190 metros
> Population: 157,327
[in-text-ad]

4. Vallejo, CA
> Change in reported burglary rate, 2019-2020: -218.3
> Burglaries reported in 2020: 2,751 — 30th highest of 200 metros
> Burglaries per 100K people in 2020: 615.4 — 13th highest of 200 metros
> 1-yr. change in all property crime per 100K people: -552.7 — 8th lowest of 188 metros
> Property crimes per 100K people in 2020: 2,391.1 — 44th highest of 190 metros
> Population: 447,643
[recirclink id=1020198]

3. Lawton, OK
> Change in reported burglary rate, 2019-2020: -232.2
> Burglaries reported in 2020: 723 — 87th lowest of 200 metros
> Burglaries per 100K people in 2020: 574.4 — 18th highest of 200 metros
> 1-yr. change in all property crime per 100K people: -804.5 — 3rd lowest of 188 metros
> Property crimes per 100K people in 2020: 1,861.6 — 85th lowest of 190 metros
> Population: 126,043

2. Sumter, SC
> Change in reported burglary rate, 2019-2020: -252.2
> Burglaries reported in 2020: 742 — 90th lowest of 200 metros
> Burglaries per 100K people in 2020: 528.5 — 26th highest of 200 metros
> 1-yr. change in all property crime per 100K people: -407.1 — 25th lowest of 188 metros
> Property crimes per 100K people in 2020: 2,743.6 — 24th highest of 190 metros
> Population: 140,466
[in-text-ad-2]
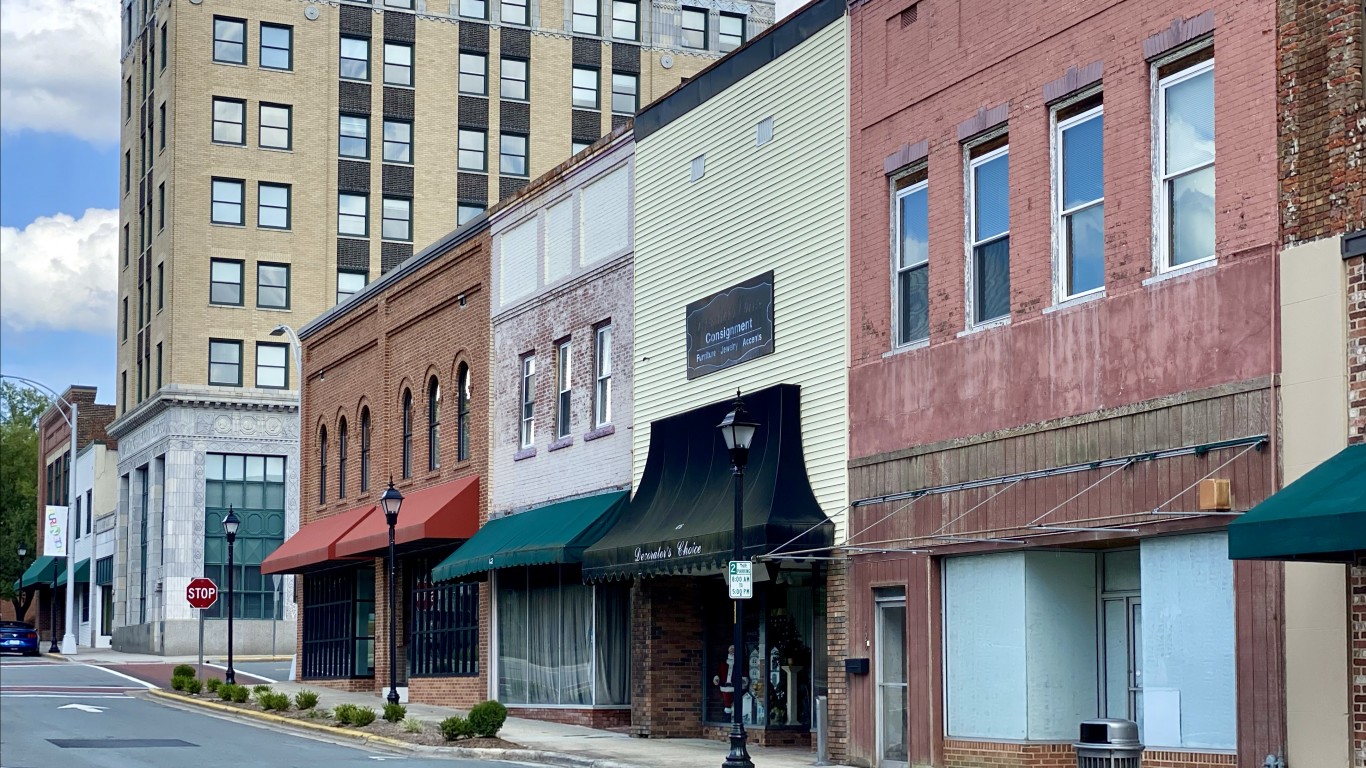
1. Florence, SC
> Change in reported burglary rate, 2019-2020: -276.4
> Burglaries reported in 2020: 1,379 — 69th highest of 200 metros
> Burglaries per 100K people in 2020: 672.5 — 7th highest of 200 metros
> 1-yr. change in all property crime per 100K people: -458.4 — 20th lowest of 188 metros
> Property crimes per 100K people in 2020: 3,600.8 — 5th highest of 190 metros
> Population: 204,911
Methodology
To determine the metro area where the burglary rate is falling fastest, 24/7 Wall St. reviewed the change in the number of burglaries per 100,000 people from the FBI’s 2019 and 2020 Uniform Crime Reports. Crime rates were calculated using population figures provided by the FBI in the 2020 and 2019 UCR.
Limited data was available in the 2020 UCR for areas in Alabama, Maryland, Pennsylvania, and Illinois, though metro areas in these states were not excluded from analysis. Only metro areas for which the boundaries defined by the FBI match the boundaries as defined by the U.S. Census Bureau were considered. Because some state and local agencies changed reporting practices between 2019 and 2020, the figures are not comparable, and the areas were excluded.
Population figures are five-year estimates from the U.S. Census Bureau’s 2019 American Community Survey.
Contact [email protected] for any questions or corrections.