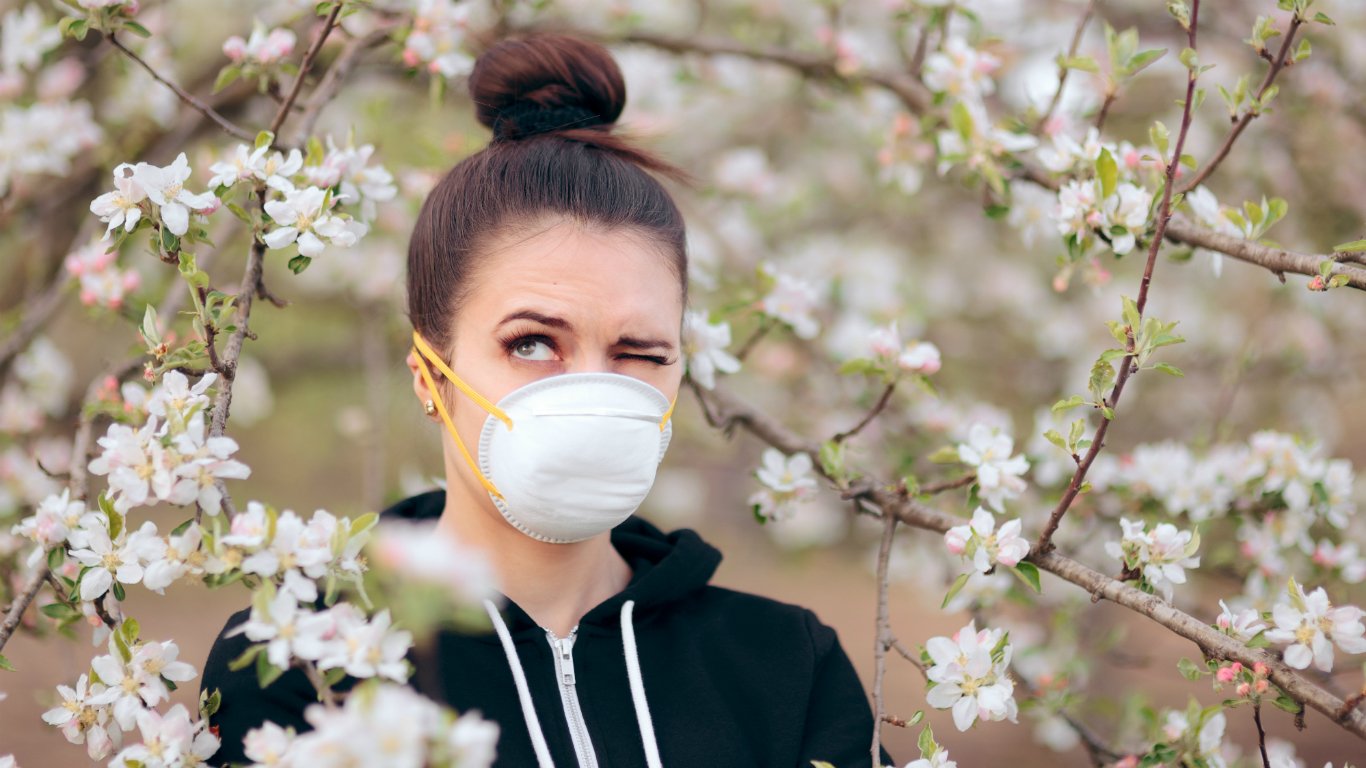
With temperatures rising, birds chirping, and flowers blooming, it may feel like spring is in the air. For many people, the advent of spring is a cause for celebration, yet for others, it also means the onset of seasonal allergies.
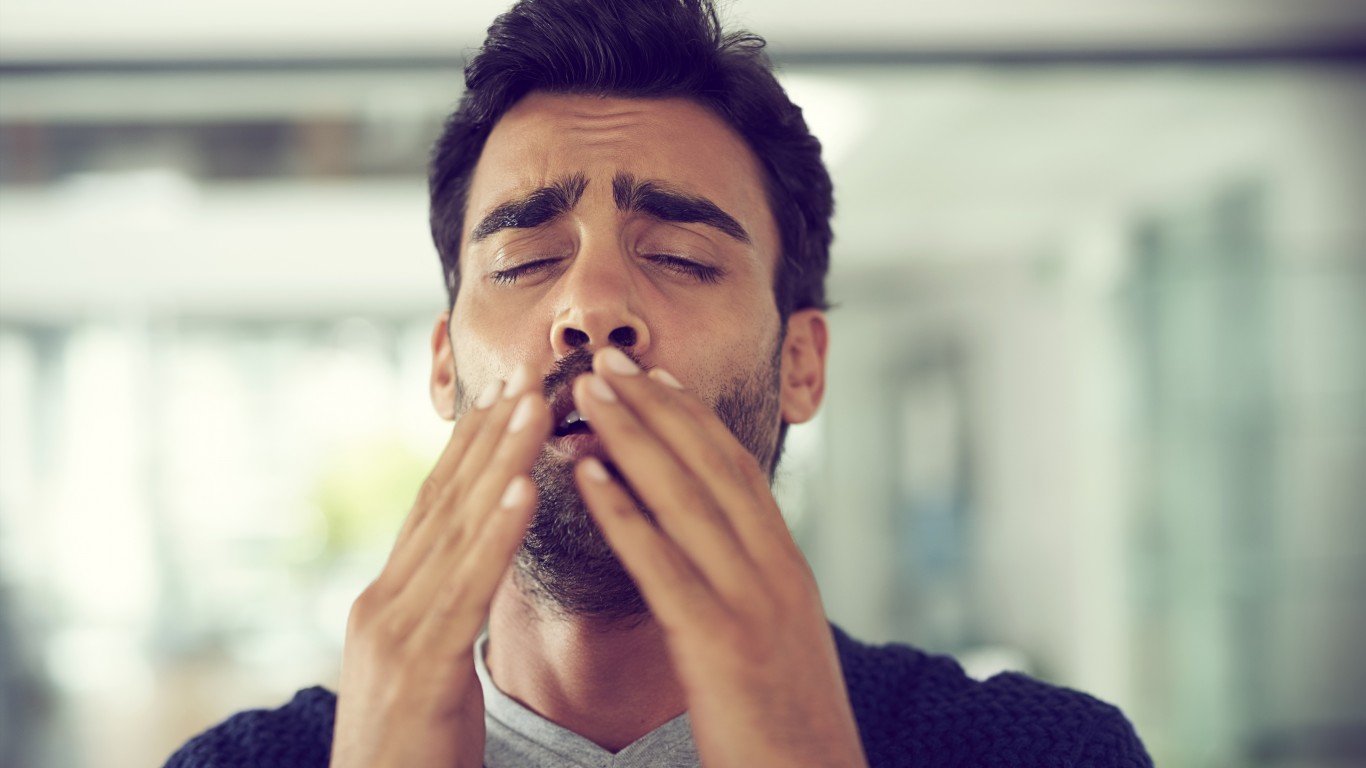
Over 50 million people in the United States suffer from some type of allergy. The most common type is seasonal allergic rhinitis (also called seasonal allergies or hay fever,) which is characterized by nasal congestion, sneezing, itchy eyes, and a host of other unpleasant symptoms.
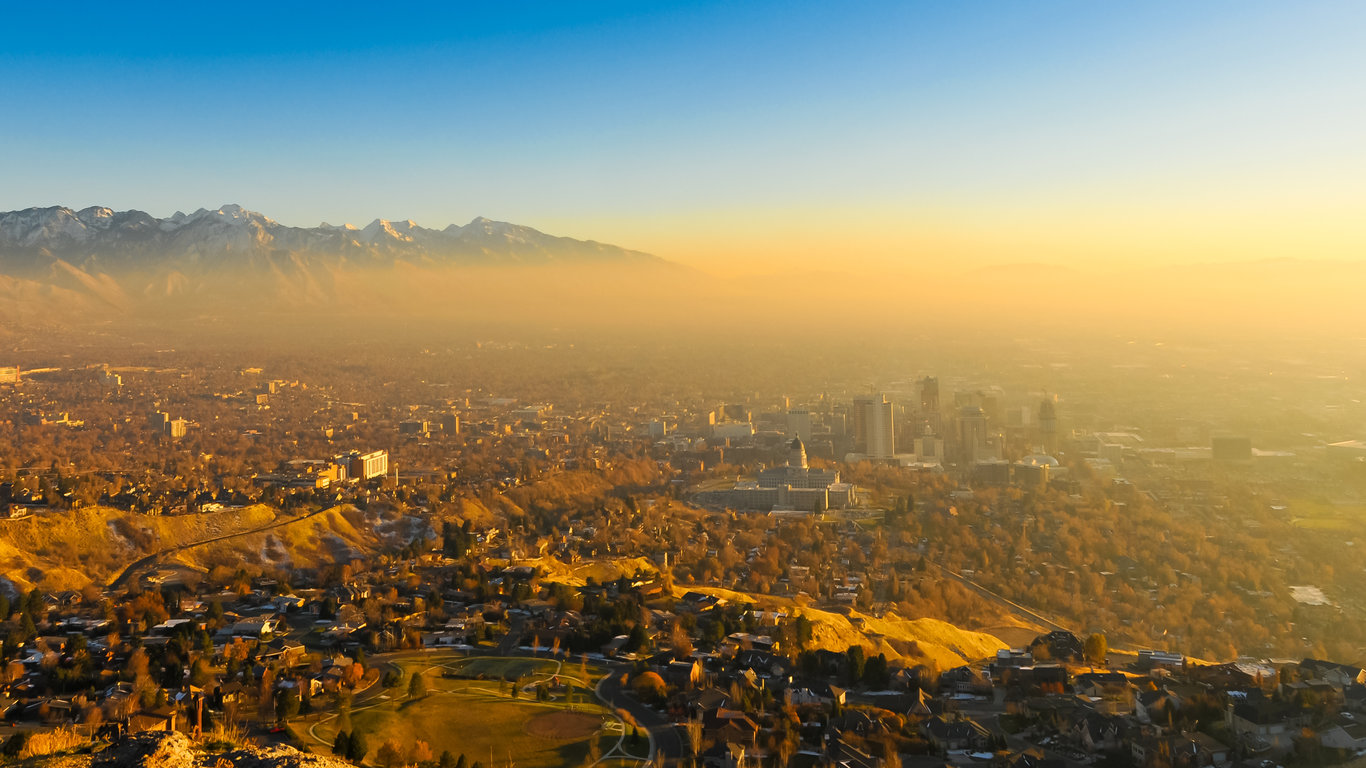
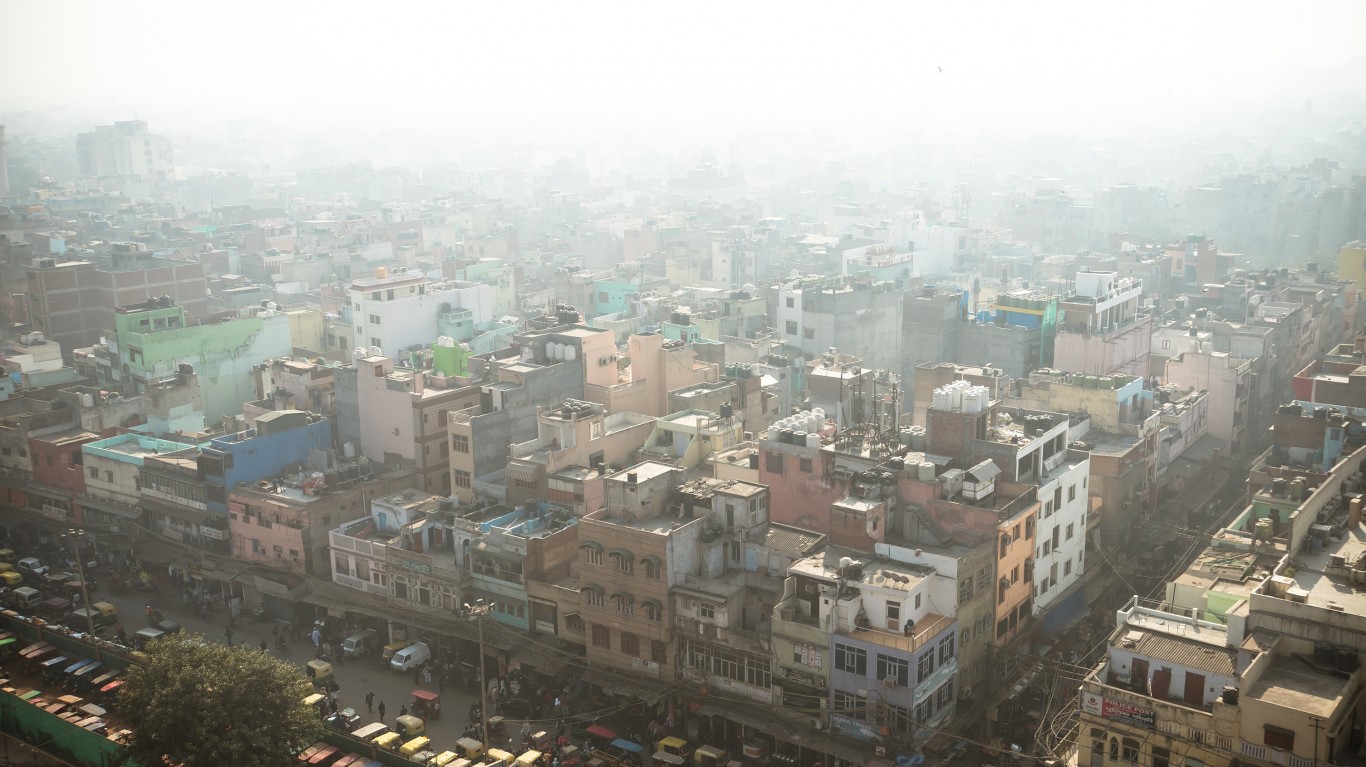
Seasonal allergies are caused by sensitivity to certain airborne pollens, and are exacerbated by air pollution from ozone, nitrogen dioxide, and fine particulate matter. (They tend to be caused by different factors in the fall than in the spring. These are the cities where people struggle most with fall allergies.)
To determine the worst cities for people with spring allergies, 24/7 Tempo reviewed data from the Asthma and Allergy Foundation of America’s 2022 Allergy Capitals report. The report ranked the 100 largest metro areas in the continental U.S. by population, based on an index of the population in each area at risk of being affected by airborne allergenic pollen in spring of 2022. The index is based on actual pollen counts and allergy prevalence by pollen type, as well as data on per capita sales of over-the-counter sinus and allergy medication and prevalence of board-certified allergists and immunologists per capita.
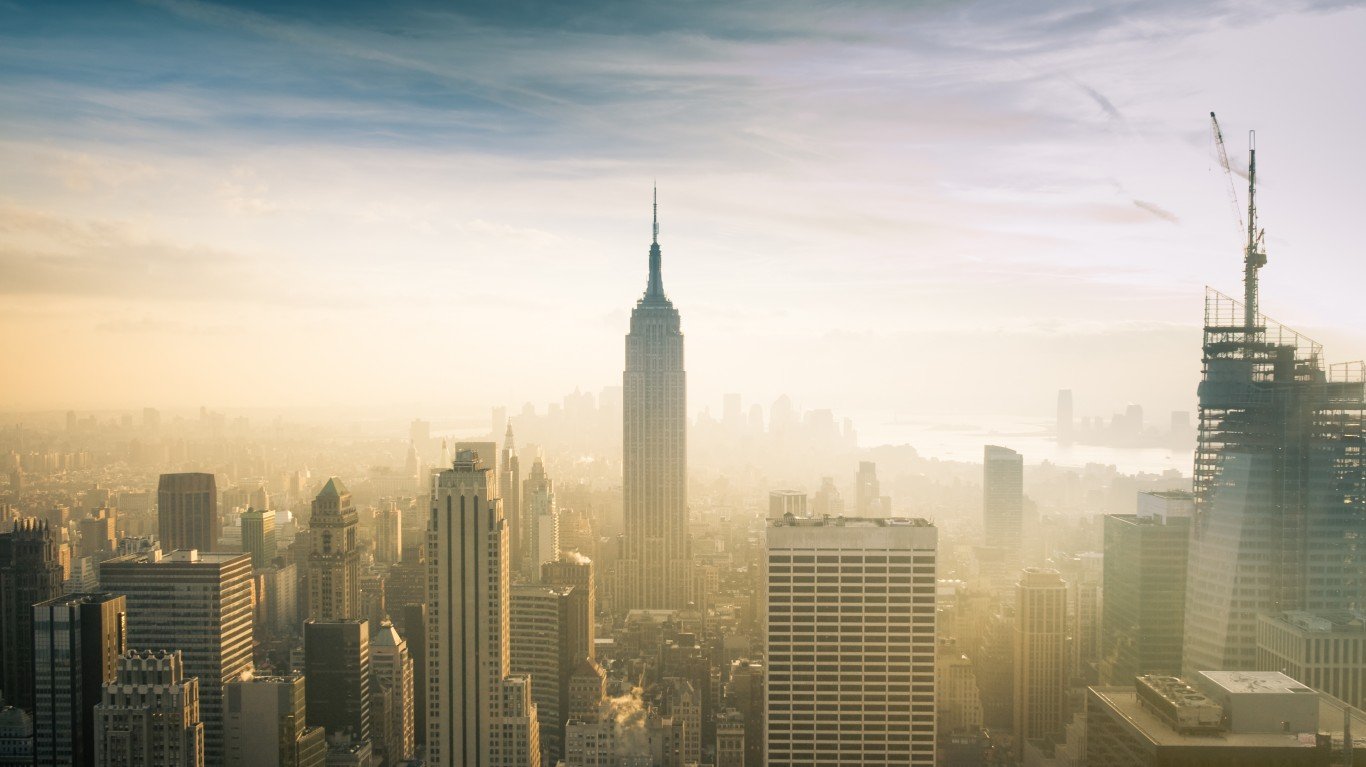
Current research suggests that air pollution causes increased rates of asthma and seasonal allergies, so along with the ranking, we have included fine particulate matter pollution (PM2.5) averages and nitrogen dioxide (NO) concentrations. Data on both comes from the Environmental Protection Agency’s Air Quality Statistics Report for 2020. (Population figures come from the U.S. Census Bureau’s 2020 American Community Survey and are five-year estimates.)
These are the 25 worst cities for people with spring allergies
In addition to contributing to particle pollution and the formation of ozone, nitrogen dioxide increases inflammation in the lungs and airways, reducing lung function and exacerbating allergy symptoms. It is a major factor in the formation of asthma. Studies also show that the allergens contained in certain pollens can increase in the presence of nitrogen dioxide, making spring allergies all the worse in areas with higher concentrations of nitrogen dioxide pollution. (Air pollution indoors can be a problem, too. Here’s how to improve the air quality at home.)
Of the 25 worst cities for people with spring allergies, a majority of them are in the South and East, with a few in the Midwest and a single Southwestern outlier. Tree pollen is one of the most prevalent allergens, and in the South, trees may start producing pollen as early as January. Common culprits include mulberry, oak, pecan, cottonwood, and beech trees.
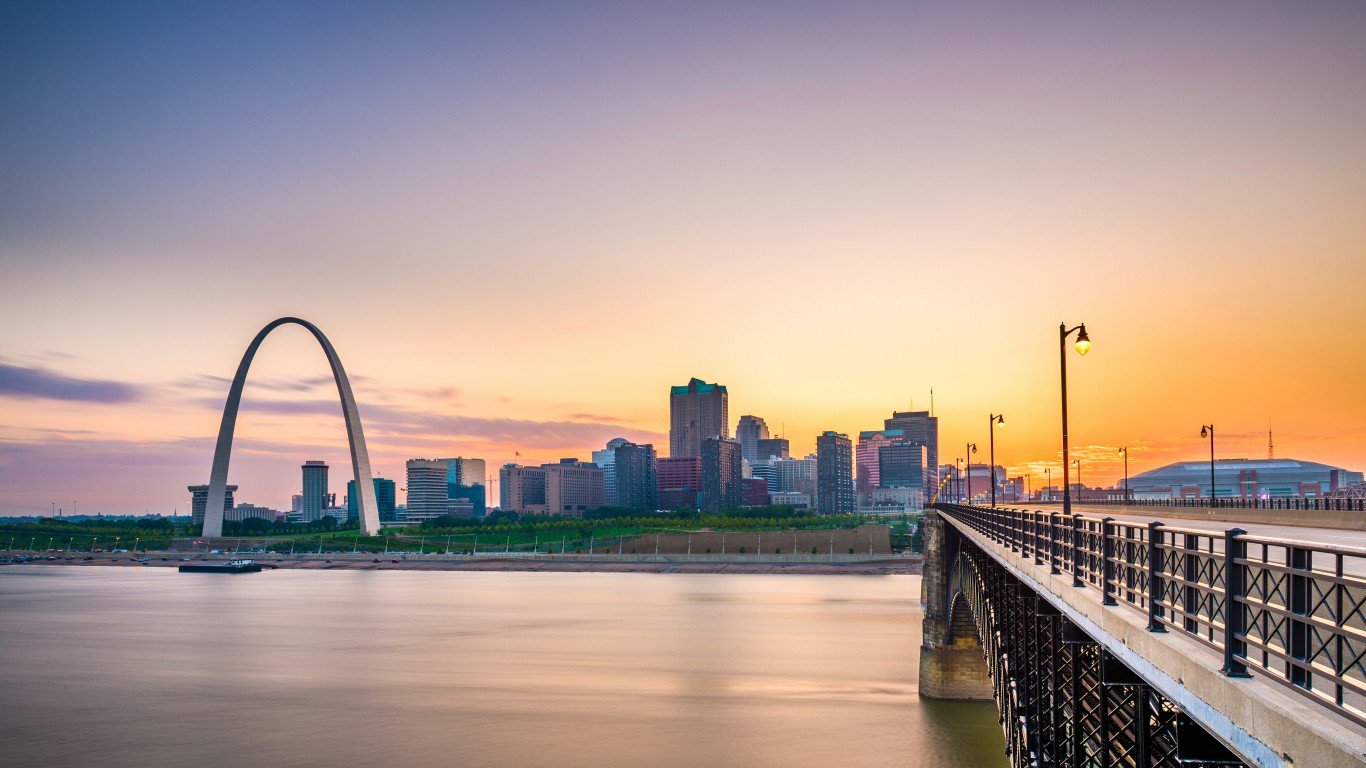
25. St. Louis, MO
> Fine particulate matter pollution 24-hr average: 26 µg/m3 (EPA standard: 35 µg/m3)
> Avg. nitrogen dioxide concentration: 10 ppb (EPA standard: 53 ppb)
> Total population: 2,806,349
> Fall 2022 allergy ranking: #36 out of 100
[in-text-ad]
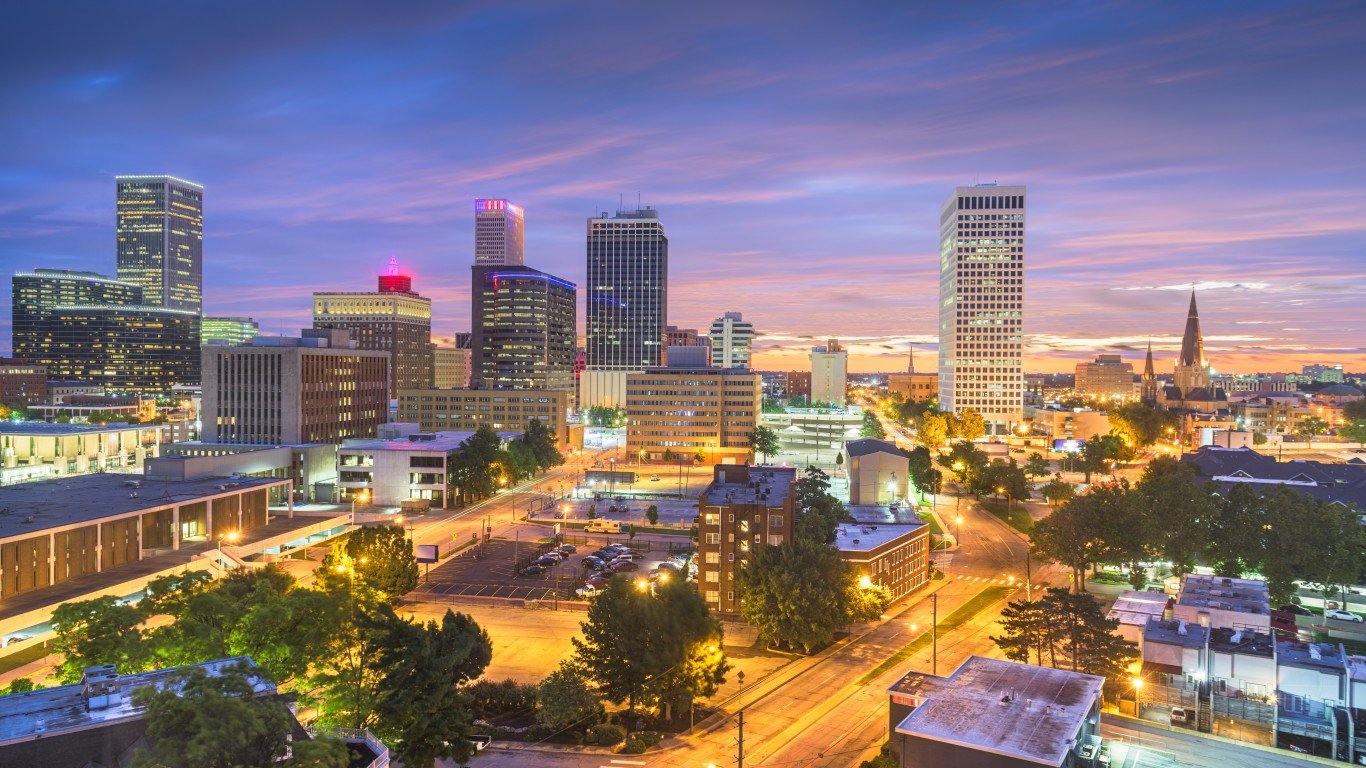
24. Tulsa, OK
> Fine particulate matter pollution 24-hr average: 20 µg/m3 (EPA standard: 35 µg/m3)
> Avg. nitrogen dioxide concentration: 6 ppb (EPA standard: 53 ppb)
> Total population: 996,141
> Fall 2022 allergy ranking: #21 out of 100
[recirclink id=987949]
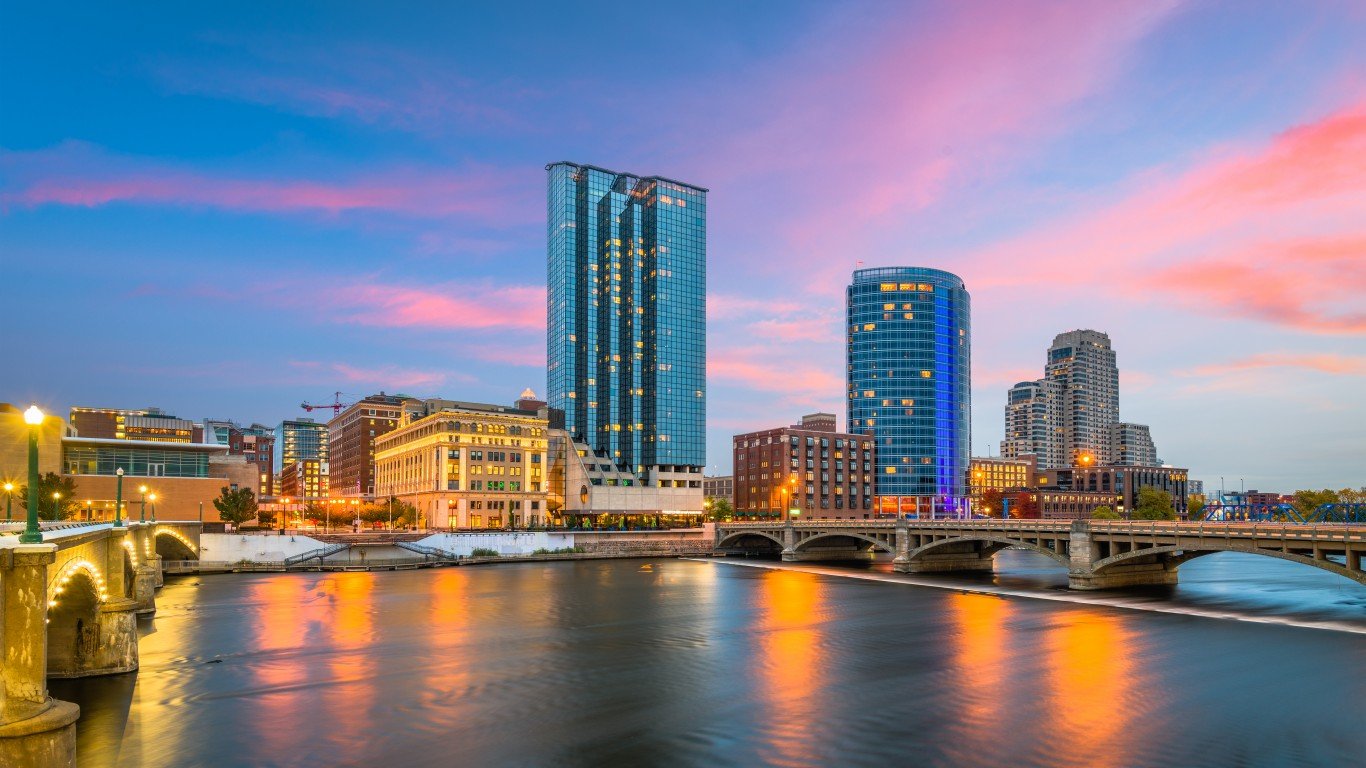
23. Grand Rapids, MI
> Fine particulate matter pollution 24-hr average: 18 µg/m3 (EPA standard: 35 µg/m3)
> Avg. nitrogen dioxide concentration: 5 ppb (EPA standard: 53 ppb)
> Total population: 1,069,696
> Fall 2022 allergy ranking: #25 out of 100
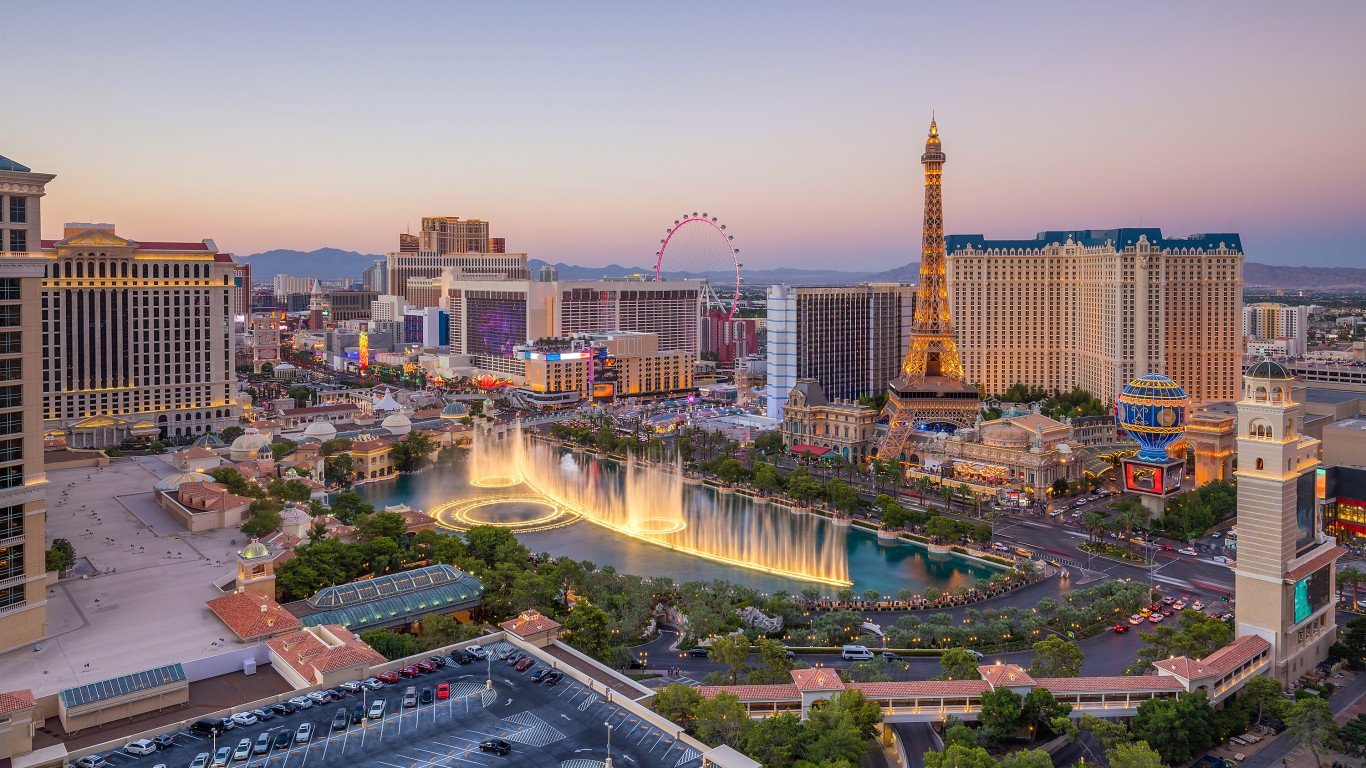
22. Las Vegas, NV
> Fine particulate matter pollution 24-hr average: 33 µg/m3 (EPA standard: 35 µg/m3)
> Avg. nitrogen dioxide concentration: 23 ppb (EPA standard: 53 ppb)
> Total population: 2,228,866
> Fall 2022 allergy ranking: #20 out of 100
[in-text-ad-2]
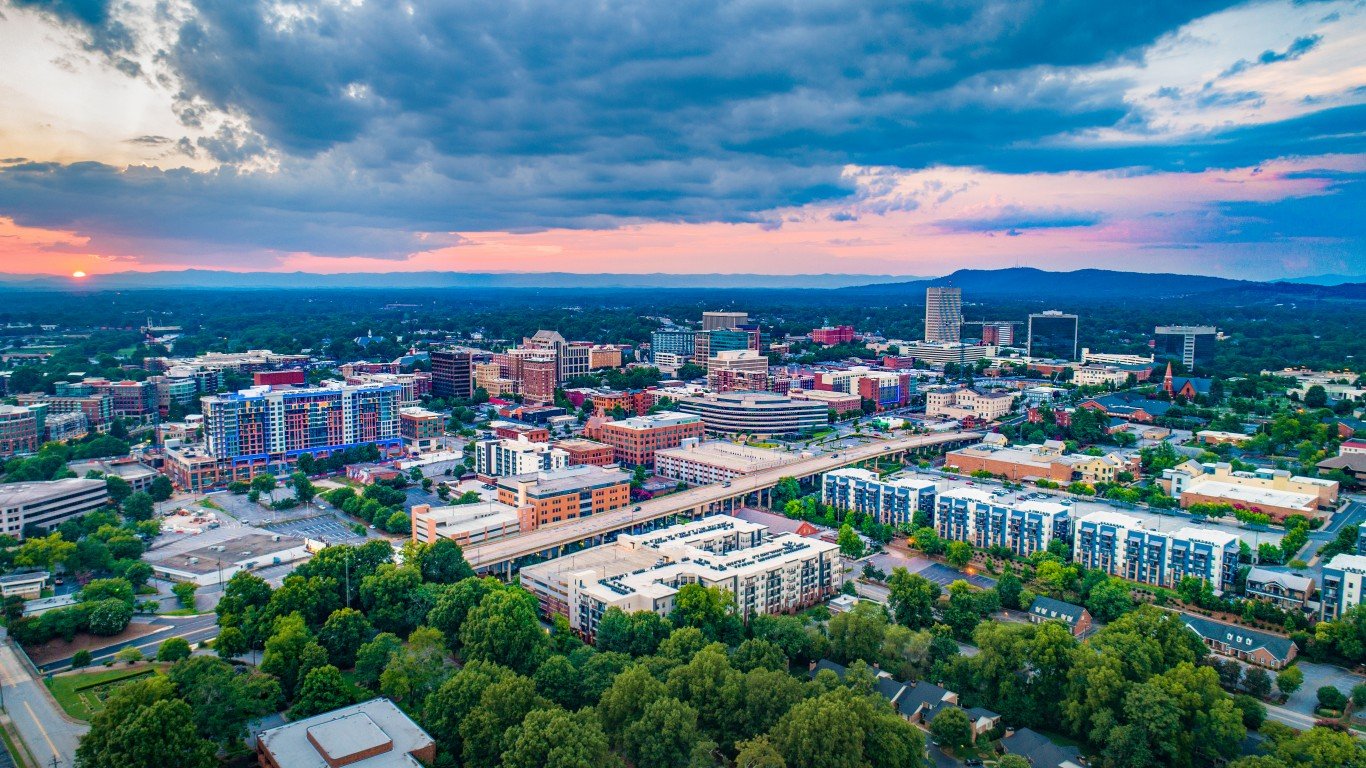
21. Greenville, SC
> Fine particulate matter pollution 24-hr average: 20 µg/m3 (EPA standard: 35 µg/m3)
> Avg. nitrogen dioxide concentration: 6 ppb (EPA standard: 53 ppb)
> Total population: 908,680
> Fall 2022 allergy ranking: #28 out of 100
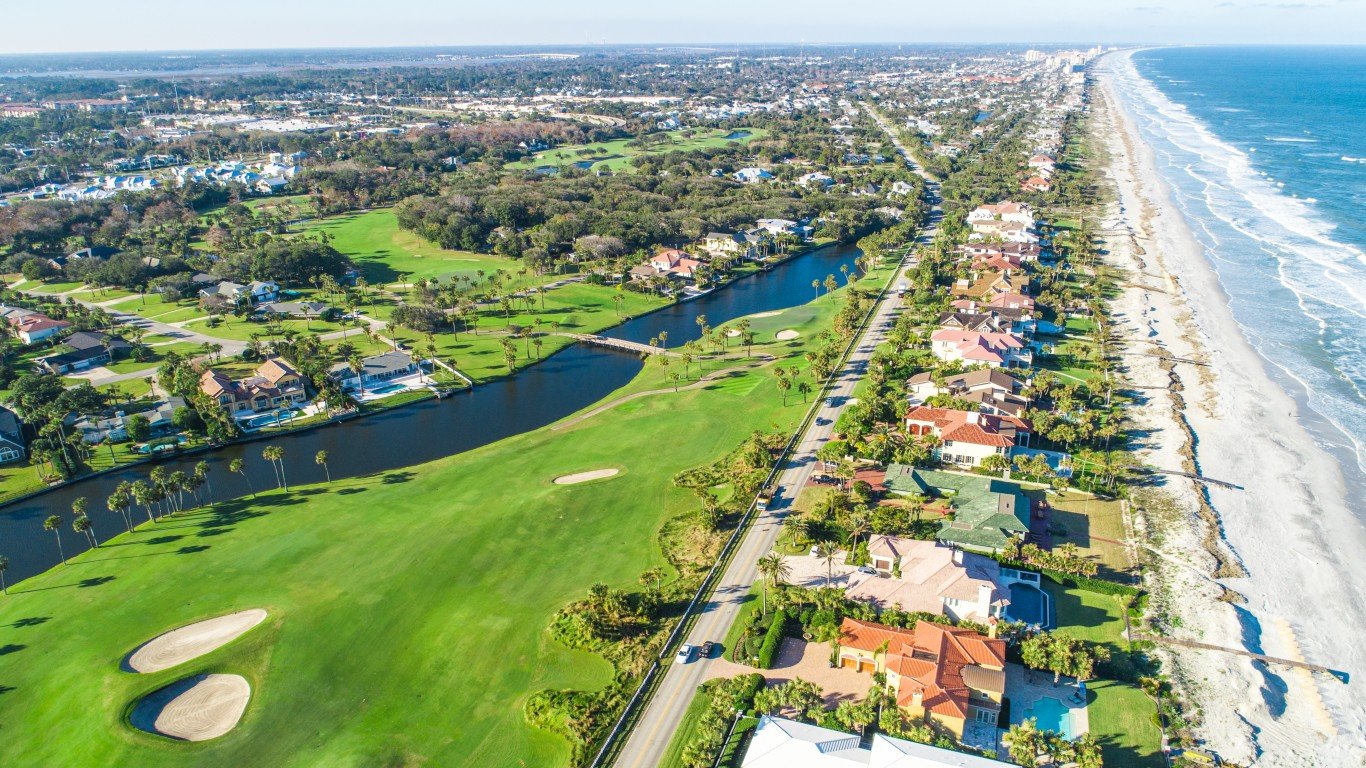
20. Jacksonville, FL
> Fine particulate matter pollution 24-hr average: 18 µg/m3 (EPA standard: 35 µg/m3)
> Avg. nitrogen dioxide concentration: 10 ppb (EPA standard: 53 ppb)
> Total population: 1,533,796
> Fall 2022 allergy ranking: #26 out of 100
[in-text-ad]
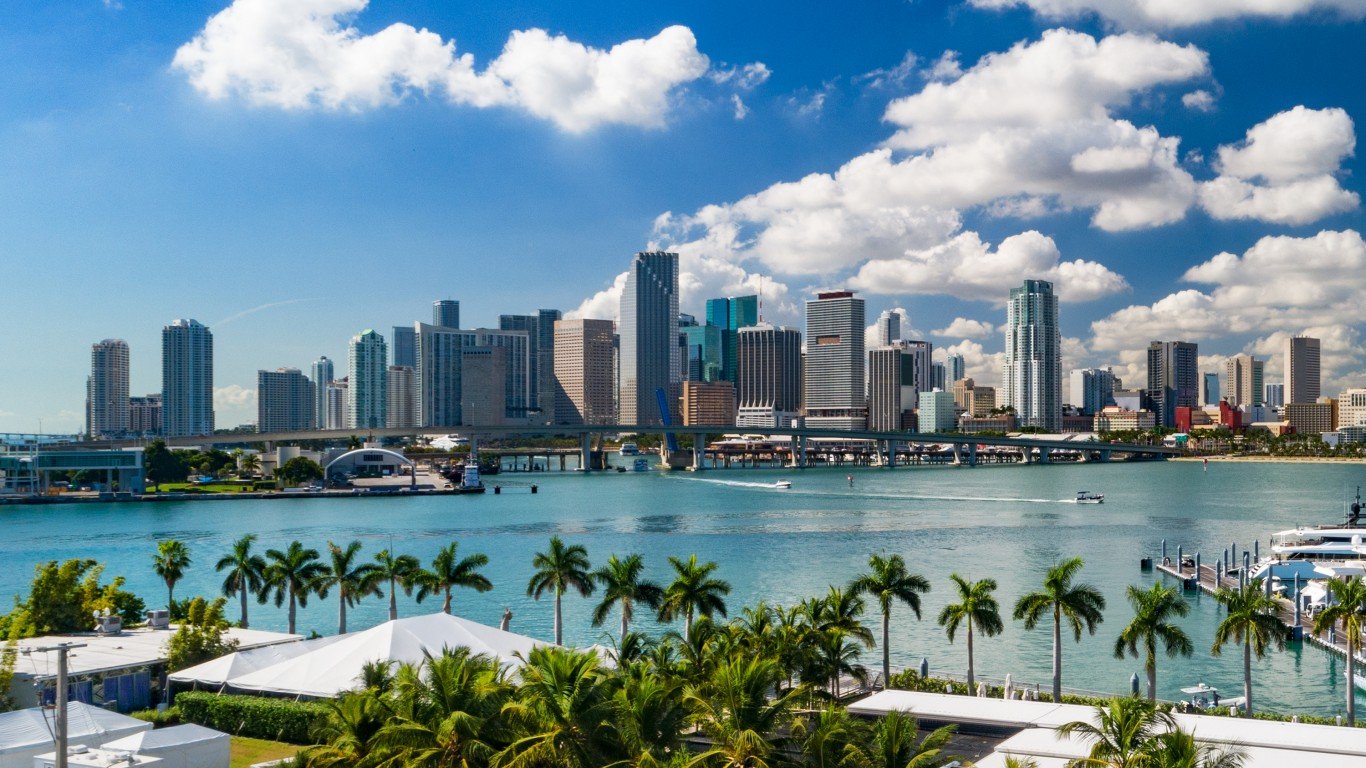
19. Miami, FL
> Fine particulate matter pollution 24-hr average: 21 µg/m3 (EPA standard: 35 µg/m3)
> Avg. nitrogen dioxide concentration: 13 ppb (EPA standard: 53 ppb)
> Total population: 6,129,858
> Fall 2022 allergy ranking: #18 out of 100
[recirclink id=838810]
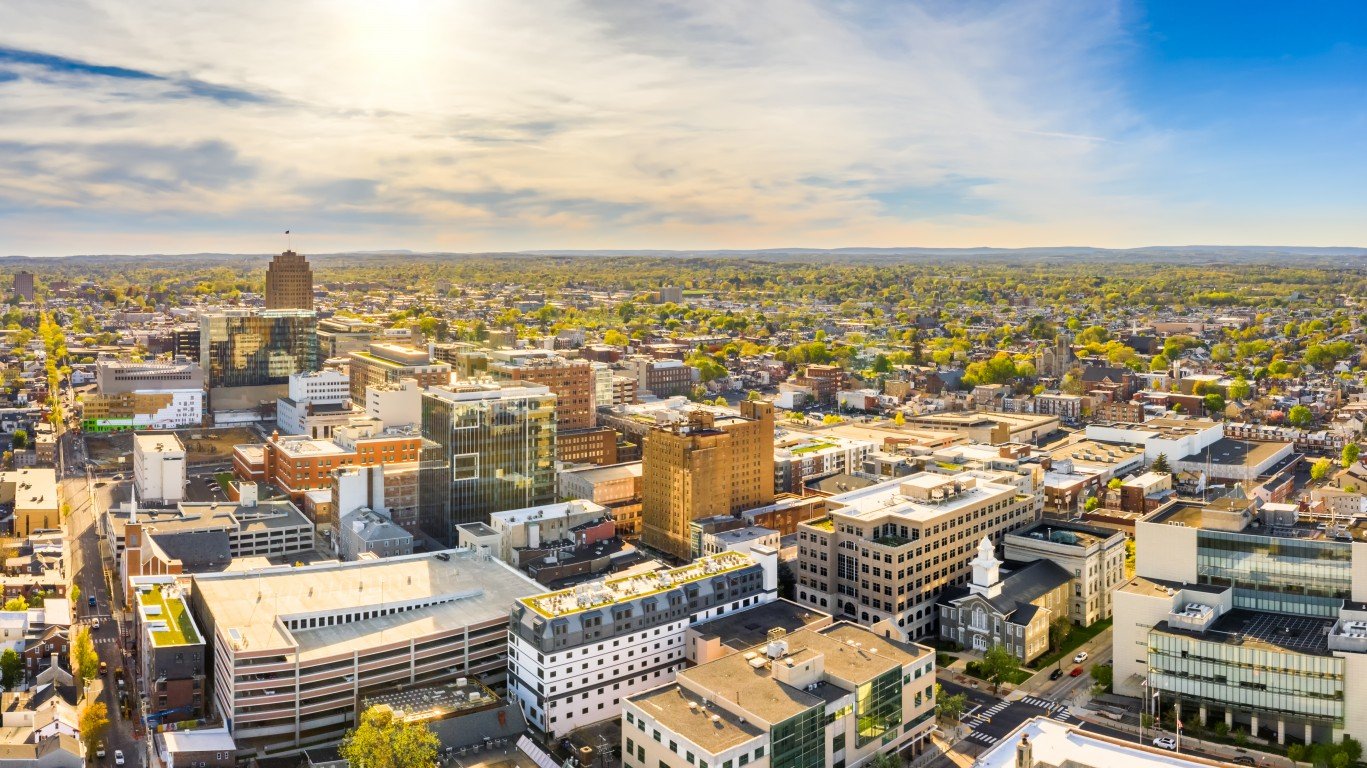
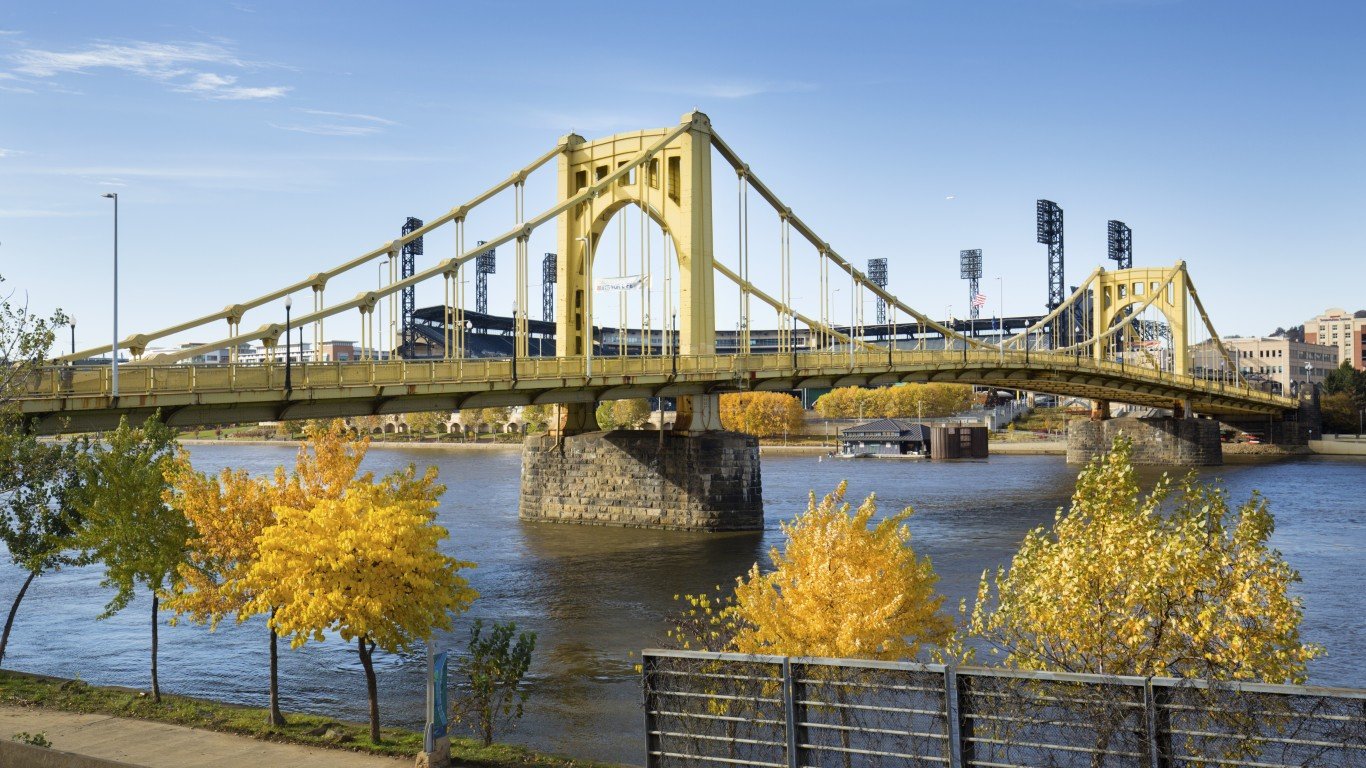
18. Allentown, PA
> Fine particulate matter pollution 24-hr average: 18 µg/m3 (EPA standard: 35 µg/m3)
> Avg. nitrogen dioxide concentration: 10 ppb (EPA standard: 53 ppb)
> Total population: 841,265
> Fall 2022 allergy ranking: #30 out of 100
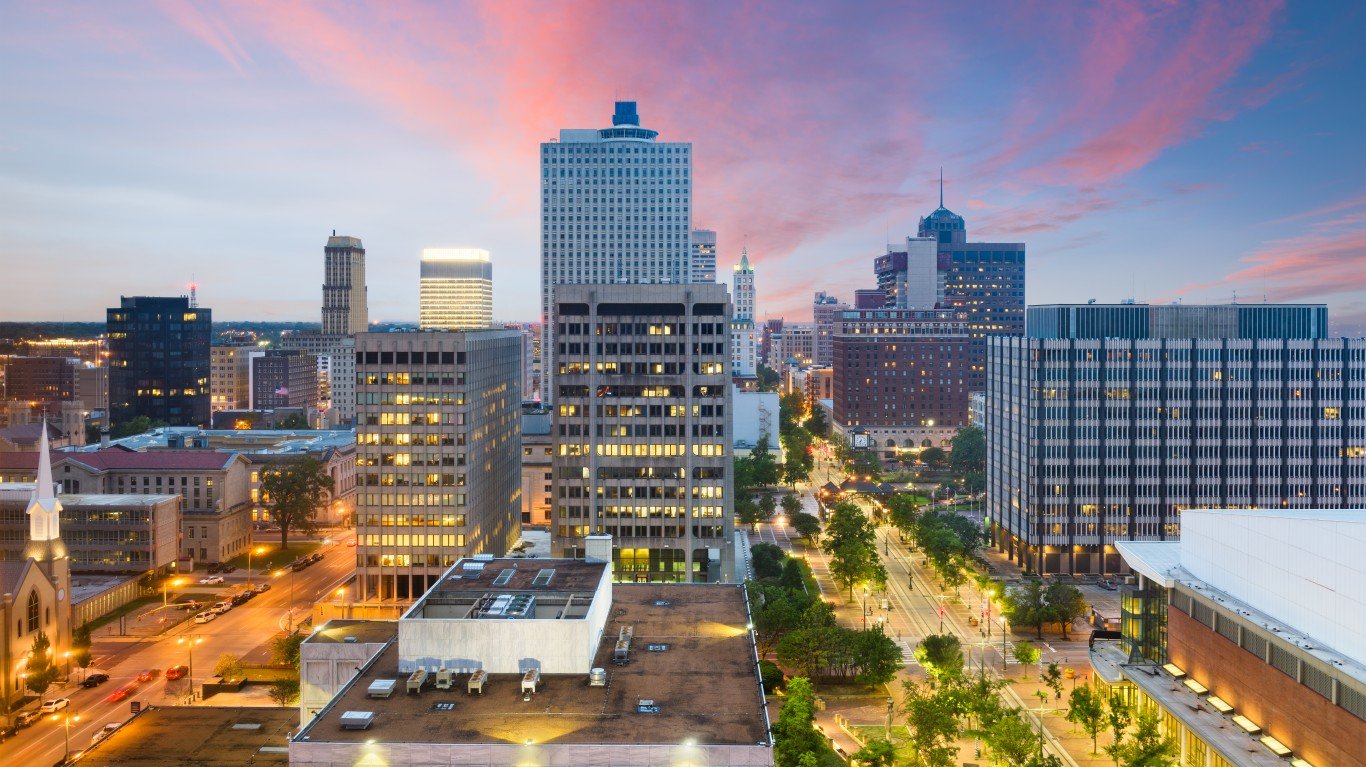
17. Memphis, TN
> Fine particulate matter pollution 24-hr average: 20 µg/m3 (EPA standard: 35 µg/m3)
> Avg. nitrogen dioxide concentration: 10 ppb (EPA standard: 53 ppb)
> Total population: 1,343,150
> Fall 2022 allergy ranking: #19 out of 100
[in-text-ad-2]
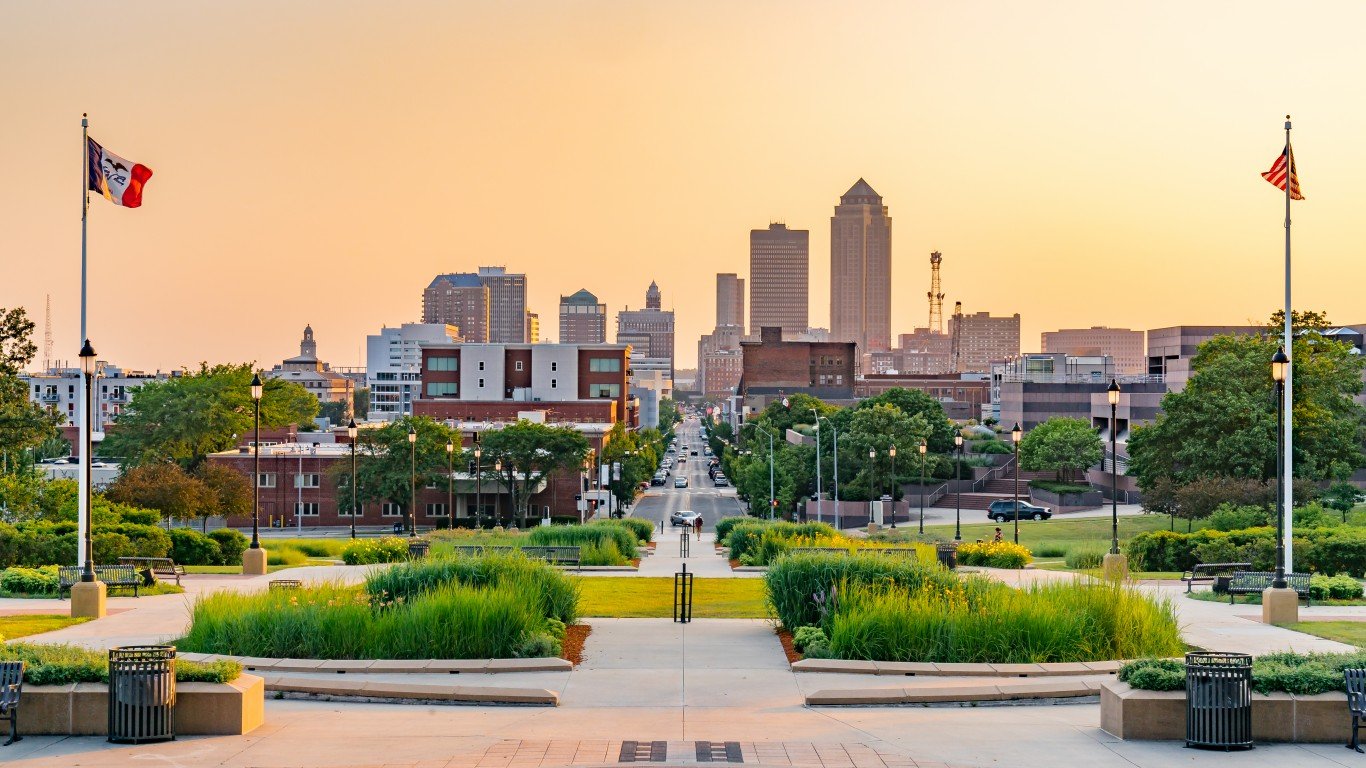
16. Des Moines, IA
> Fine particulate matter pollution 24-hr average: 17 µg/m3 (EPA standard: 35 µg/m3)
> Avg. nitrogen dioxide concentration: 6 ppb (EPA standard: 53 ppb)
> Total population: 690,585
> Fall 2022 allergy ranking: #17 out of 100
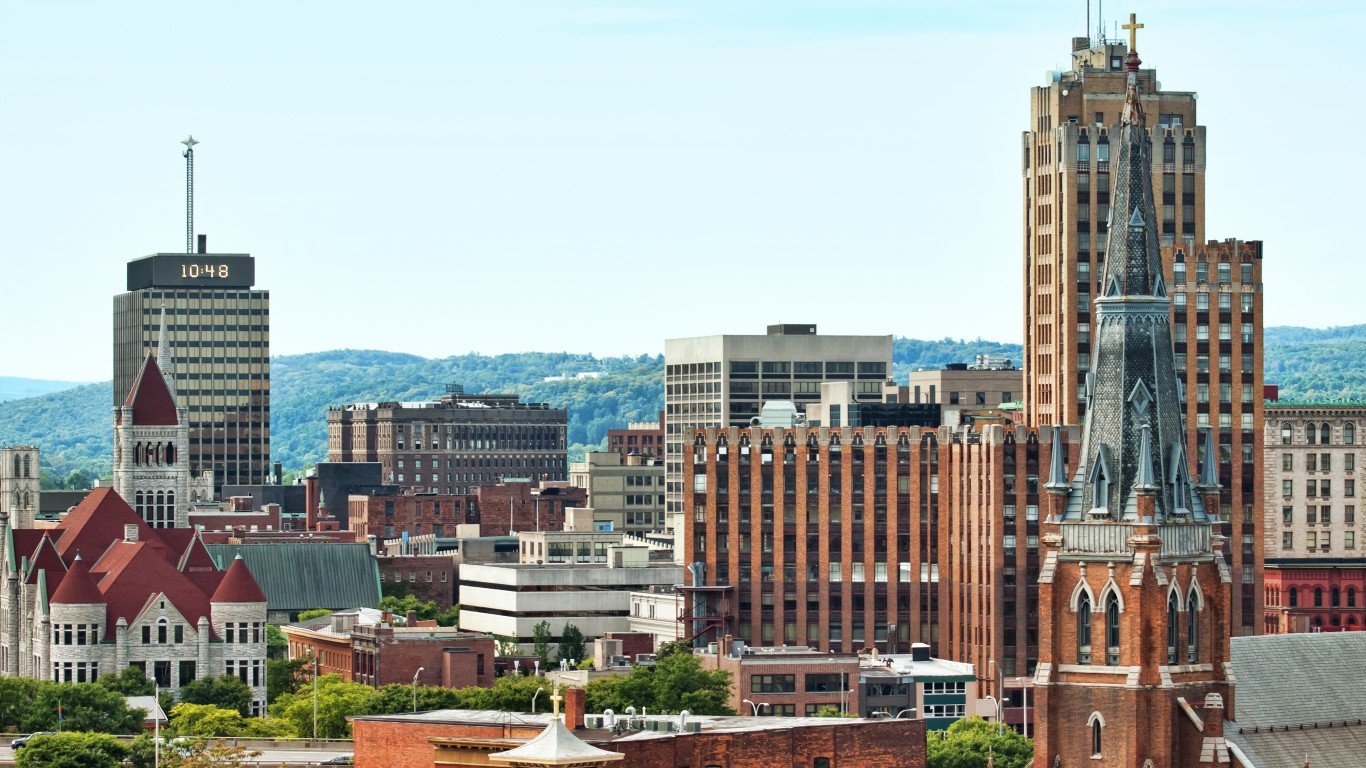
15. Syracuse, NY
> Fine particulate matter pollution 24-hr average: 14 µg/m3 (EPA standard: 35 µg/m3)
> Avg. nitrogen dioxide concentration: . ppb (EPA standard: 53 ppb)
> Total population: 650,211
> Fall 2022 allergy ranking: #13 out of 100
[in-text-ad]
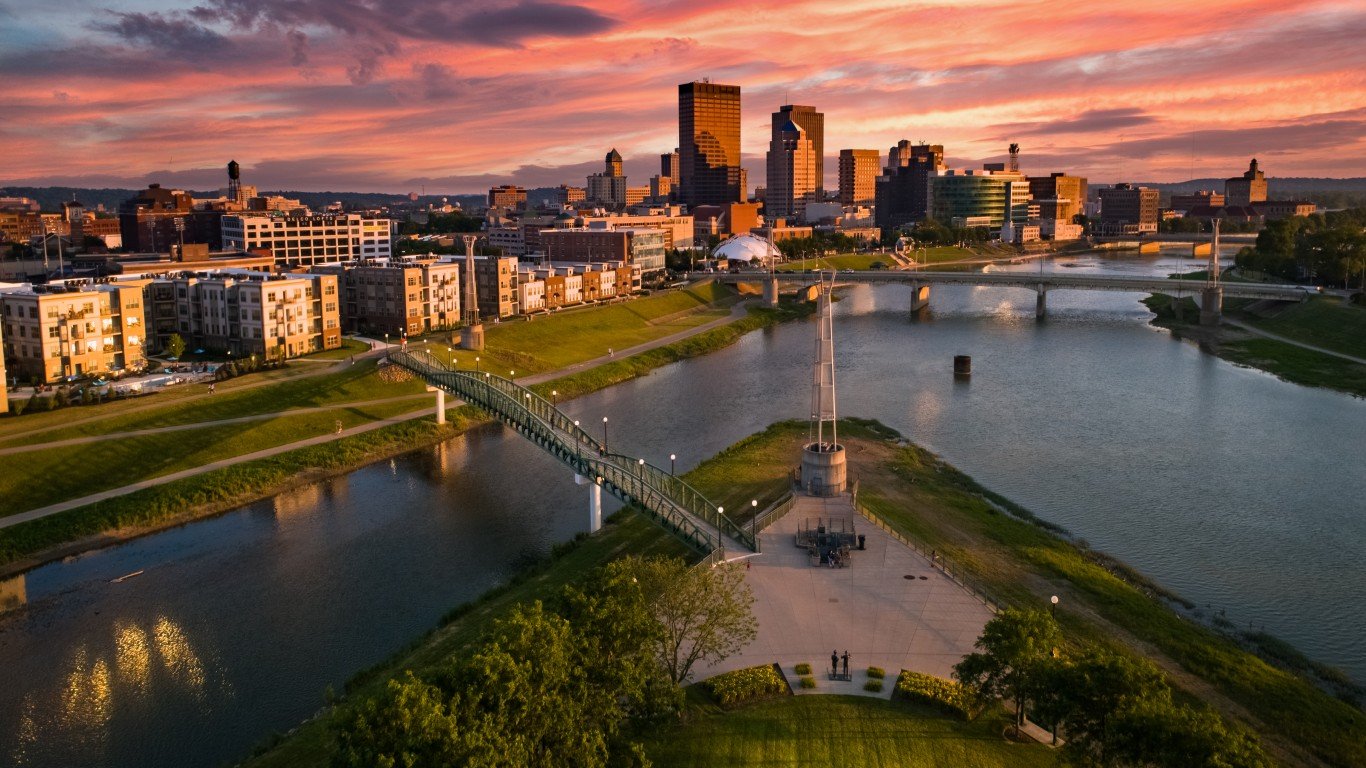
14. Dayton, OH
> Fine particulate matter pollution 24-hr average: 20 µg/m3 (EPA standard: 35 µg/m3)
> Avg. nitrogen dioxide concentration: . ppb (EPA standard: 53 ppb)
> Total population: 805,929
> Fall 2022 allergy ranking: #12 out of 100
[recirclink id=997420]
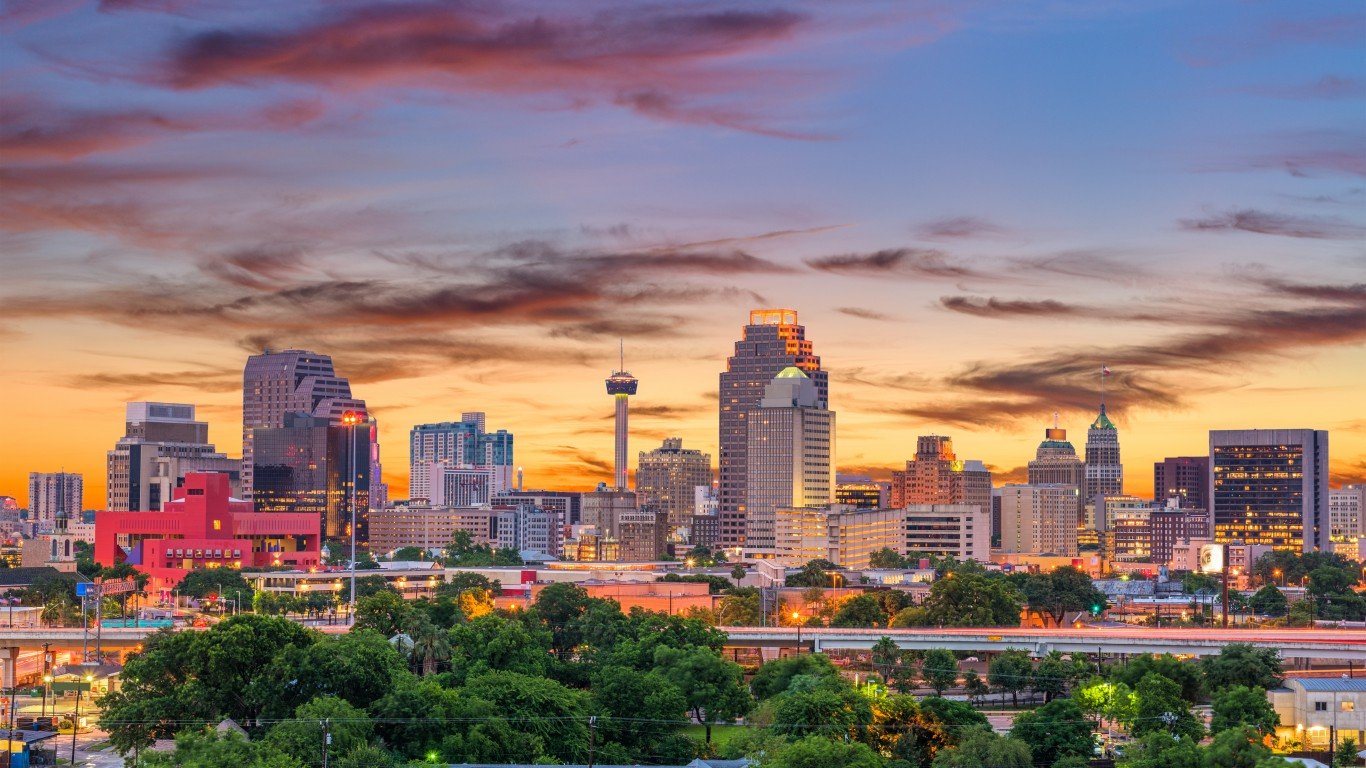
13. San Antonio, TX
> Fine particulate matter pollution 24-hr average: 23 µg/m3 (EPA standard: 35 µg/m3)
> Avg. nitrogen dioxide concentration: 8 ppb (EPA standard: 53 ppb)
> Total population: 2,510,211
> Fall 2022 allergy ranking: #4 out of 100
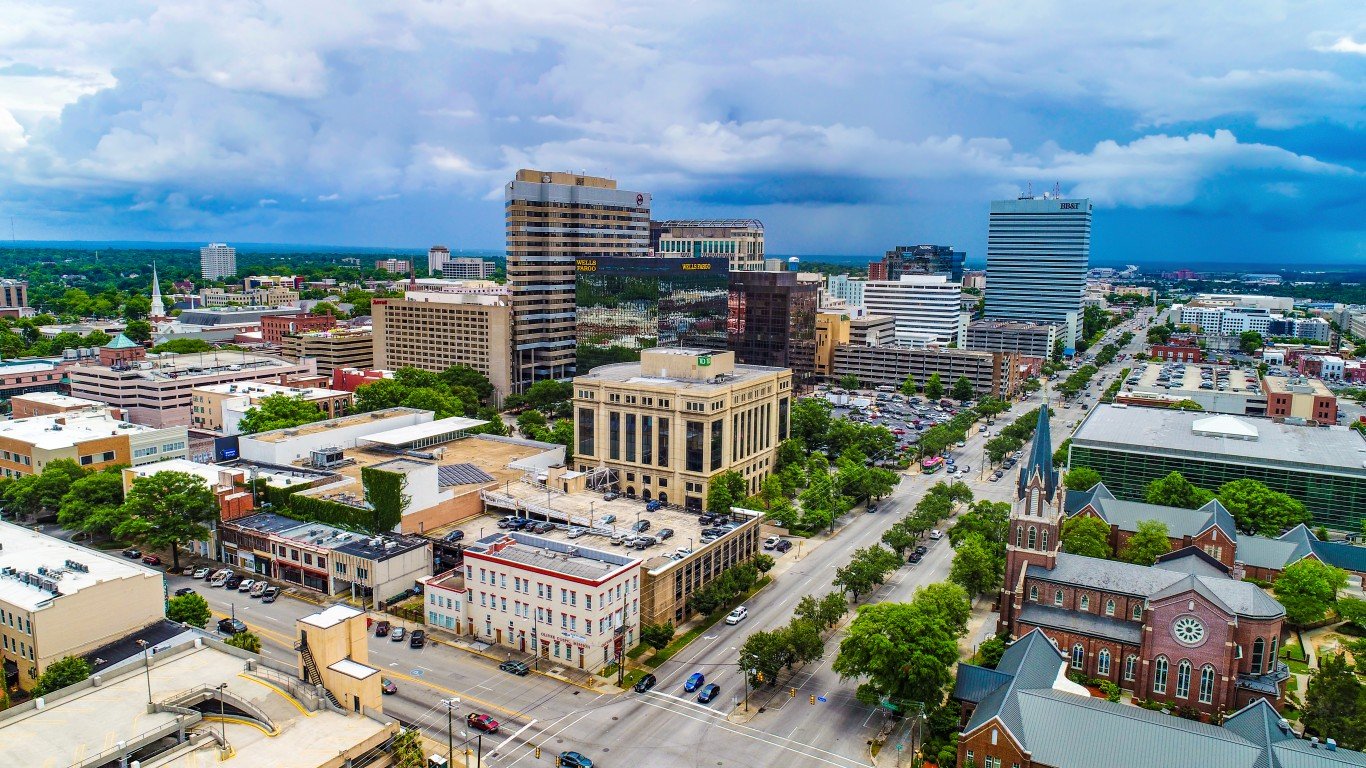
12. Columbia, SC
> Fine particulate matter pollution 24-hr average: 17 µg/m3 (EPA standard: 35 µg/m3)
> Avg. nitrogen dioxide concentration: 3 ppb (EPA standard: 53 ppb)
> Total population: 832,925
> Fall 2022 allergy ranking: #16 out of 100
[in-text-ad-2]
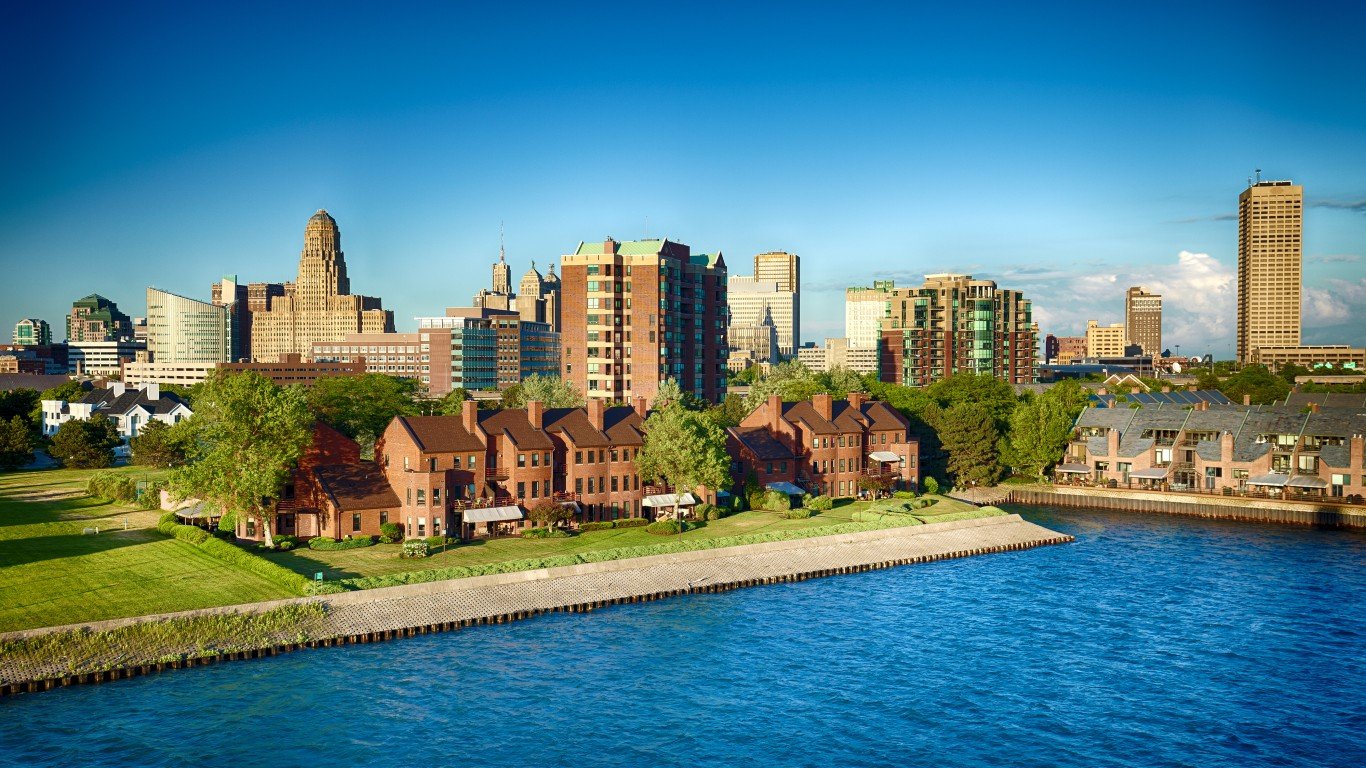
11. Buffalo, NY
> Fine particulate matter pollution 24-hr average: 19 µg/m3 (EPA standard: 35 µg/m3)
> Avg. nitrogen dioxide concentration: 8 ppb (EPA standard: 53 ppb)
> Total population: 1,129,018
> Fall 2022 allergy ranking: #7 out of 100
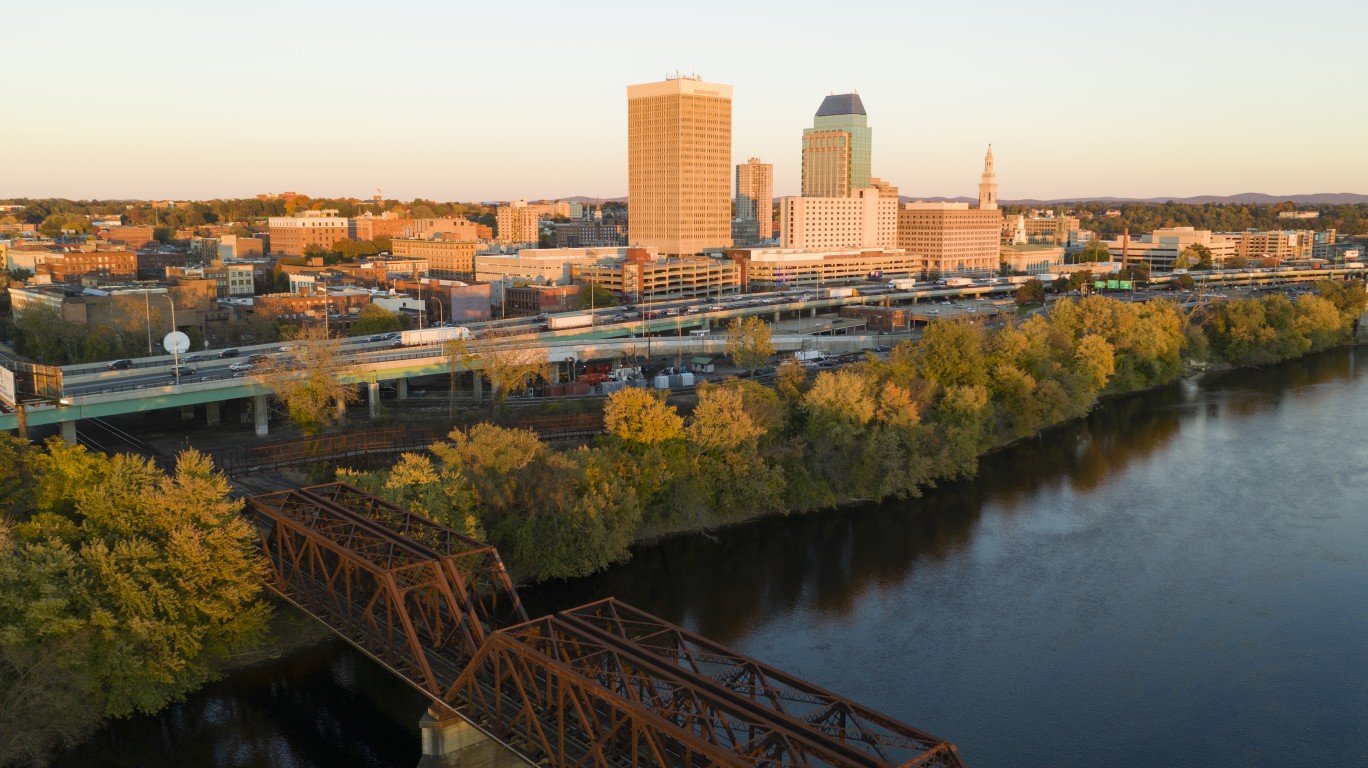
10. Springfield, MA
> Fine particulate matter pollution 24-hr average: 22 µg/m3 (EPA standard: 35 µg/m3)
> Avg. nitrogen dioxide concentration: 10 ppb (EPA standard: 53 ppb)
> Total population: 698,537
> Fall 2022 allergy ranking: #15 out of 100
[in-text-ad]
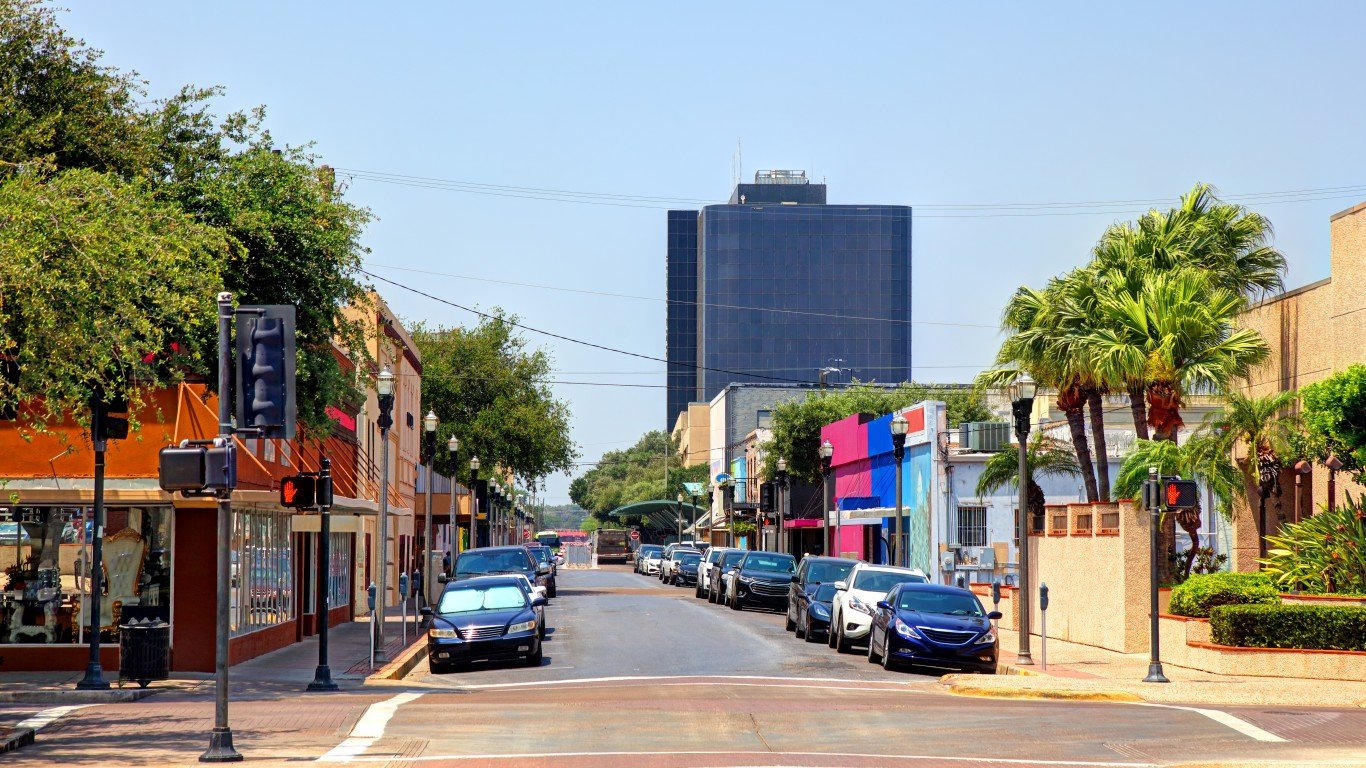
9. McAllen, TX
> Fine particulate matter pollution 24-hr average: 33 µg/m3 (EPA standard: 35 µg/m3)
> Avg. nitrogen dioxide concentration: . ppb (EPA standard: 53 ppb)
> Total population: 861,137
> Fall 2022 allergy ranking: #3 out of 100
[recirclink id=1064777]
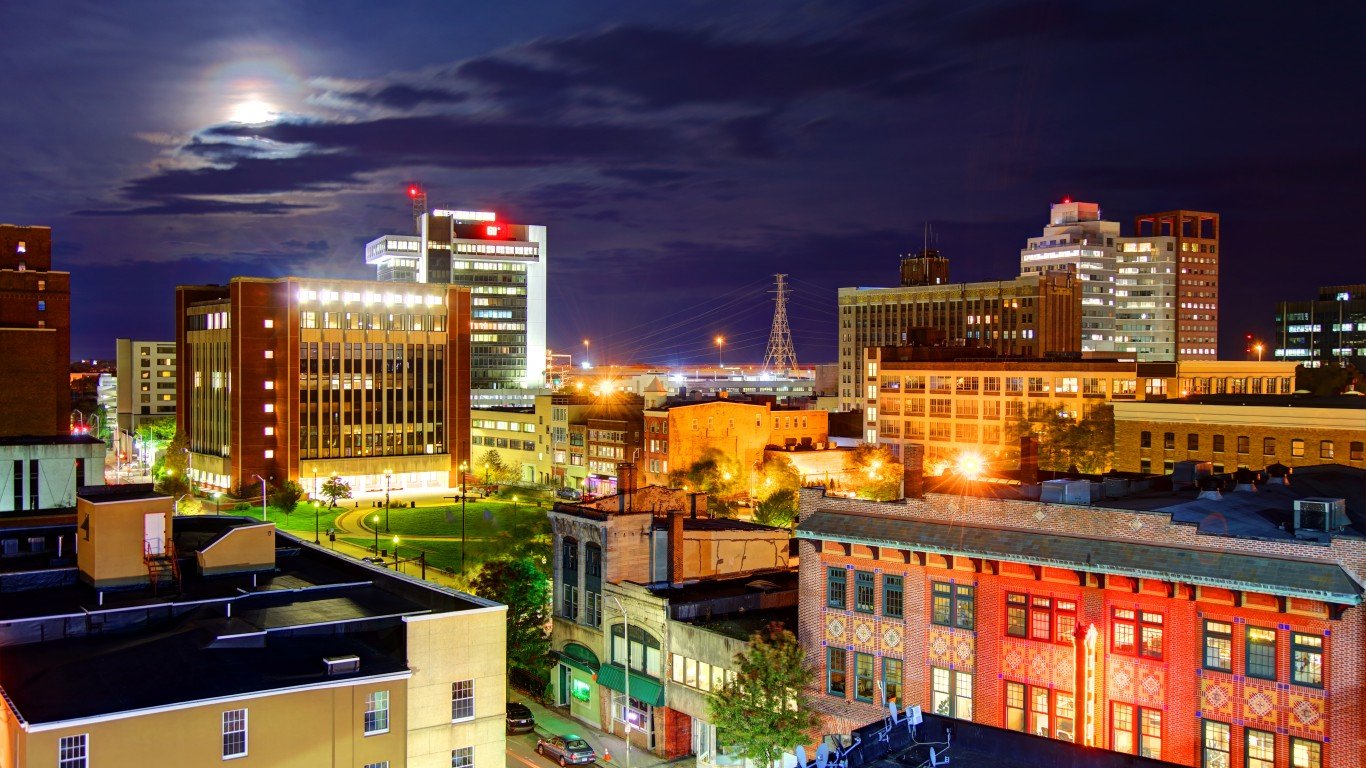
8. Bridgeport, CT
> Fine particulate matter pollution 24-hr average: 25 µg/m3 (EPA standard: 35 µg/m3)
> Avg. nitrogen dioxide concentration: 8 ppb (EPA standard: 53 ppb)
> Total population: 944,306
> Fall 2022 allergy ranking: #14 out of 100
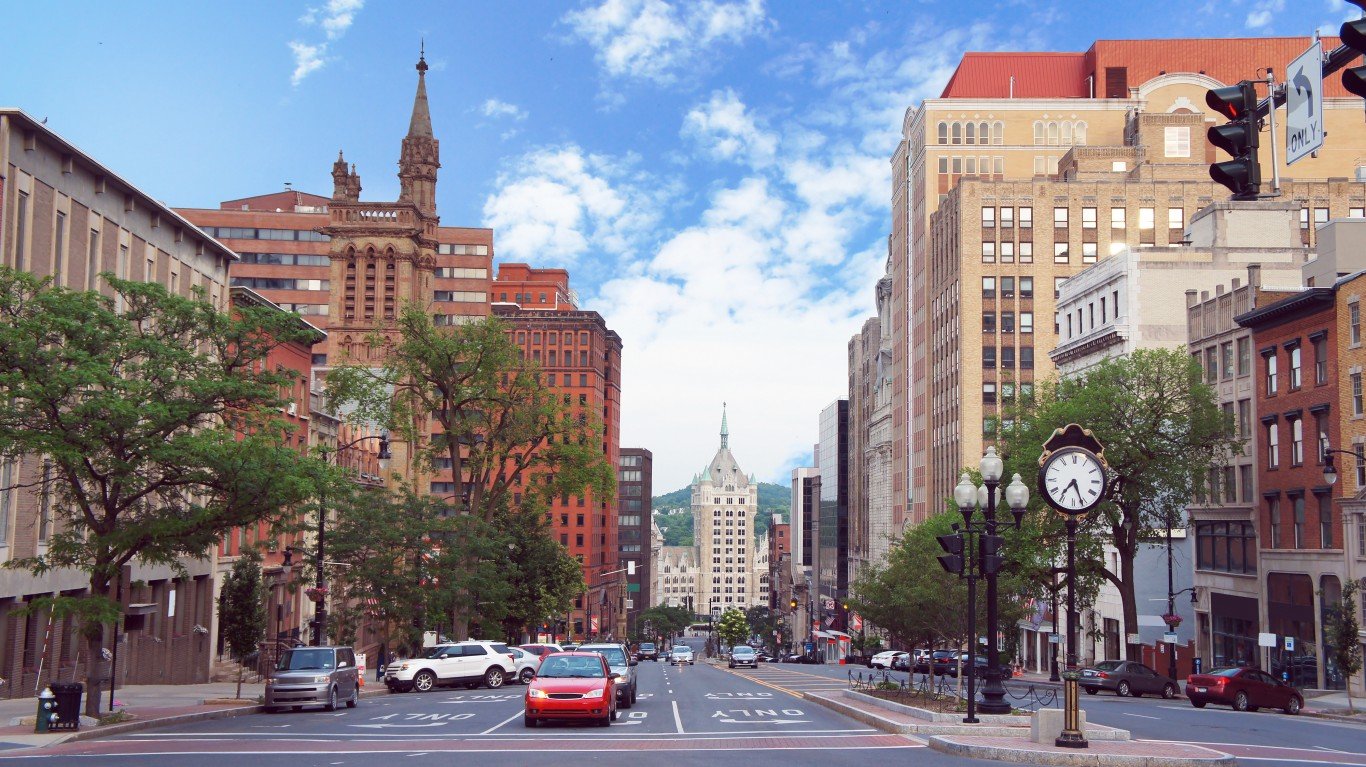
7. Albany, NY
> Fine particulate matter pollution 24-hr average: 23 µg/m3 (EPA standard: 35 µg/m3)
> Avg. nitrogen dioxide concentration: . ppb (EPA standard: 53 ppb)
> Total population: 880,766
> Fall 2022 allergy ranking: #11 out of 100
[in-text-ad-2]
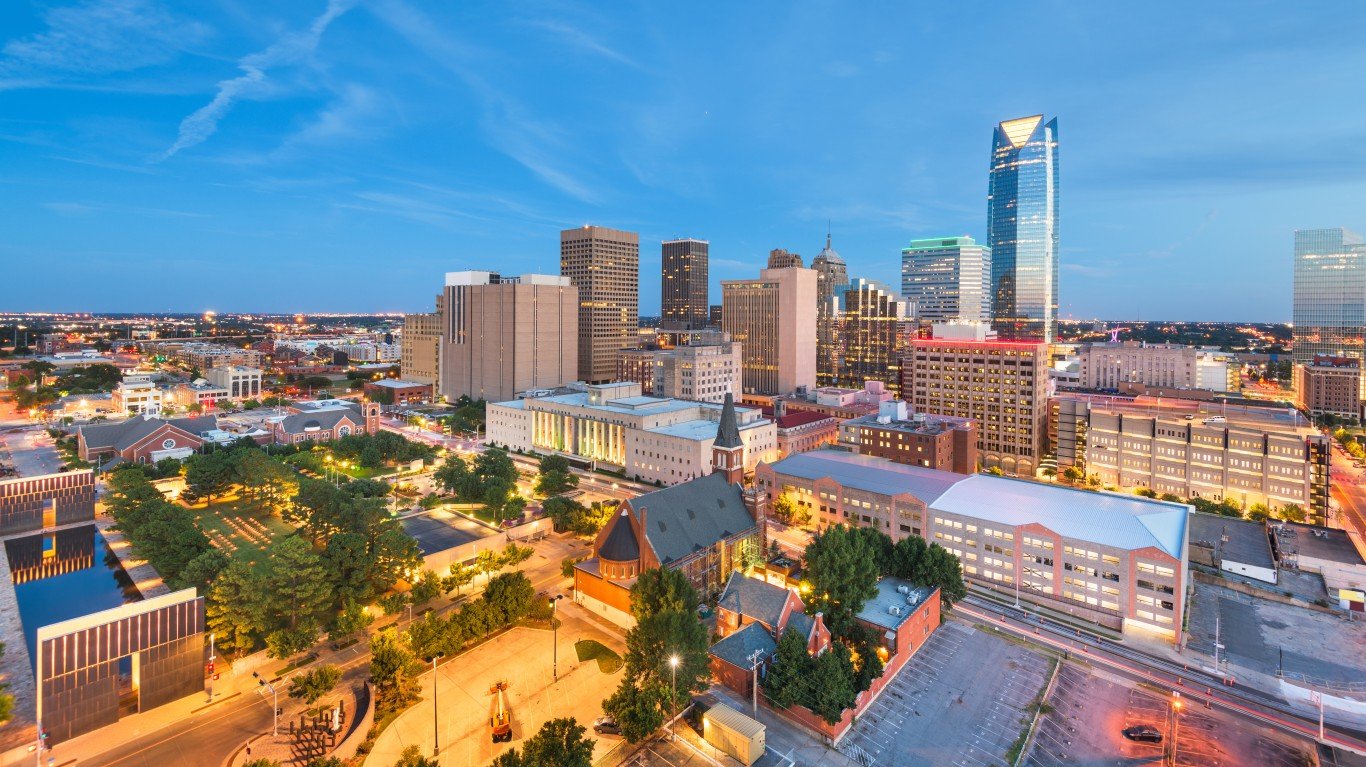
6. Oklahoma City, OK
> Fine particulate matter pollution 24-hr average: 25 µg/m3 (EPA standard: 35 µg/m3)
> Avg. nitrogen dioxide concentration: 11 ppb (EPA standard: 53 ppb)
> Total population: 1,397,040
> Fall 2022 allergy ranking: #5 out of 100
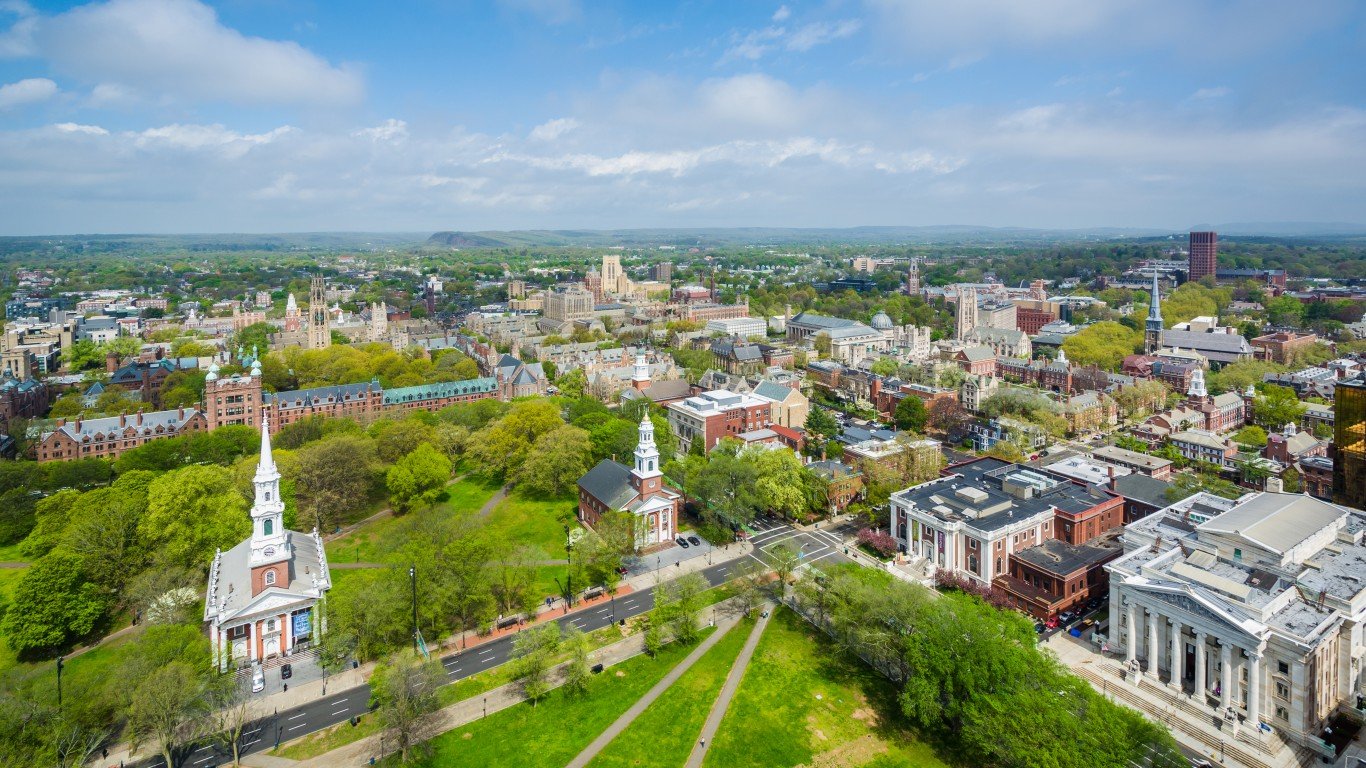
5. New Haven, CT
> Fine particulate matter pollution 24-hr average: 23 µg/m3 (EPA standard: 35 µg/m3)
> Avg. nitrogen dioxide concentration: 11 ppb (EPA standard: 53 ppb)
> Total population: 855,733
> Fall 2022 allergy ranking: #9 out of 100
[in-text-ad]

4. Hartford, CT
> Fine particulate matter pollution 24-hr average: 20 µg/m3 (EPA standard: 35 µg/m3)
> Avg. nitrogen dioxide concentration: 12 ppb (EPA standard: 53 ppb)
> Total population: 1,205,842
> Fall 2022 allergy ranking: #8 out of 100
[recirclink id=1039509]
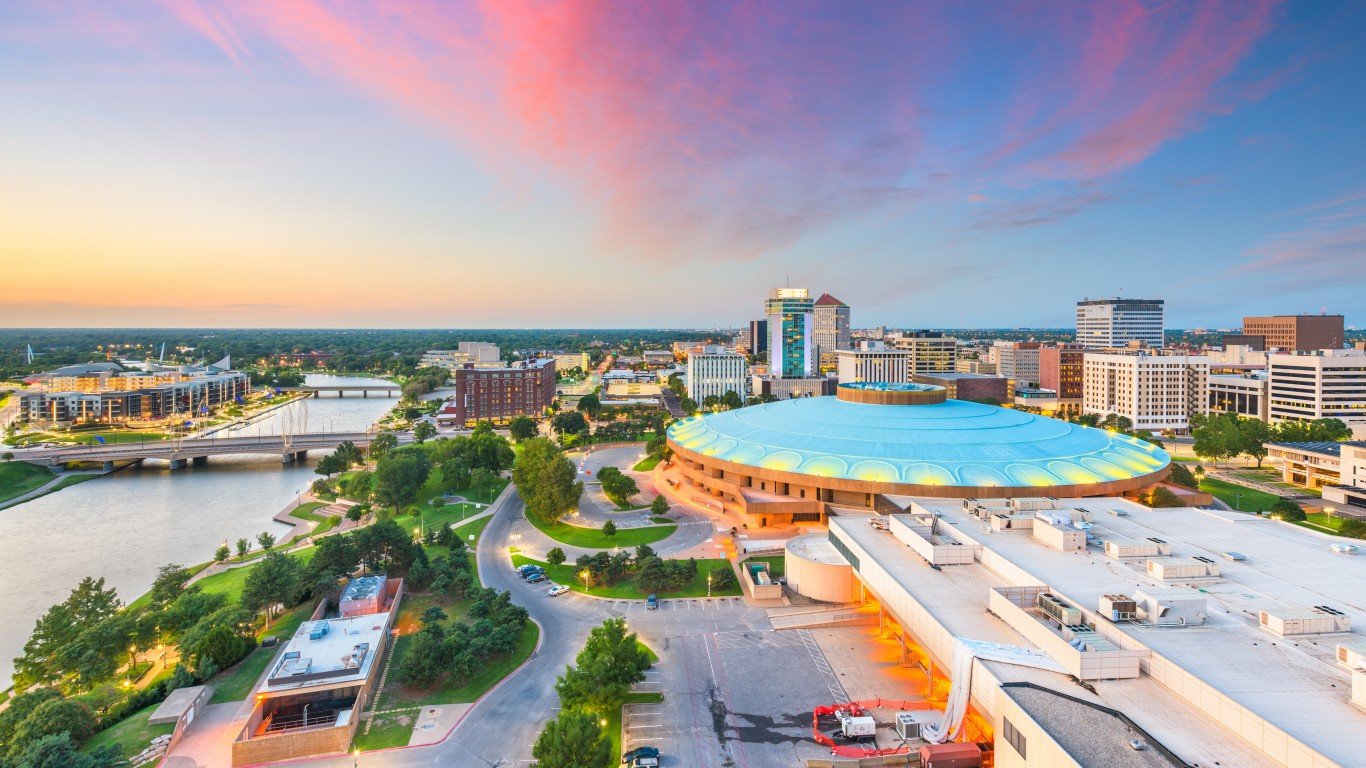
3. Wichita, KS
> Fine particulate matter pollution 24-hr average: 24 µg/m3 (EPA standard: 35 µg/m3)
> Avg. nitrogen dioxide concentration: 6 ppb (EPA standard: 53 ppb)
> Total population: 639,668
> Fall 2022 allergy ranking: #2 out of 100
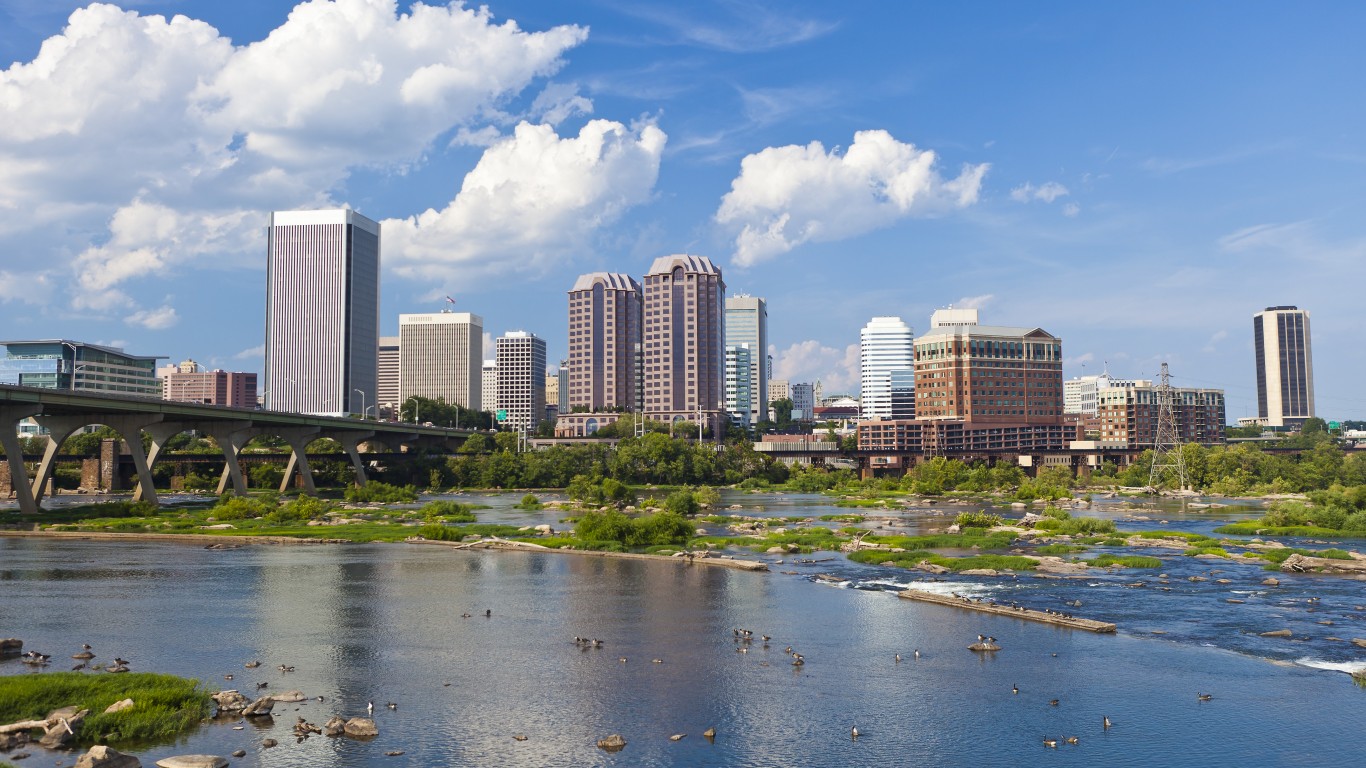
2. Richmond, VA
> Fine particulate matter pollution 24-hr average: 15 µg/m3 (EPA standard: 35 µg/m3)
> Avg. nitrogen dioxide concentration: 12 ppb (EPA standard: 53 ppb)
> Total population: 1,282,067
> Fall 2022 allergy ranking: #10 out of 100
[in-text-ad-2]
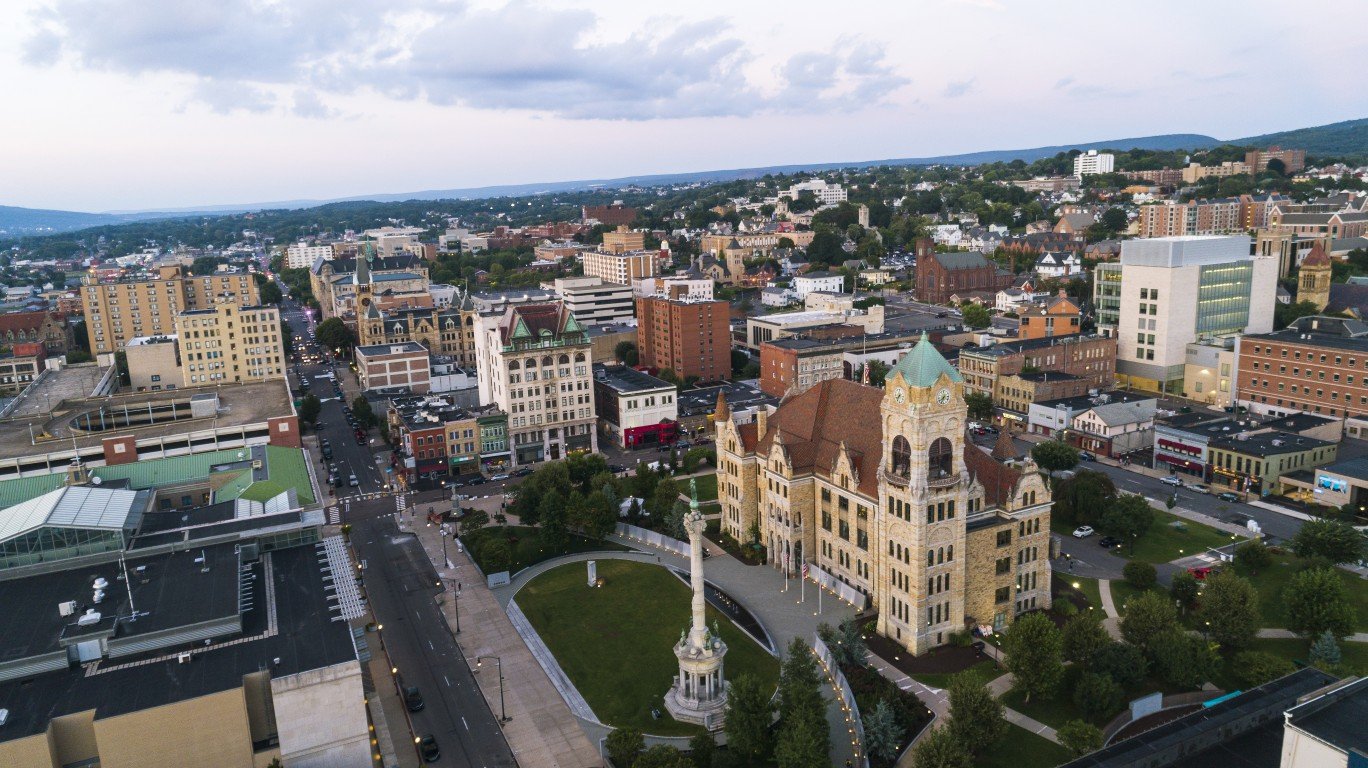
1. Scranton, PA
> Fine particulate matter pollution 24-hr average: 19 µg/m3 (EPA standard: 35 µg/m3)
> Avg. nitrogen dioxide concentration: 9 ppb (EPA standard: 53 ppb)
> Total population: 554,787
> Fall 2022 allergy ranking: #1 out of 100
Contact [email protected] for any questions or corrections.