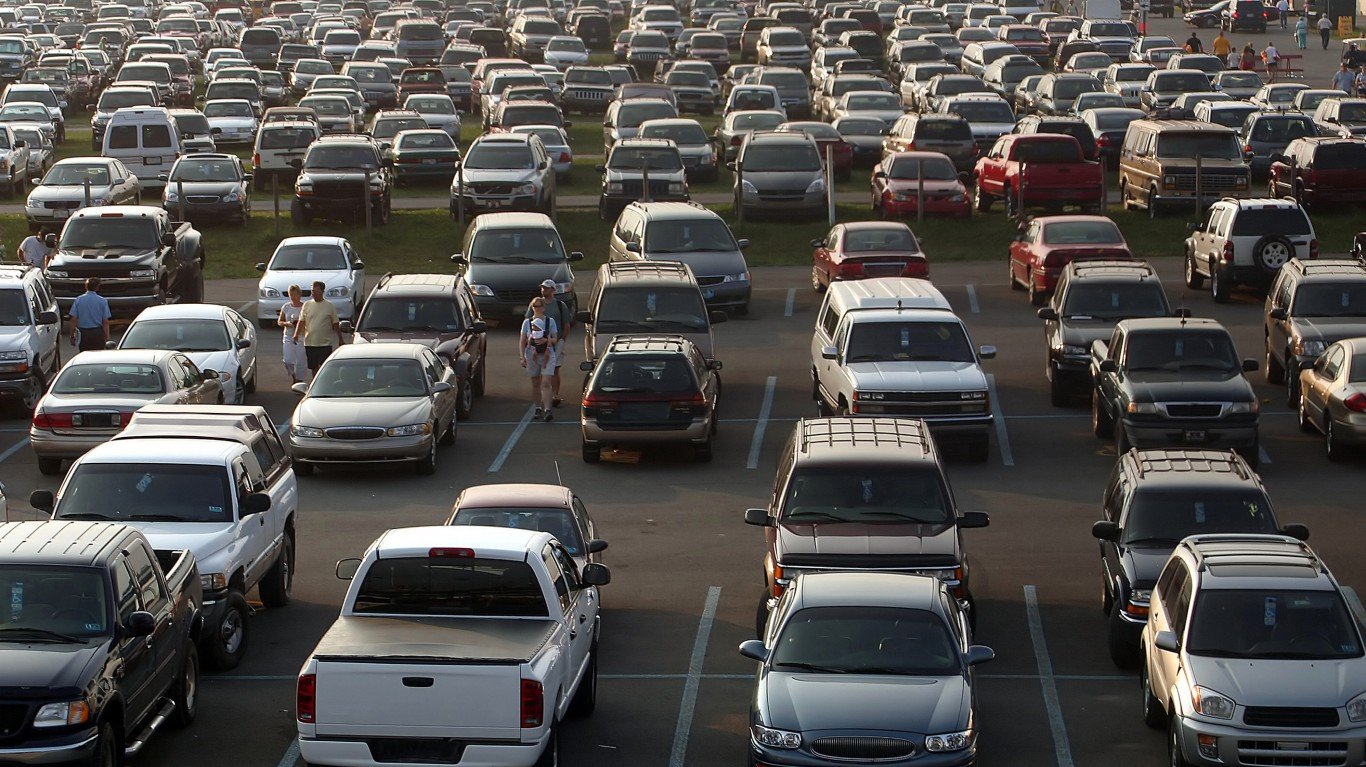
Motor vehicle theft, one of the most serious offenses tracked by the FBI, is on the rise in the United States. There were a total of 810,400 motor vehicle thefts nationwide in 2020, up 12% from the previous year and the most in over a decade.
Motor vehicle theft can be either the theft or attempted theft of a vehicle, such as a car or ATV. Some experts attribute the rising rates of vehicle theft to the COVID-19 pandemic, which led to vehicles sitting unattended and unused for longer stretches than usual. Here is a look at the 10 most stolen cars in America.
The country’s rising rates of motor vehicle theft are being driven by surges in some major metropolitan areas.
Using data from the FBI’s 2020 Uniform Crime Report, 24/7 Wall St. identified the 50 metro areas where vehicle theft is rising fastest. Metro areas are ranked by the year-over-year change in the number of reported vehicle thefts per 100,000 people in 2020. Among the metro areas on this list, the vehicle theft rate climbed anywhere from 42 incidents per 100,000 people to 183 per 100,000 people. The national motor vehicle theft rate climbed by 25 incidents per 100,000 people in 2020.
Vehicle theft – along with larceny and burglary – is one component of the overall property crime category. However, despite rising rates of vehicle theft, fewer than half of the metro areas on this list reported an increase in the overall property crime rate in 2020. Here is a look at the cities where property crime is soaring.
The metro areas that reported the largest increases in vehicle thefts per capita span the country, though California alone is home to eight, more than any other state. The majority of metro areas on this list have a higher overall motor vehicle theft rate than the national rate of 246 per 100,000 people.
Click here to see metros where the motor vehicle theft rate is soaring
Click here to see our detailed methodology
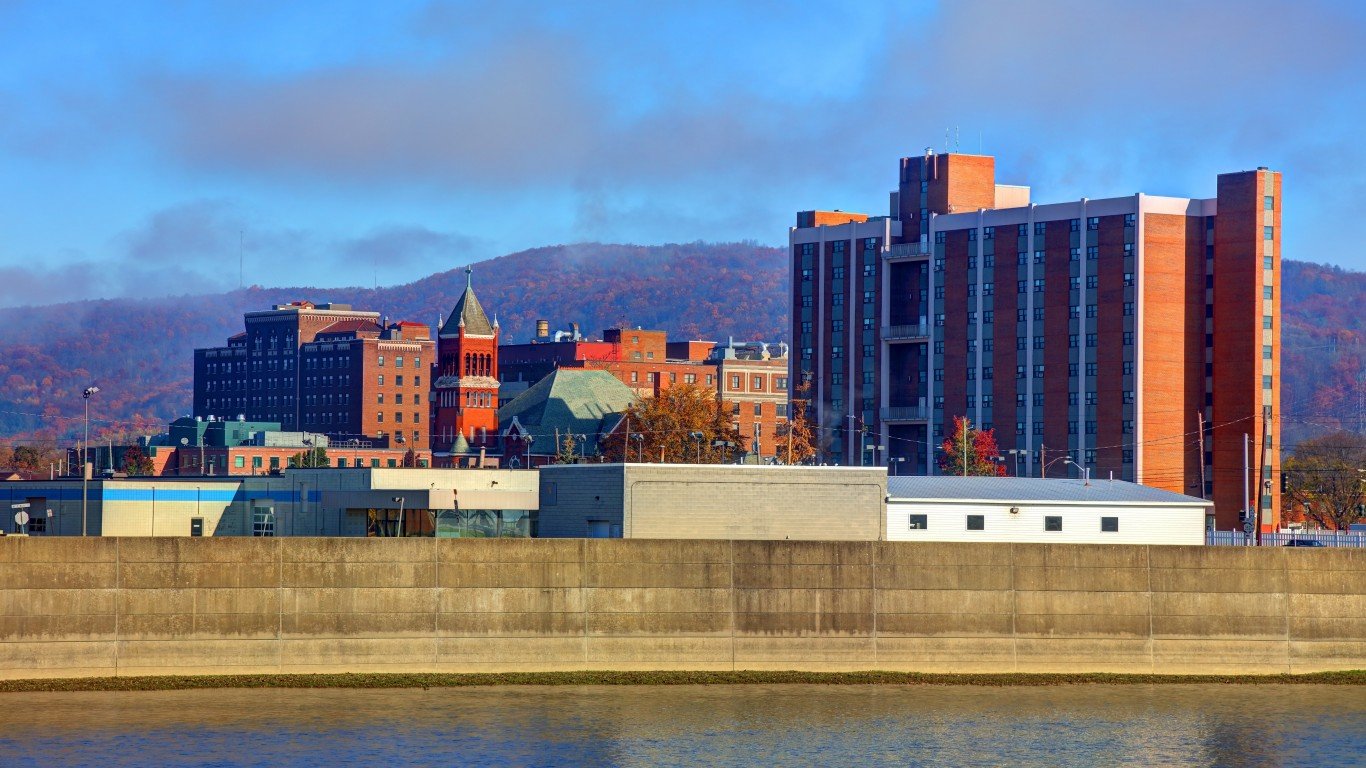
50. Elmira, NY
> Change in reported vehicle theft rate, 2019-2020: +41.7
> Vehicle-thefts reported in 2020: 67 — 5th lowest of 212 metros
> Vehicle-thefts per 100K people in 2020: 81.4 — 21st lowest of 212 metros
> 1-yr. change in all property crime: -122.2 — 72nd highest of 188 metros
> Property crimes per 100K people in 2020: 1,613.9 — 60th lowest of 198 metros
> Population: 83,456
[in-text-ad]

49. Bismarck, ND
> Change in reported vehicle theft rate, 2019-2020: +42.3
> Vehicle-thefts reported in 2020: 405 — 98th lowest of 212 metros
> Vehicle-thefts per 100K people in 2020: 312.3 — 39th highest of 212 metros
> 1-yr. change in all property crime: +532.4 — 2nd highest of 188 metros
> Property crimes per 100K people in 2020: 2,847.1 — 25th highest of 198 metros
> Population: 129,115
[recirclink id=1016086]
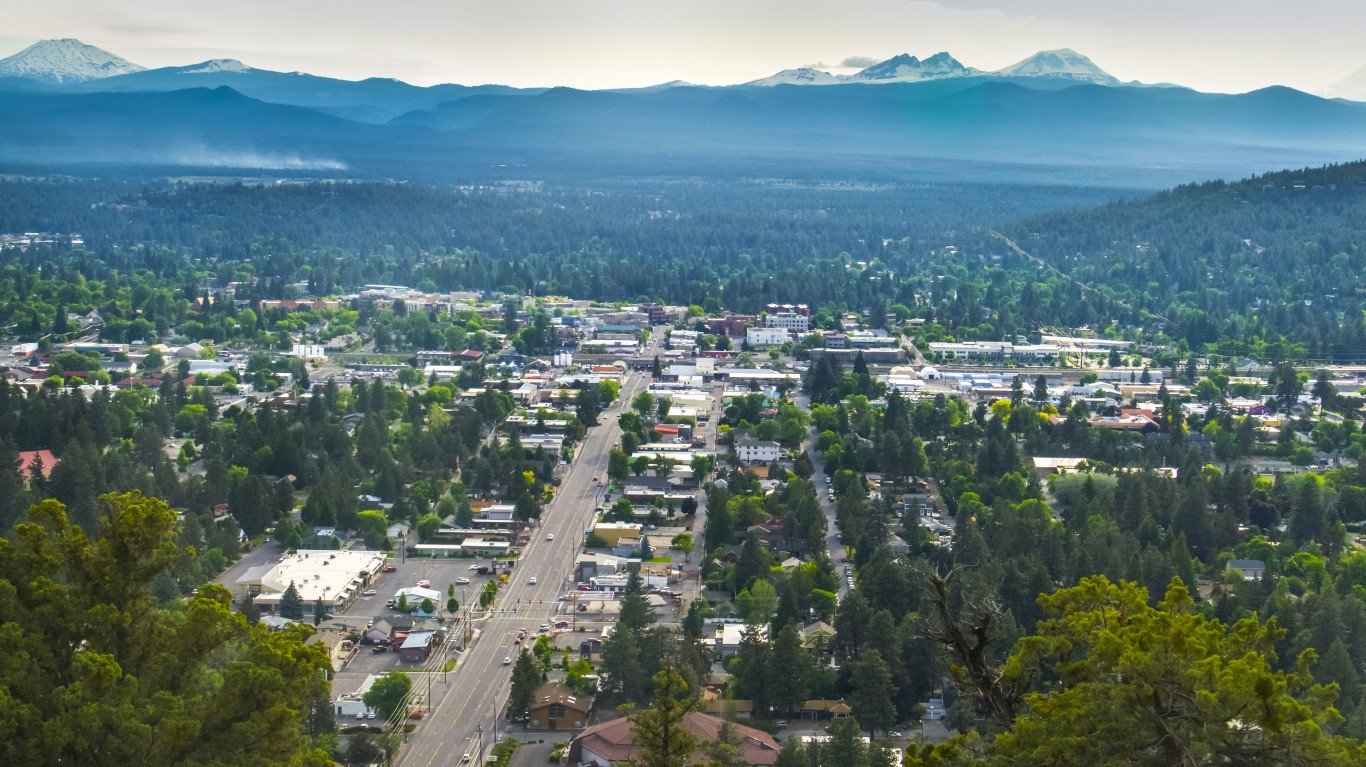
48. Bend, OR
> Change in reported vehicle theft rate, 2019-2020: +43.3
> Vehicle-thefts reported in 2020: 348 — 82nd lowest of 212 metros (tied)
> Vehicle-thefts per 100K people in 2020: 172.5 — 93rd lowest of 212 metros
> 1-yr. change in all property crime: -104.8 — 68th highest of 188 metros
> Property crimes per 100K people in 2020: 1,816.5 — 82nd lowest of 198 metros
> Population: 197,692

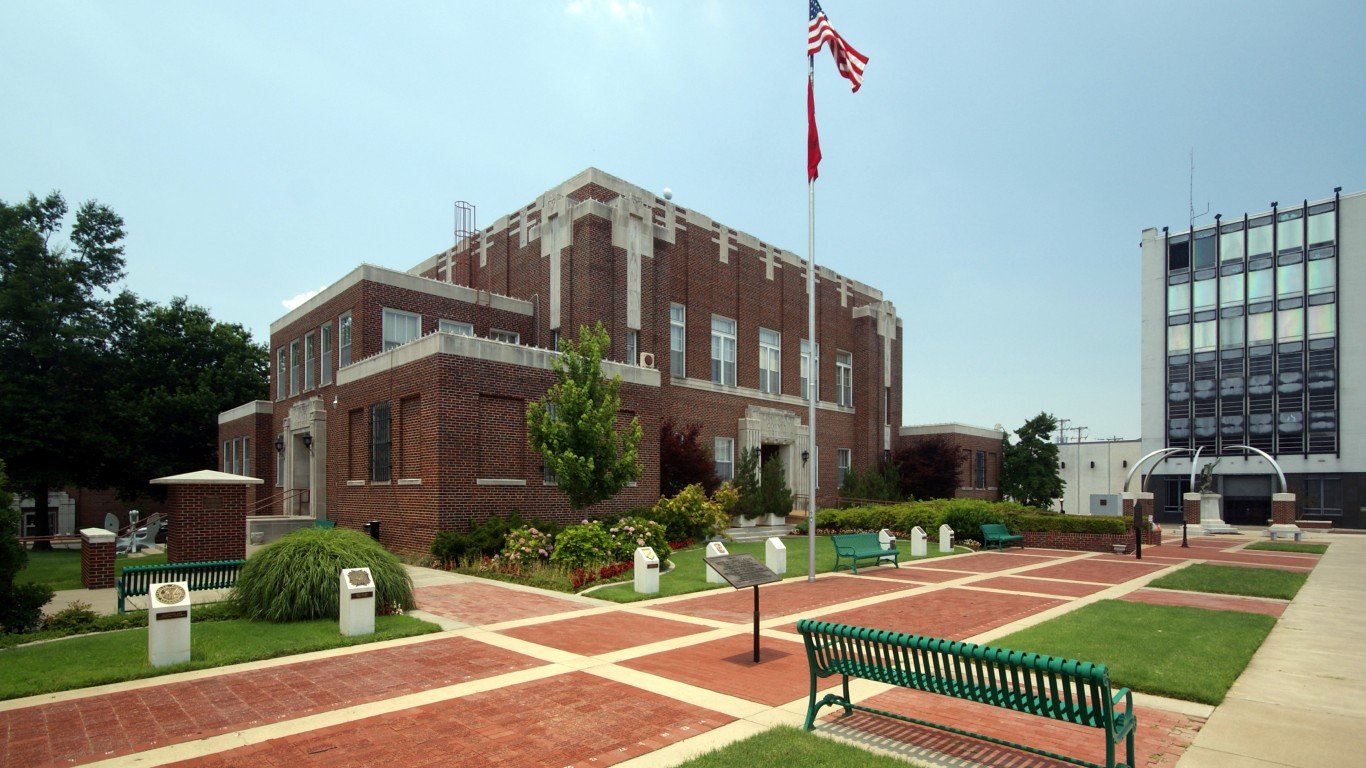
47. Fort Smith, AR-OK
> Change in reported vehicle theft rate, 2019-2020: +43.7
> Vehicle-thefts reported in 2020: 722 — 84th highest of 212 metros
> Vehicle-thefts per 100K people in 2020: 288.1 — 48th highest of 212 metros
> 1-yr. change in all property crime: -299.8 — 50th lowest of 188 metros
> Property crimes per 100K people in 2020: 2,882.6 — 23rd highest of 198 metros
> Population: 249,152
[in-text-ad-2]
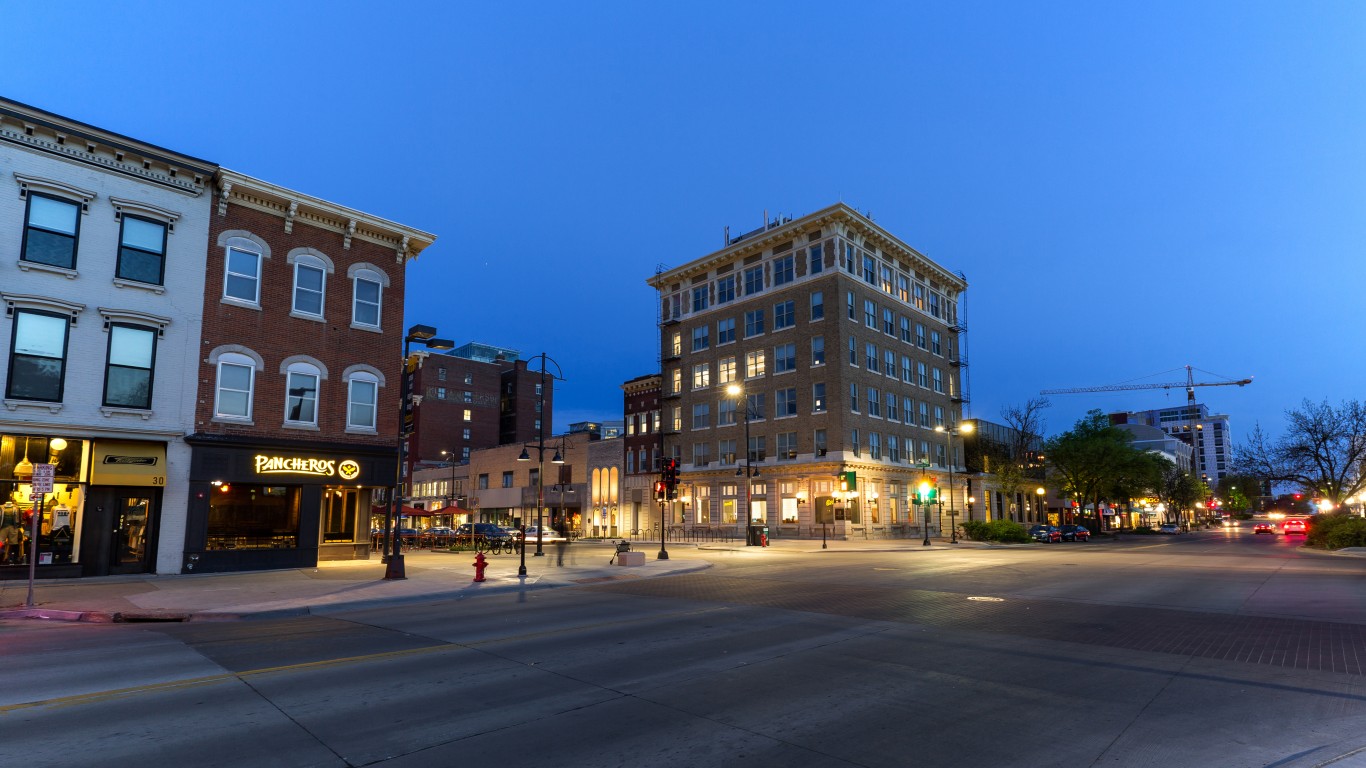
46. Iowa City, IA
> Change in reported vehicle theft rate, 2019-2020: +45.1
> Vehicle-thefts reported in 2020: 221 — 56th lowest of 212 metros
> Vehicle-thefts per 100K people in 2020: 126.1 — 58th lowest of 212 metros
> 1-yr. change in all property crime: -19.8 — 40th highest of 188 metros
> Property crimes per 100K people in 2020: 1,496.7 — 53rd lowest of 198 metros
> Population: 173,105

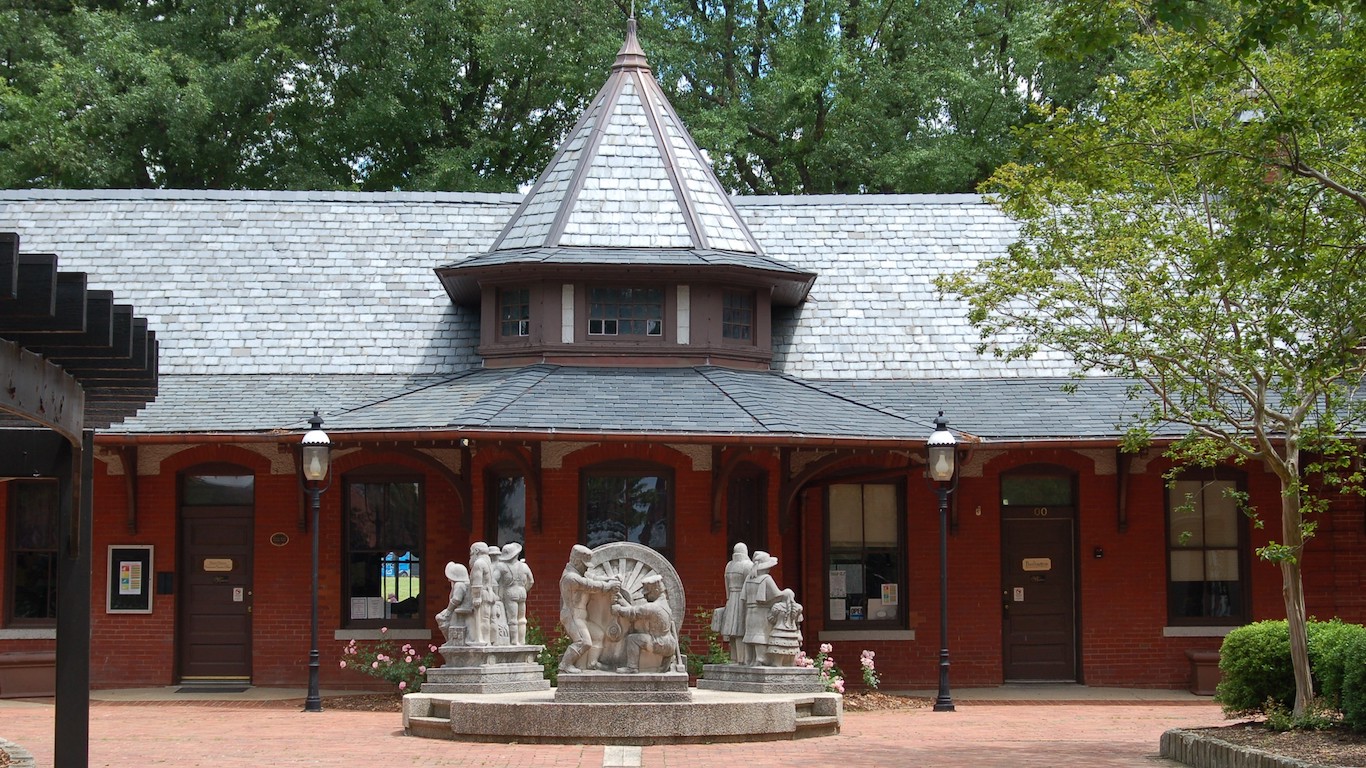
45. Durham-Chapel Hill, NC
> Change in reported vehicle theft rate, 2019-2020: +45.5
> Vehicle-thefts reported in 2020: 1,377 — 44th highest of 212 metros
> Vehicle-thefts per 100K people in 2020: 210.6 — 87th highest of 212 metros
> 1-yr. change in all property crime: -81.2 — 57th highest of 188 metros
> Property crimes per 100K people in 2020: 2,500.5 — 42nd highest of 198 metros
> Population: 644,367
[in-text-ad]
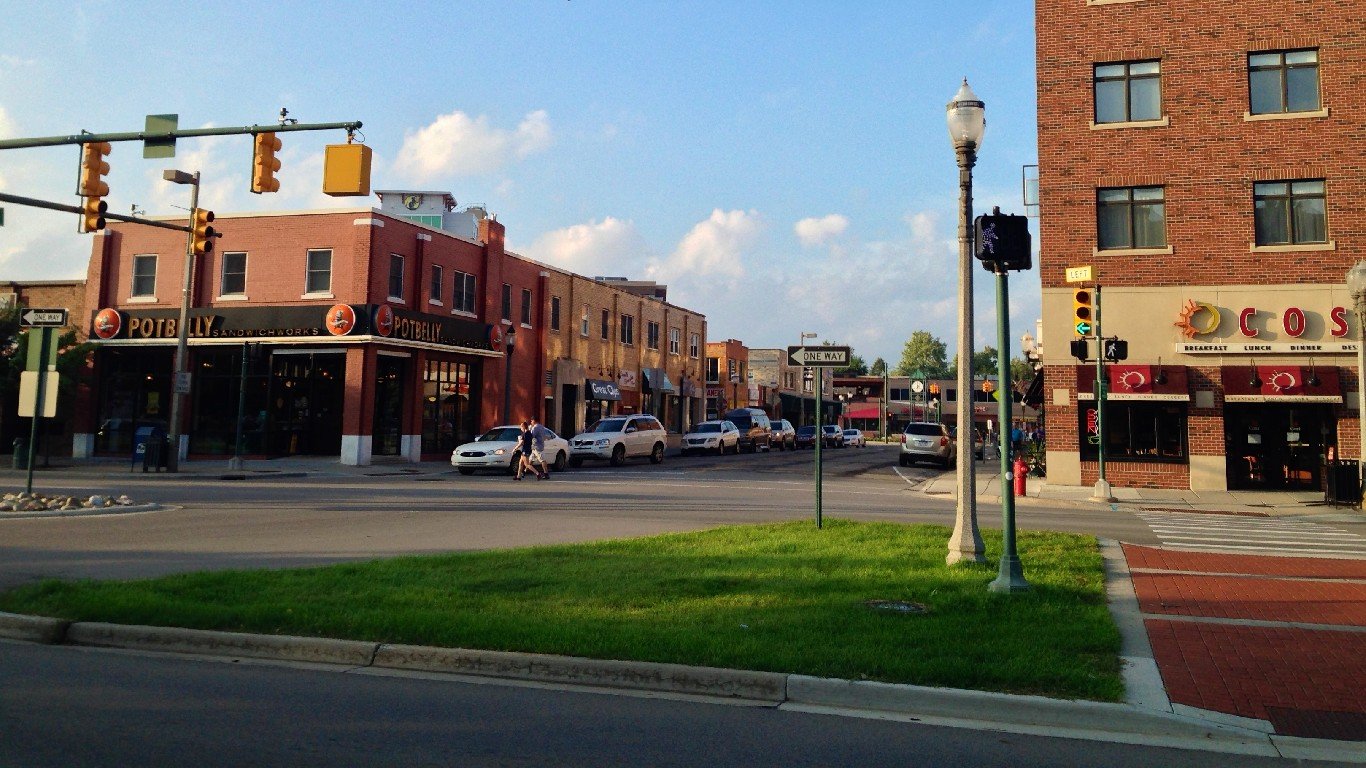
44. Lansing-East Lansing, MI
> Change in reported vehicle theft rate, 2019-2020: +45.5
> Vehicle-thefts reported in 2020: 1,114 — 52nd highest of 212 metros
> Vehicle-thefts per 100K people in 2020: 202.4 — 94th highest of 212 metros
> 1-yr. change in all property crime: N/A
> Property crimes per 100K people in 2020: 1,639.1 — 63rd lowest of 198 metros
> Population: 550,391
[recirclink id=1062431]
43. Burlington, NC
> Change in reported vehicle theft rate, 2019-2020: +47.2
> Vehicle-thefts reported in 2020: 340 — 81st lowest of 212 metros
> Vehicle-thefts per 100K people in 2020: 198.1 — 101st highest of 212 metros
> 1-yr. change in all property crime: -268.8 — 64th lowest of 188 metros
> Property crimes per 100K people in 2020: 2,370.9 — 50th highest of 198 metros
> Population: 169,509

42. Raleigh-Cary, NC
> Change in reported vehicle theft rate, 2019-2020: +47.4
> Vehicle-thefts reported in 2020: 2,135 — 31st highest of 212 metros
> Vehicle-thefts per 100K people in 2020: 150.1 — 76th lowest of 212 metros
> 1-yr. change in all property crime: +106.6 — 19th highest of 188 metros
> Property crimes per 100K people in 2020: 1,504.3 — 54th lowest of 198 metros
> Population: 1,390,785
[in-text-ad-2]

41. Grand Rapids-Kentwood, MI
> Change in reported vehicle theft rate, 2019-2020: +48.4
> Vehicle-thefts reported in 2020: 1,777 — 40th highest of 212 metros
> Vehicle-thefts per 100K people in 2020: 164.0 — 87th lowest of 212 metros
> 1-yr. change in all property crime: N/A
> Property crimes per 100K people in 2020: 1,278.7 — 31st lowest of 198 metros
> Population: 1,077,370
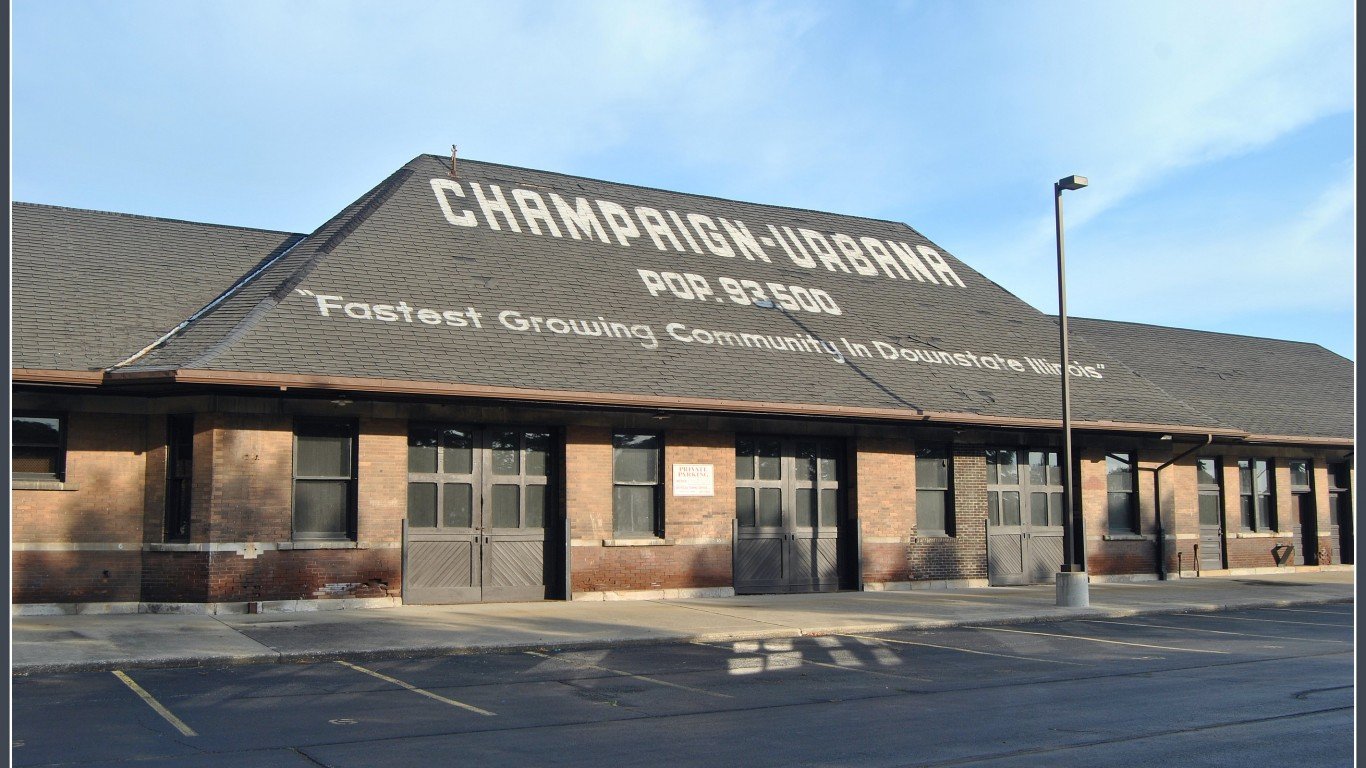
40. Champaign-Urbana, IL
> Change in reported vehicle theft rate, 2019-2020: +49.0
> Vehicle-thefts reported in 2020: 325 — 78th lowest of 212 metros
> Vehicle-thefts per 100K people in 2020: 144.0 — 71st lowest of 212 metros
> 1-yr. change in all property crime: N/A
> Property crimes per 100K people in 2020: N/A
> Population: 226,033
[in-text-ad]
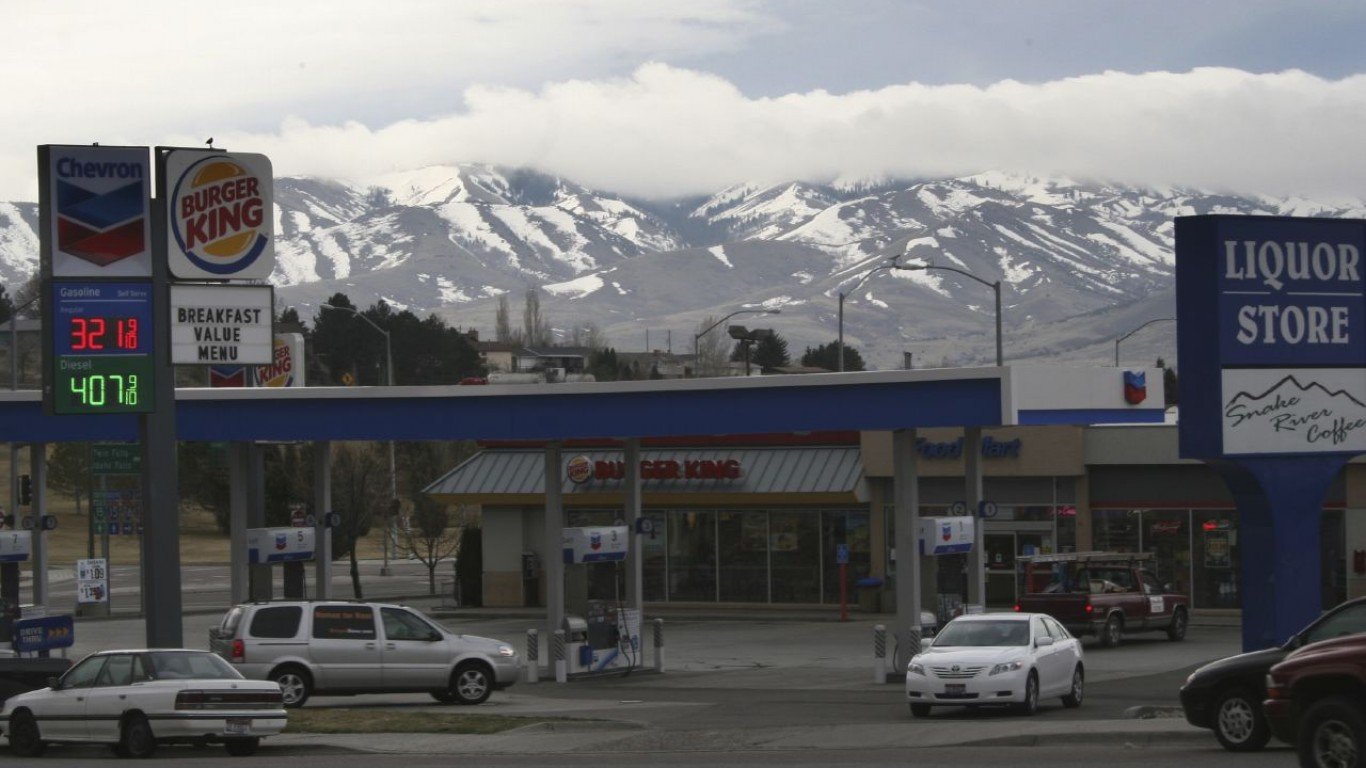
39. Pocatello, ID
> Change in reported vehicle theft rate, 2019-2020: +49.6
> Vehicle-thefts reported in 2020: 165 — 38th lowest of 212 metros (tied)
> Vehicle-thefts per 100K people in 2020: 170.6 — 92nd lowest of 212 metros
> 1-yr. change in all property crime: -299.3 — 51st lowest of 188 metros
> Property crimes per 100K people in 2020: 1,806.1 — 81st lowest of 198 metros
> Population: 94,588
[recirclink id=1066891]

38. Akron, OH
> Change in reported vehicle theft rate, 2019-2020: +53.4
> Vehicle-thefts reported in 2020: 1,268 — 46th highest of 212 metros
> Vehicle-thefts per 100K people in 2020: 180.5 — 101st lowest of 212 metros
> 1-yr. change in all property crime: +86.9 — 22nd highest of 188 metros
> Property crimes per 100K people in 2020: 2,139.4 — 79th highest of 198 metros
> Population: 703,479
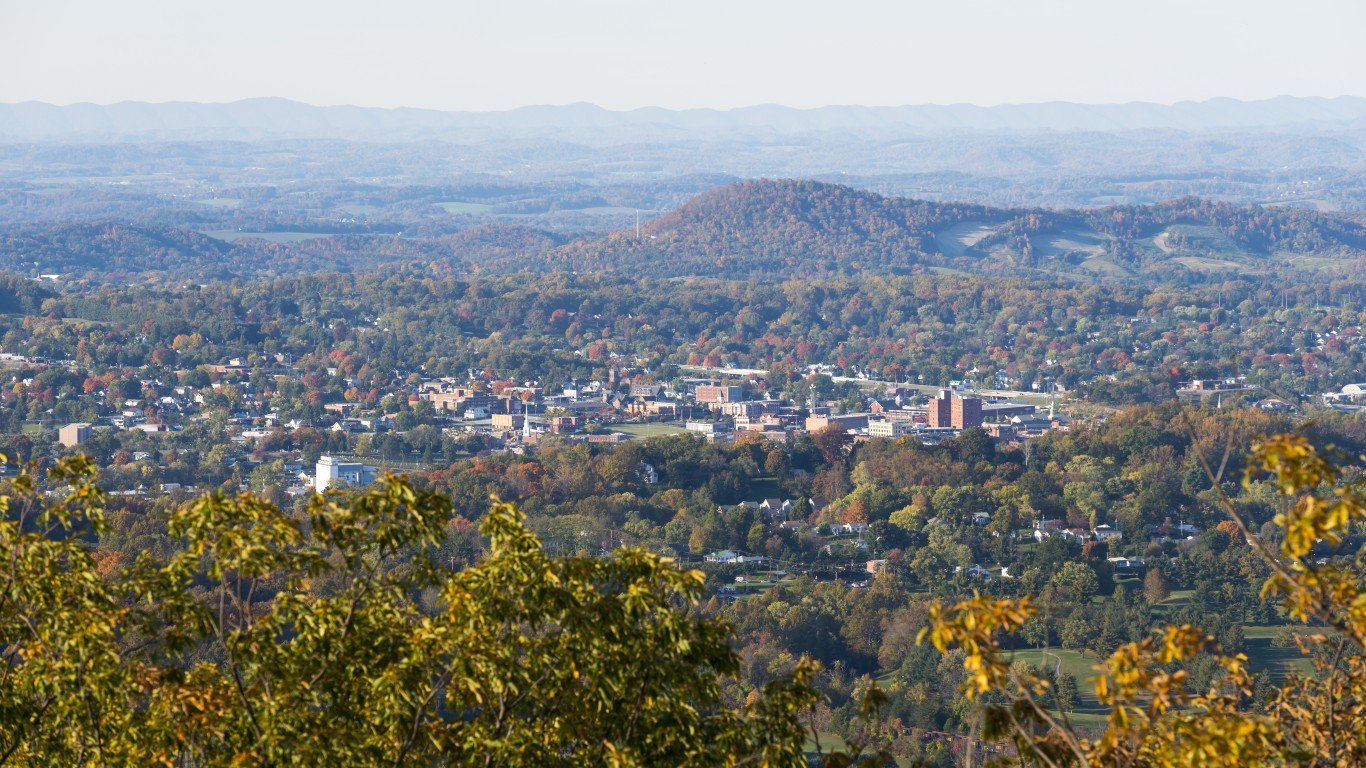
37. Johnson City, TN
> Change in reported vehicle theft rate, 2019-2020: +56.3
> Vehicle-thefts reported in 2020: 573 — 98th highest of 212 metros
> Vehicle-thefts per 100K people in 2020: 280.6 — 53rd highest of 212 metros
> 1-yr. change in all property crime: -71.9 — 55th highest of 188 metros
> Property crimes per 100K people in 2020: 2,140.7 — 78th highest of 198 metros
> Population: 203,697
[in-text-ad-2]
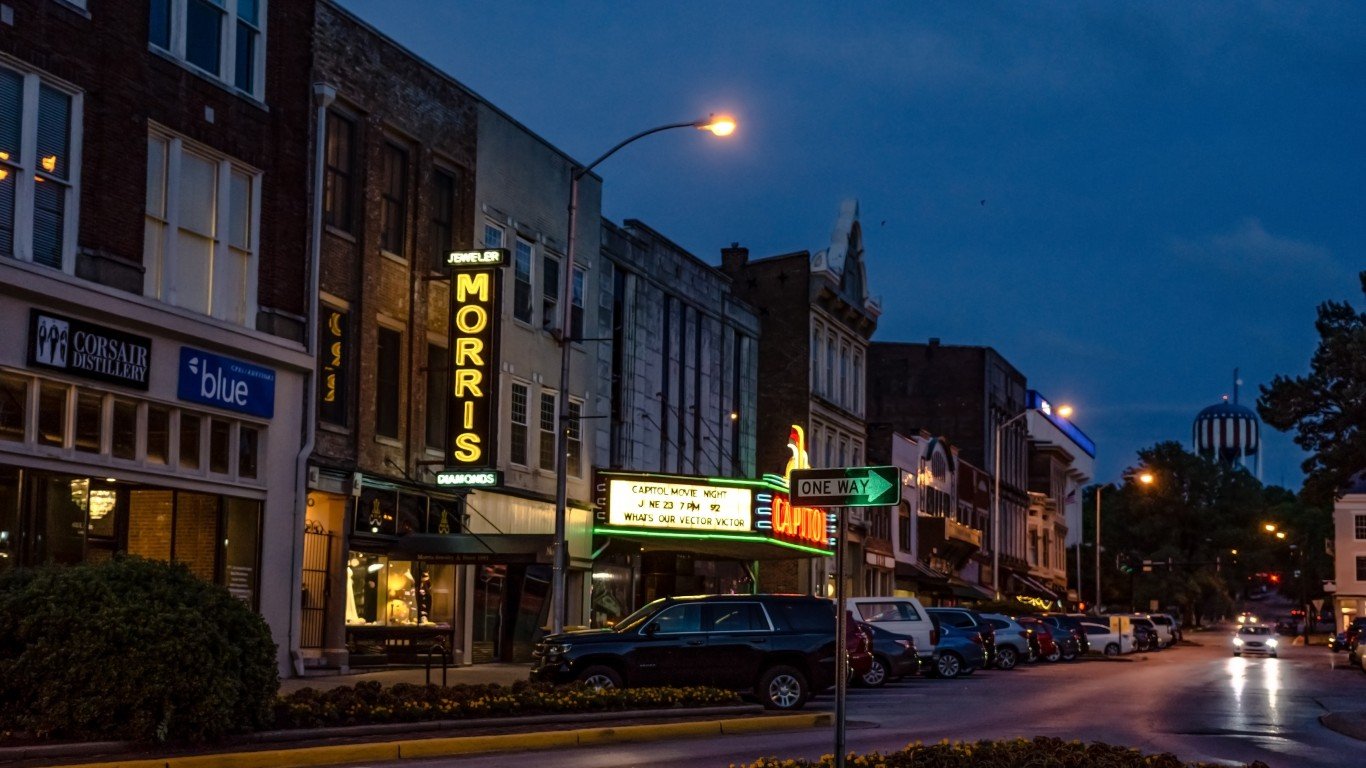
36. Bowling Green, KY
> Change in reported vehicle theft rate, 2019-2020: +57.0
> Vehicle-thefts reported in 2020: 467 — 106th lowest of 212 metros
> Vehicle-thefts per 100K people in 2020: 257.4 — 64th highest of 212 metros
> 1-yr. change in all property crime: -42.7 — 47th highest of 188 metros
> Property crimes per 100K people in 2020: 2,294.5 — 57th highest of 198 metros
> Population: 176,816
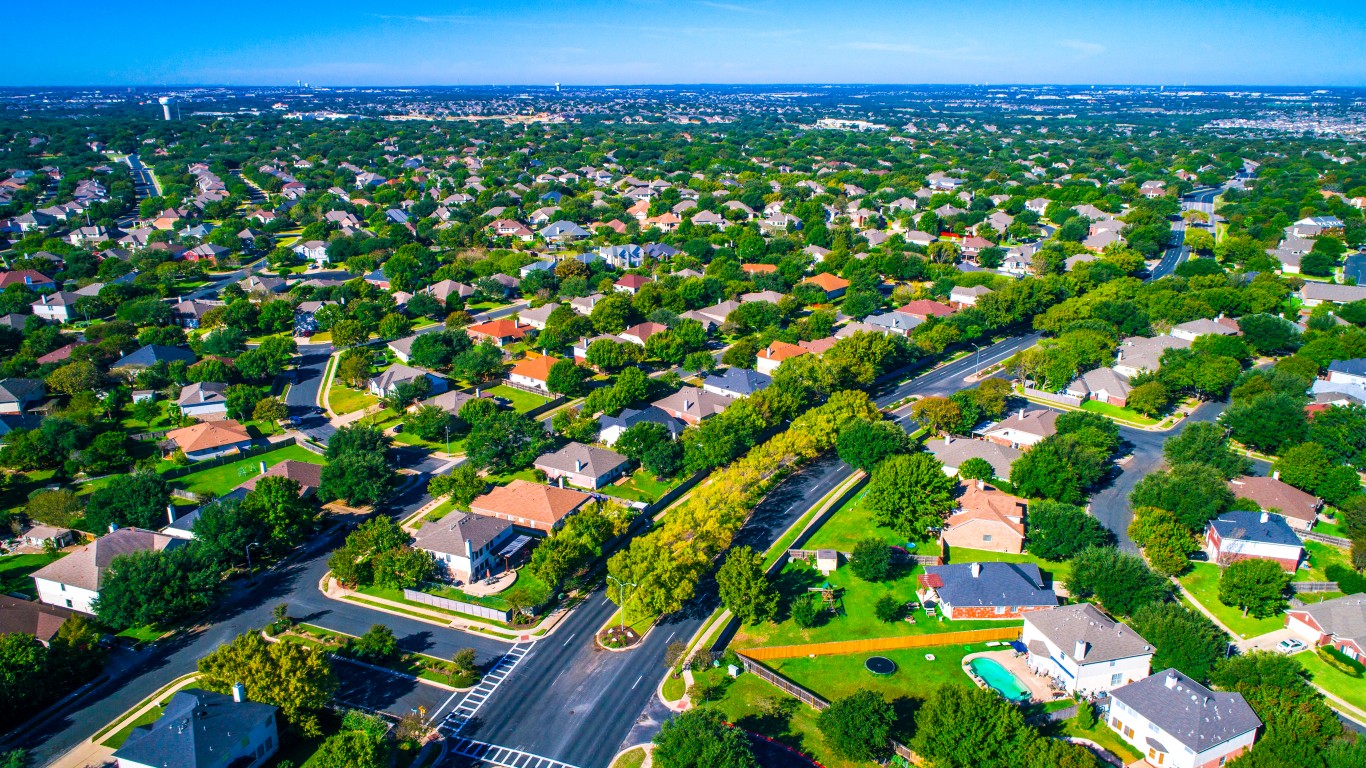
35. Austin-Round Rock-Georgetown, TX
> Change in reported vehicle theft rate, 2019-2020: +58.0
> Vehicle-thefts reported in 2020: 5,675 — 14th highest of 212 metros
> Vehicle-thefts per 100K people in 2020: 248.5 — 68th highest of 212 metros
> 1-yr. change in all property crime: -43.6 — 48th highest of 188 metros
> Property crimes per 100K people in 2020: 2,366.6 — 51st highest of 198 metros
> Population: 2,227,083
[in-text-ad]

34. Sebring-Avon Park, FL
> Change in reported vehicle theft rate, 2019-2020: +59.9
> Vehicle-thefts reported in 2020: 151 — 32nd lowest of 212 metros
> Vehicle-thefts per 100K people in 2020: 141.4 — 67th lowest of 212 metros
> 1-yr. change in all property crime: -449.0 — 21st lowest of 188 metros
> Property crimes per 100K people in 2020: 1,769.0 — 75th lowest of 198 metros
> Population: 106,221
[recirclink id=1033410]

33. Bridgeport-Stamford-Norwalk, CT
> Change in reported vehicle theft rate, 2019-2020: +60.2
> Vehicle-thefts reported in 2020: 1,923 — 36th highest of 212 metros
> Vehicle-thefts per 100K people in 2020: 207.1 — 91st highest of 212 metros
> 1-yr. change in all property crime: N/A
> Property crimes per 100K people in 2020: N/A
> Population: 943,332

32. Fairbanks, AK
> Change in reported vehicle theft rate, 2019-2020: +60.7
> Vehicle-thefts reported in 2020: 212 — 52nd lowest of 212 metros
> Vehicle-thefts per 100K people in 2020: 643.9 — 3rd highest of 212 metros
> 1-yr. change in all property crime: -284.7 — 59th lowest of 188 metros
> Property crimes per 100K people in 2020: 4,152.2 — the highest of 198 metros
> Population: 96,849
[in-text-ad-2]

31. Longview, WA
> Change in reported vehicle theft rate, 2019-2020: +61.2
> Vehicle-thefts reported in 2020: 261 — 63rd lowest of 212 metros
> Vehicle-thefts per 100K people in 2020: 234.7 — 77th highest of 212 metros
> 1-yr. change in all property crime: +123.9 — 18th highest of 188 metros
> Property crimes per 100K people in 2020: 2,000.3 — 97th highest of 198 metros
> Population: 110,593

30. Napa, CA
> Change in reported vehicle theft rate, 2019-2020: +63.6
> Vehicle-thefts reported in 2020: 273 — 67th lowest of 212 metros (tied)
> Vehicle-thefts per 100K people in 2020: 200.0 — 99th highest of 212 metros
> 1-yr. change in all property crime: +129.5 — 16th highest of 188 metros
> Property crimes per 100K people in 2020: 1,689.7 — 68th lowest of 198 metros
> Population: 137,744
[in-text-ad]

29. Santa Cruz-Watsonville, CA
> Change in reported vehicle theft rate, 2019-2020: +64.5
> Vehicle-thefts reported in 2020: 998 — 62nd highest of 212 metros (tied)
> Vehicle-thefts per 100K people in 2020: 367.4 — 32nd highest of 212 metros
> 1-yr. change in all property crime: -296.5 — 54th lowest of 188 metros
> Property crimes per 100K people in 2020: 2,266.1 — 59th highest of 198 metros
> Population: 273,213
[recirclink id=1026293]

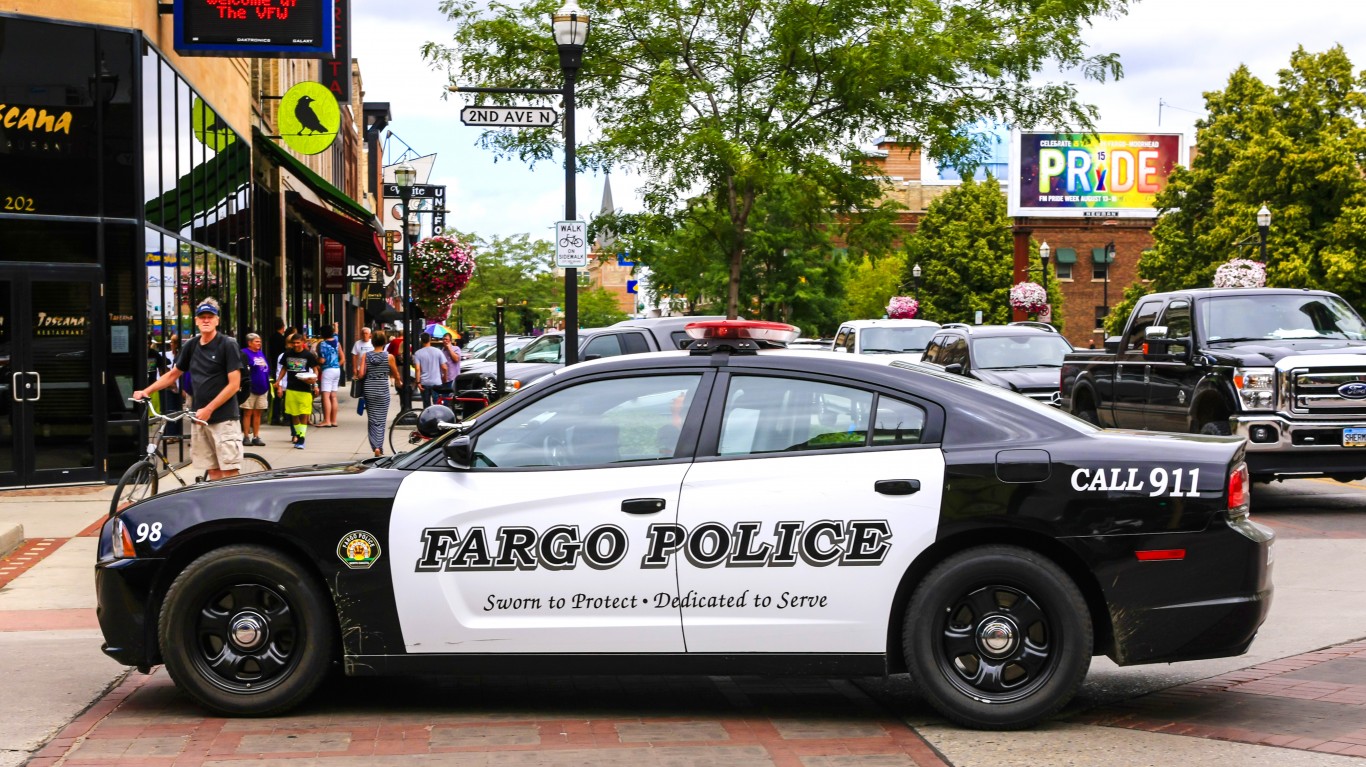
28. Fargo, ND-MN
> Change in reported vehicle theft rate, 2019-2020: +64.7
> Vehicle-thefts reported in 2020: 726 — 83rd highest of 212 metros
> Vehicle-thefts per 100K people in 2020: 292.3 — 45th highest of 212 metros
> 1-yr. change in all property crime: +490.7 — 4th highest of 188 metros
> Property crimes per 100K people in 2020: 2,829.3 — 26th highest of 198 metros
> Population: 246,145

27. Idaho Falls, ID
> Change in reported vehicle theft rate, 2019-2020: +65.0
> Vehicle-thefts reported in 2020: 219 — 55th lowest of 212 metros
> Vehicle-thefts per 100K people in 2020: 141.5 — 68th lowest of 212 metros
> 1-yr. change in all property crime: +199.1 — 14th highest of 188 metros
> Property crimes per 100K people in 2020: 1,288.2 — 33rd lowest of 198 metros
> Population: 151,516
[in-text-ad-2]
26. Jonesboro, AR
> Change in reported vehicle theft rate, 2019-2020: +67.9
> Vehicle-thefts reported in 2020: 330 — 80th lowest of 212 metros
> Vehicle-thefts per 100K people in 2020: 243.8 — 71st highest of 212 metros
> 1-yr. change in all property crime: -152.2 — 82nd highest of 188 metros
> Property crimes per 100K people in 2020: 2,928.1 — 21st highest of 198 metros
> Population: 133,860

25. Davenport-Moline-Rock Island, IA-IL
> Change in reported vehicle theft rate, 2019-2020: +71.7
> Vehicle-thefts reported in 2020: 950 — 66th highest of 212 metros
> Vehicle-thefts per 100K people in 2020: 251.4 — 66th highest of 212 metros
> 1-yr. change in all property crime: N/A
> Property crimes per 100K people in 2020: N/A
> Population: 378,923
[in-text-ad]
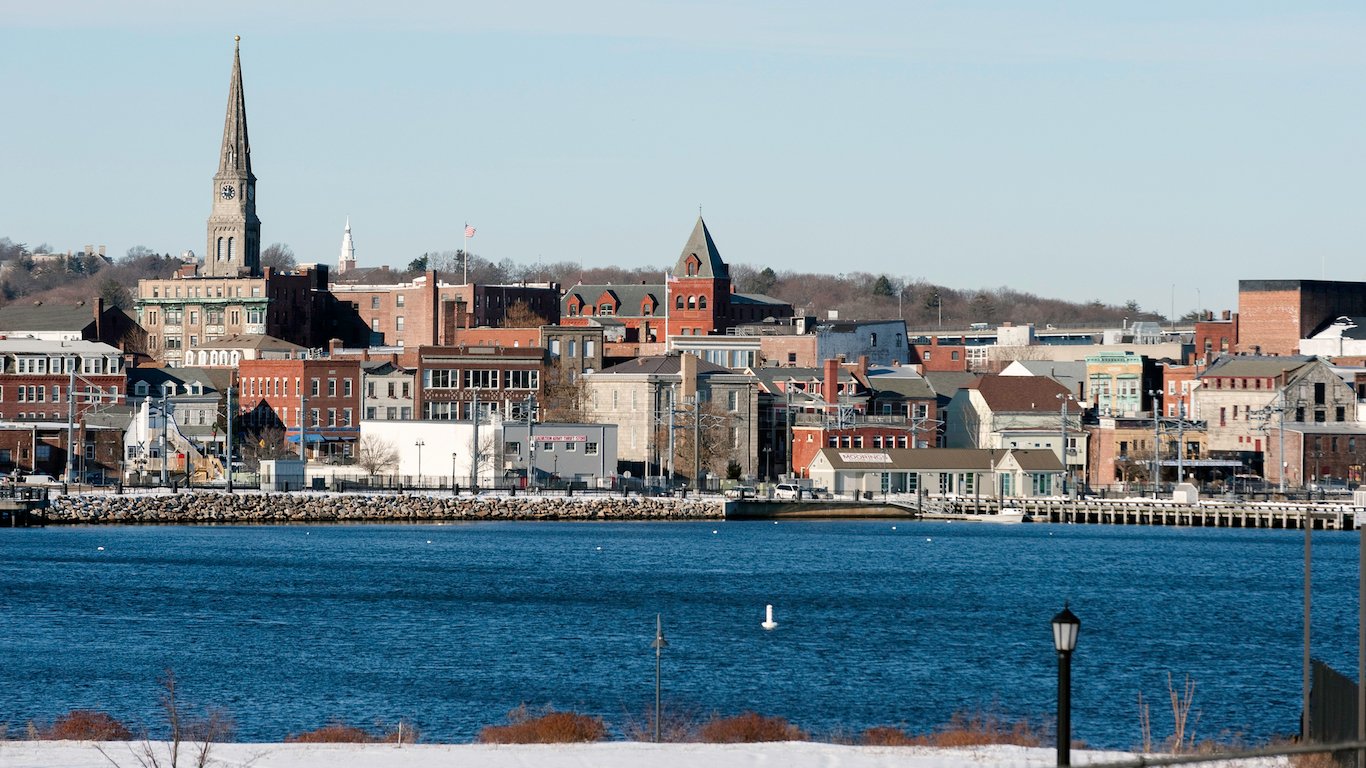
24. Norwich-New London, CT
> Change in reported vehicle theft rate, 2019-2020: +71.9
> Vehicle-thefts reported in 2020: 273 — 67th lowest of 212 metros (tied)
> Vehicle-thefts per 100K people in 2020: 157.1 — 83rd lowest of 212 metros
> 1-yr. change in all property crime: -56.2 — 52nd highest of 188 metros
> Property crimes per 100K people in 2020: 1,271.6 — 29th lowest of 198 metros
> Population: 265,206
[recirclink id=1016086]

23. Springfield, OH
> Change in reported vehicle theft rate, 2019-2020: +74.8
> Vehicle-thefts reported in 2020: 369 — 91st lowest of 212 metros
> Vehicle-thefts per 100K people in 2020: 276.5 — 56th highest of 212 metros
> 1-yr. change in all property crime: +246.8 — 11th highest of 188 metros
> Property crimes per 100K people in 2020: 2,901.3 — 22nd highest of 198 metros
> Population: 134,083

22. Owensboro, KY
> Change in reported vehicle theft rate, 2019-2020: +79.8
> Vehicle-thefts reported in 2020: 351 — 85th lowest of 212 metros (tied)
> Vehicle-thefts per 100K people in 2020: 292.9 — 44th highest of 212 metros
> 1-yr. change in all property crime: -98.6 — 64th highest of 188 metros
> Property crimes per 100K people in 2020: 2,330.6 — 55th highest of 198 metros
> Population: 121,128
[in-text-ad-2]

21. Alexandria, LA
> Change in reported vehicle theft rate, 2019-2020: +81.3
> Vehicle-thefts reported in 2020: 534 — 102nd highest of 212 metros
> Vehicle-thefts per 100K people in 2020: 353.0 — 34th highest of 212 metros
> 1-yr. change in all property crime: -520.0 — 10th lowest of 188 metros
> Property crimes per 100K people in 2020: 4,018.7 — 2nd highest of 198 metros
> Population: 152,037

20. Buffalo-Cheektowaga, NY
> Change in reported vehicle theft rate, 2019-2020: +86.7
> Vehicle-thefts reported in 2020: 2,183 — 30th highest of 212 metros
> Vehicle-thefts per 100K people in 2020: 194.9 — 102nd highest of 212 metros
> 1-yr. change in all property crime: +57.9 — 28th highest of 188 metros
> Property crimes per 100K people in 2020: 1,926.3 — 93rd lowest of 198 metros
> Population: 1,127,983
[in-text-ad]
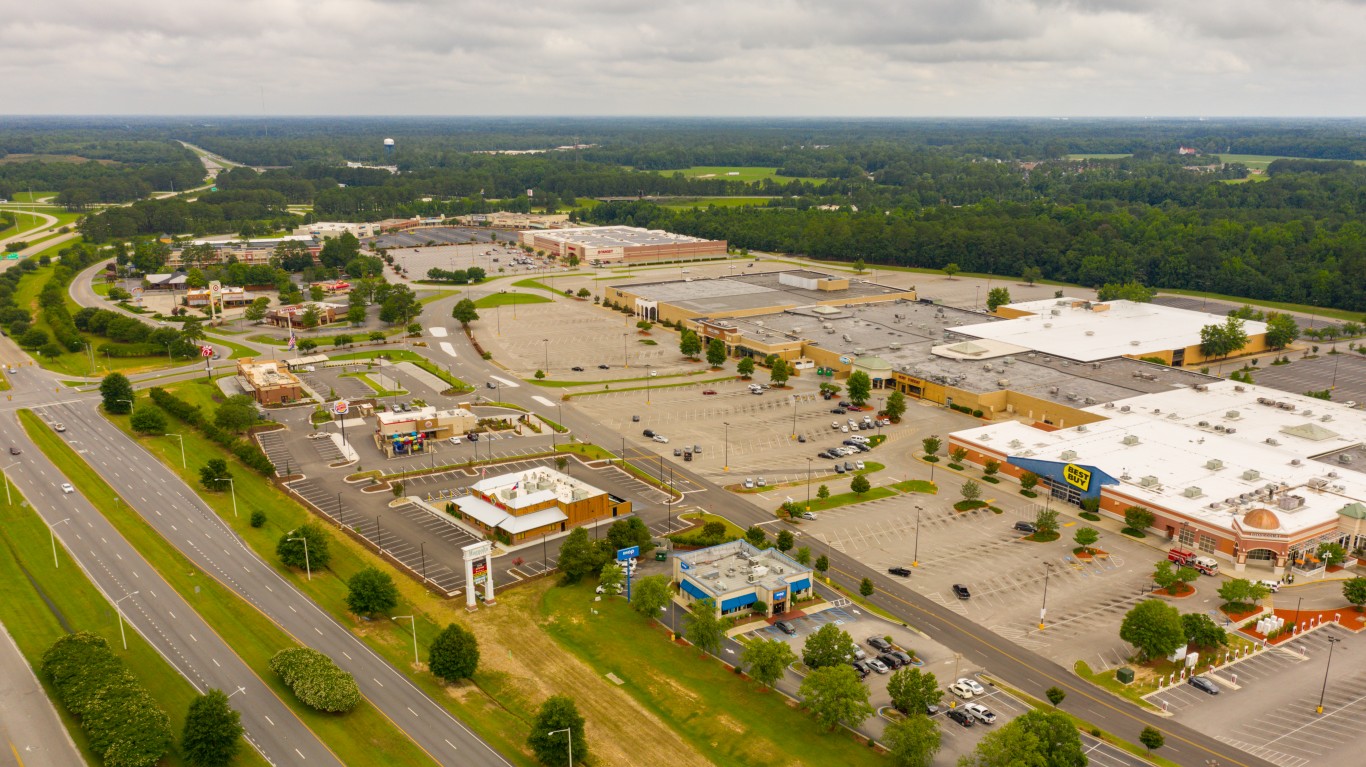
19. Florence, SC
> Change in reported vehicle theft rate, 2019-2020: +87.7
> Vehicle-thefts reported in 2020: 828 — 78th highest of 212 metros
> Vehicle-thefts per 100K people in 2020: 403.8 — 21st highest of 212 metros
> 1-yr. change in all property crime: -458.4 — 20th lowest of 188 metros
> Property crimes per 100K people in 2020: 3,600.8 — 6th highest of 198 metros
> Population: 204,911
[recirclink id=1062431]

18. Danville, IL
> Change in reported vehicle theft rate, 2019-2020: +87.8
> Vehicle-thefts reported in 2020: 170 — 41st lowest of 212 metros
> Vehicle-thefts per 100K people in 2020: 227.5 — 81st highest of 212 metros
> 1-yr. change in all property crime: N/A
> Property crimes per 100K people in 2020: N/A
> Population: 75,758

17. Boulder, CO
> Change in reported vehicle theft rate, 2019-2020: +91.2
> Vehicle-thefts reported in 2020: 995 — 64th highest of 212 metros
> Vehicle-thefts per 100K people in 2020: 303.6 — 43rd highest of 212 metros
> 1-yr. change in all property crime: +314.5 — 7th highest of 188 metros
> Property crimes per 100K people in 2020: 2,760.1 — 27th highest of 198 metros
> Population: 326,196
[in-text-ad-2]

16. Cedar Rapids, IA
> Change in reported vehicle theft rate, 2019-2020: +91.9
> Vehicle-thefts reported in 2020: 736 — 81st highest of 212 metros
> Vehicle-thefts per 100K people in 2020: 268.3 — 59th highest of 212 metros
> 1-yr. change in all property crime: +74.6 — 26th highest of 188 metros
> Property crimes per 100K people in 2020: 2,115.5 — 81st highest of 198 metros
> Population: 273,032

15. Bellingham, WA
> Change in reported vehicle theft rate, 2019-2020: +92.5
> Vehicle-thefts reported in 2020: 445 — 102nd lowest of 212 metros
> Vehicle-thefts per 100K people in 2020: 192.0 — 105th highest of 212 metros
> 1-yr. change in all property crime: +254.4 — 10th highest of 188 metros
> Property crimes per 100K people in 2020: 2,355.2 — 52nd highest of 198 metros
> Population: 229,247
[in-text-ad]

14. San Jose-Sunnyvale-Santa Clara, CA
> Change in reported vehicle theft rate, 2019-2020: +97.7
> Vehicle-thefts reported in 2020: 10,058 — 8th highest of 212 metros
> Vehicle-thefts per 100K people in 2020: 506.0 — 9th highest of 212 metros
> 1-yr. change in all property crime: -174.0 — 94th highest of 188 metros
> Property crimes per 100K people in 2020: 2,226.6 — 63rd highest of 198 metros
> Population: 1,990,660
[recirclink id=1066891]

13. Sioux Falls, SD
> Change in reported vehicle theft rate, 2019-2020: +99.2
> Vehicle-thefts reported in 2020: 1,040 — 58th highest of 212 metros
> Vehicle-thefts per 100K people in 2020: 381.0 — 26th highest of 212 metros
> 1-yr. change in all property crime: +97.1 — 20th highest of 188 metros
> Property crimes per 100K people in 2020: 2,524.2 — 40th highest of 198 metros
> Population: 268,833

12. Hanford-Corcoran, CA
> Change in reported vehicle theft rate, 2019-2020: +105.0
> Vehicle-thefts reported in 2020: 557 — 100th highest of 212 metros
> Vehicle-thefts per 100K people in 2020: 367.7 — 31st highest of 212 metros
> 1-yr. change in all property crime: +10.0 — 35th highest of 188 metros
> Property crimes per 100K people in 2020: 1,654.4 — 64th lowest of 198 metros
> Population: 152,940
[in-text-ad-2]

11. Los Angeles-Long Beach-Anaheim, CA
> Change in reported vehicle theft rate, 2019-2020: +114.8
> Vehicle-thefts reported in 2020: 58,823 — the highest of 212 metros
> Vehicle-thefts per 100K people in 2020: 448.2 — 14th highest of 212 metros
> 1-yr. change in all property crime: -45.6 — 49th highest of 188 metros
> Property crimes per 100K people in 2020: 2,095.1 — 84th highest of 198 metros
> Population: 13,214,799

10. Salem, OR
> Change in reported vehicle theft rate, 2019-2020: +116.2
> Vehicle-thefts reported in 2020: 2,098 — 32nd highest of 212 metros
> Vehicle-thefts per 100K people in 2020: 480.4 — 12th highest of 212 metros
> 1-yr. change in all property crime: +84.6 — 23rd highest of 188 metros
> Property crimes per 100K people in 2020: 2,853.6 — 24th highest of 198 metros
> Population: 433,903
[in-text-ad]

9. Rapid City, SD
> Change in reported vehicle theft rate, 2019-2020: +116.7
> Vehicle-thefts reported in 2020: 584 — 95th highest of 212 metros
> Vehicle-thefts per 100K people in 2020: 405.9 — 18th highest of 212 metros
> 1-yr. change in all property crime: +568.2 — the highest of 188 metros
> Property crimes per 100K people in 2020: 2,971.1 — 20th highest of 198 metros
> Population: 142,191
[recirclink id=1033410]
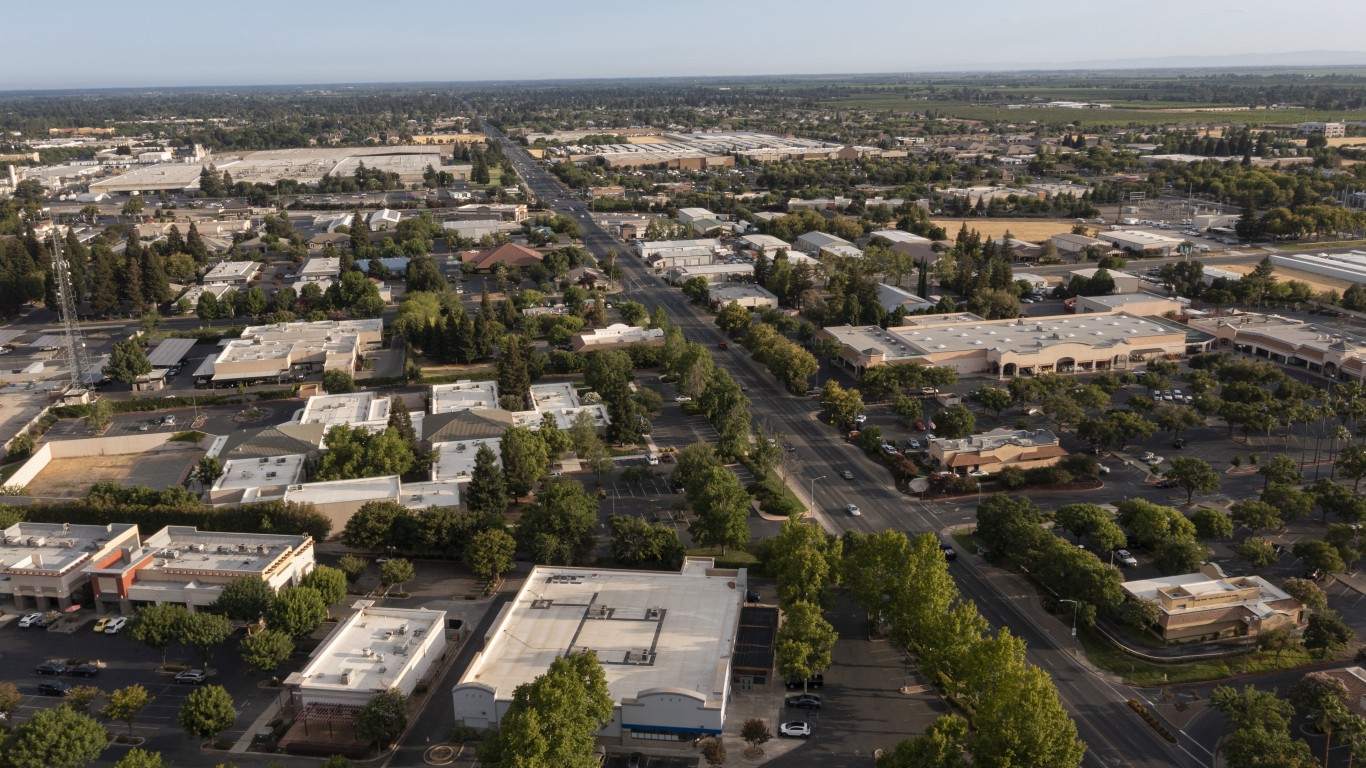
8. Yuba City, CA
> Change in reported vehicle theft rate, 2019-2020: +119.9
> Vehicle-thefts reported in 2020: 1,039 — 59th highest of 212 metros
> Vehicle-thefts per 100K people in 2020: 594.2 — 6th highest of 212 metros
> 1-yr. change in all property crime: -21.2 — 41st highest of 188 metros
> Property crimes per 100K people in 2020: 2,439.7 — 46th highest of 198 metros
> Population: 175,639

7. Grand Junction, CO
> Change in reported vehicle theft rate, 2019-2020: +128.9
> Vehicle-thefts reported in 2020: 482 — 105th highest of 212 metros
> Vehicle-thefts per 100K people in 2020: 312.7 — 38th highest of 212 metros
> 1-yr. change in all property crime: +443.3 — 6th highest of 188 metros
> Property crimes per 100K people in 2020: 2,980.7 — 19th highest of 198 metros
> Population: 154,210
[in-text-ad-2]
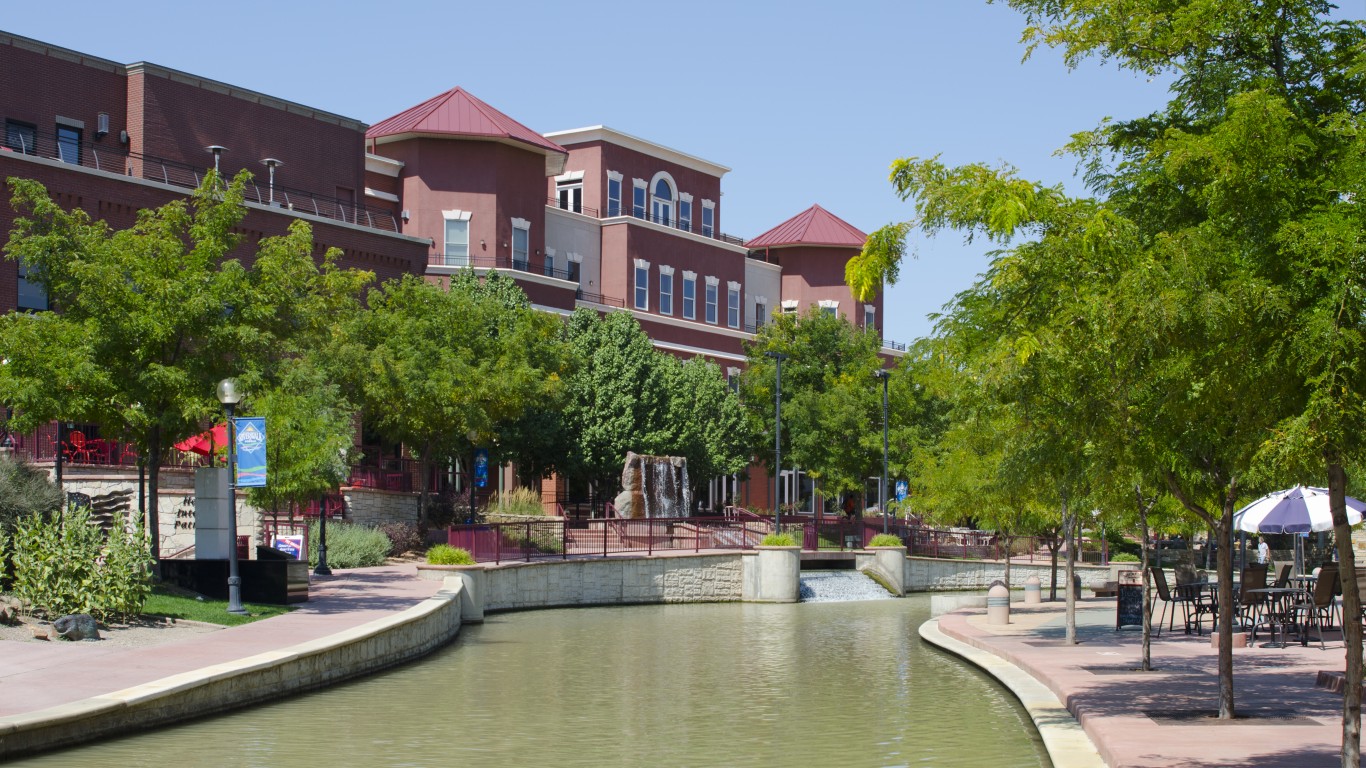
6. Pueblo, CO
> Change in reported vehicle theft rate, 2019-2020: +131.4
> Vehicle-thefts reported in 2020: 1,078 — 53rd highest of 212 metros
> Vehicle-thefts per 100K people in 2020: 640.2 — 4th highest of 212 metros
> 1-yr. change in all property crime: N/A
> Property crimes per 100K people in 2020: N/A
> Population: 168,424
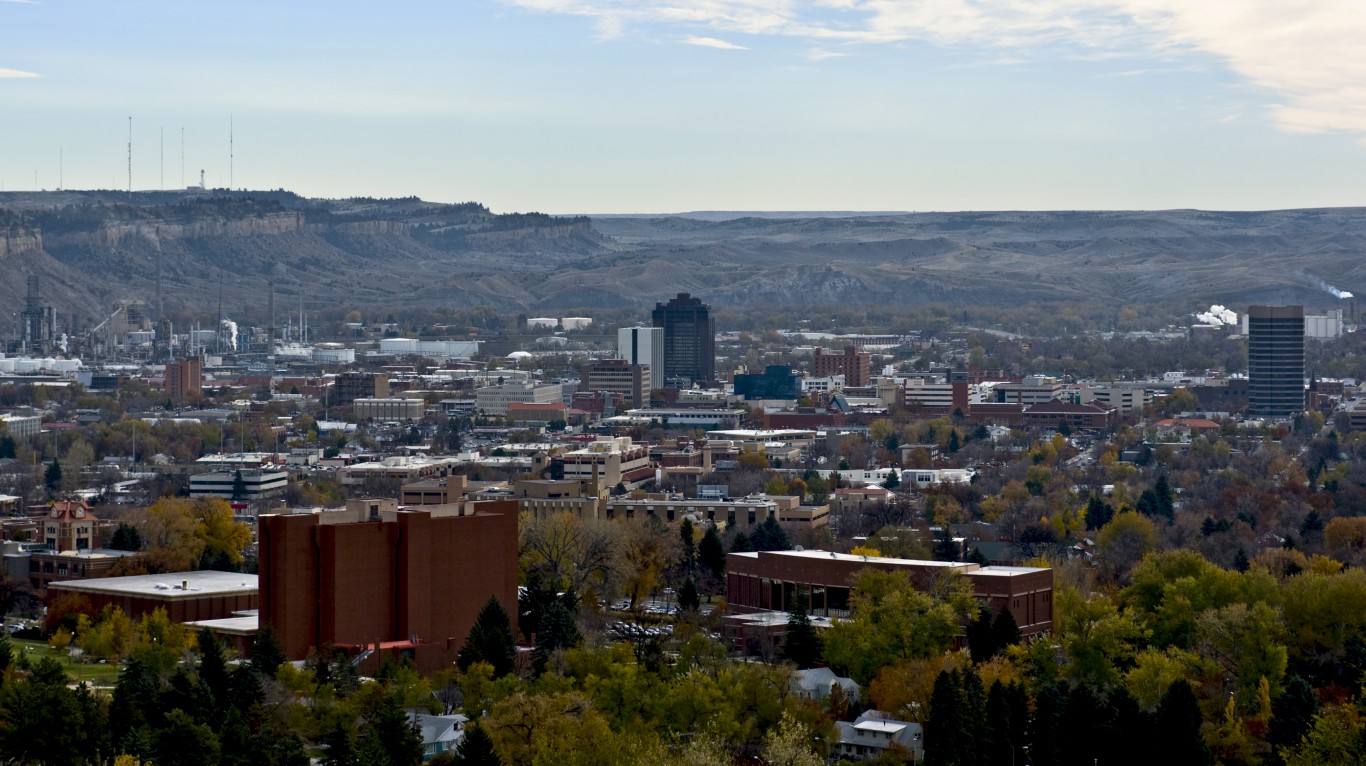
5. Billings, MT
> Change in reported vehicle theft rate, 2019-2020: +136.1
> Vehicle-thefts reported in 2020: 998 — 62nd highest of 212 metros (tied)
> Vehicle-thefts per 100K people in 2020: 543.3 — 7th highest of 212 metros
> 1-yr. change in all property crime: +459.4 — 5th highest of 188 metros
> Property crimes per 100K people in 2020: 3,471.9 — 11th highest of 198 metros
> Population: 181,667
[in-text-ad]

4. Kalamazoo-Portage, MI
> Change in reported vehicle theft rate, 2019-2020: +136.4
> Vehicle-thefts reported in 2020: 1,074 — 54th highest of 212 metros
> Vehicle-thefts per 100K people in 2020: 404.1 — 20th highest of 212 metros
> 1-yr. change in all property crime: +80.1 — 25th highest of 188 metros
> Property crimes per 100K people in 2020: 3,306.6 — 13th highest of 198 metros
> Population: 265,066
[recirclink id=1026293]

3. San Francisco-Oakland-Berkeley, CA
> Change in reported vehicle theft rate, 2019-2020: +159.2
> Vehicle-thefts reported in 2020: 28,575 — 2nd highest of 212 metros
> Vehicle-thefts per 100K people in 2020: 604.2 — 5th highest of 212 metros
> 1-yr. change in all property crime: -515.4 — 12th lowest of 188 metros
> Property crimes per 100K people in 2020: 3,008.2 — 18th highest of 198 metros
> Population: 4,731,803

2. Greeley, CO
> Change in reported vehicle theft rate, 2019-2020: +175.1
> Vehicle-thefts reported in 2020: 1,251 — 47th highest of 212 metros
> Vehicle-thefts per 100K people in 2020: 377.6 — 29th highest of 212 metros
> 1-yr. change in all property crime: +530.5 — 3rd highest of 188 metros
> Property crimes per 100K people in 2020: 2,162.8 — 70th highest of 198 metros
> Population: 324,492
[in-text-ad-2]
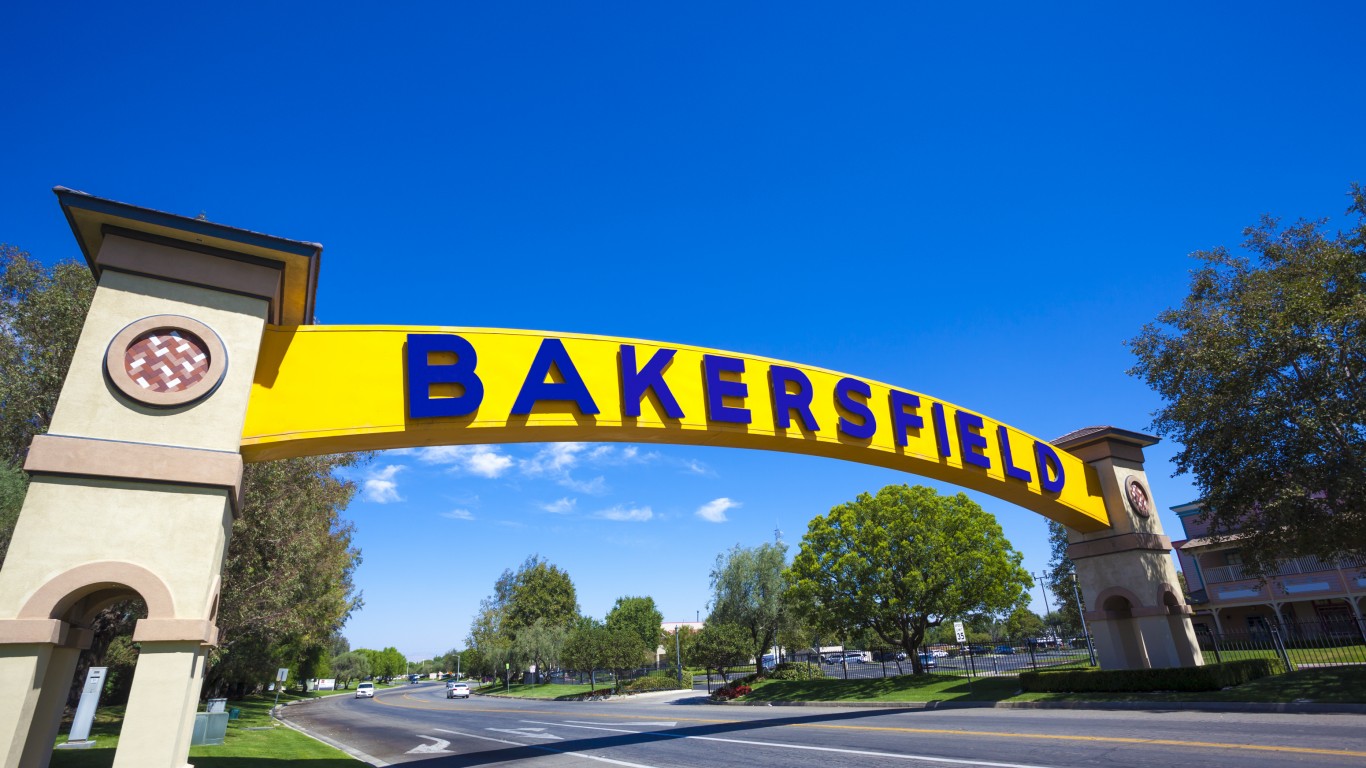
1. Bakersfield, CA
> Change in reported vehicle theft rate, 2019-2020: +183.0
> Vehicle-thefts reported in 2020: 7,537 — 11th highest of 212 metros
> Vehicle-thefts per 100K people in 2020: 839.4 — the highest of 212 metros
> 1-yr. change in all property crime: -196.7 — 81st lowest of 188 metros
> Property crimes per 100K people in 2020: 3,106.0 — 16th highest of 198 metros
> Population: 900,202
Methodology
To determine the 50 metro areas where the motor vehicle theft rate is rising fastest, 24/7 Wall St. reviewed the change in motor vehicle thefts per 100,000 people from the FBI’s 2019 and 2020 Uniform Crime Reports. Crime rates were calculated using population figures provided by the FBI in the 2020 and 2019 UCR.
Limited data was available in the 2020 UCR for areas in Alabama, Maryland, Pennsylvania, and Illinois, though metro areas in these states were not excluded from analysis. Only metro areas for which the boundaries defined by the FBI match the boundaries as defined by the U.S. Census Bureau were considered. Because some state and local agencies changed reporting practices between 2019 and 2020, the figures are not comparable, and the areas were excluded.
Population figures are five-year estimates from the U.S. Census Bureau’s 2019 American Community Survey.
Contact [email protected] for any questions or corrections.