During the early months of the COVID-19 pandemic, Americans essentially sheltered in place. According to the Pew Research Center, residential relocations in 2020 hit its lowest rate since the government began tracking that data more than seven decades earlier.
Though a smaller share of Americans relocated domestically, millions still did, affecting population sizes in some states, cities, and counties. Now we have an idea of the places where the population declined the most from the summer of 2020 to the summer of 2021. (These are the 16 states where the population shrank since the pandemic started.)
To identify the 50 counties that shrunk the most in the last year, 24/7 Wall St. reviewed population data from the U.S. Census Bureau. U.S. counties and county equivalents were ranked based on the percent change in residents from July 1, 2020, to July 1, 2021.
The 50 U.S. counties (or county equivalents like boroughs, municipalities, or parishes) whose populations declined the most during the first year of the COVID-19 pandemic vary in size, from tiny Loving County, Texas, population 57, to Kings County, New York, (Brooklyn) population 2.6 million. These 50 counties are home to about 12.4 million Americans, based on 2021 U.S. Census Bureau data.
The net population loss in these 50 counties ranged from 2.5% to nearly 15%. While the median population of these counties was 5,045, nine represent 94% of the total population of these 50 counties. These most densely-populated nine counties include San Francisco, Washington D.C., and four of New York City’s five boroughs.
In other words, while Loving County’s net loss of just 10 residents amounted to a 15% decline in population in the 12 months to July 1, 2021, New York County’s net loss of 110,000 residents during that time amounted to a 6.6% drop in Manhattan’s population. (Find out if any of the counties on the list are among the worst counties to live in.)
A dozen of these 50 counties are located in Texas, but they represent only 193,000 residents. By comparison, five counties or boroughs in New York that experienced an average net decline in population of 3.6% during the pandemic are home to about 8 million residents, or 64% of the total population of counties on this list.
Click here to see these counties shrunk the most in the last year
Click here to read our detailed methodology
50. Oldham County, Texas
> Net population change, 2020-2021: -2.5% (-44 people)
> Net change from migration: -43 people
> Natural population change: None
> Total population, 2021: 1,717
> Largest place in county: Vega
[in-text-ad]

49. Lake and Peninsula Borough, Alaska
> Net population change, 2020-2021: -2.6% (-38 people)
> Net change from migration: -42 people
> Natural population change: +4 people
> Total population, 2021: 1,416
> Largest place in county: Kokhanok
[recirclink id=1043576]

48. Bowman County, North Dakota
> Net population change, 2020-2021: -2.6% (-78 people)
> Net change from migration: -71 people
> Natural population change: -6 people
> Total population, 2021: 2,903
> Largest place in county: Bowman
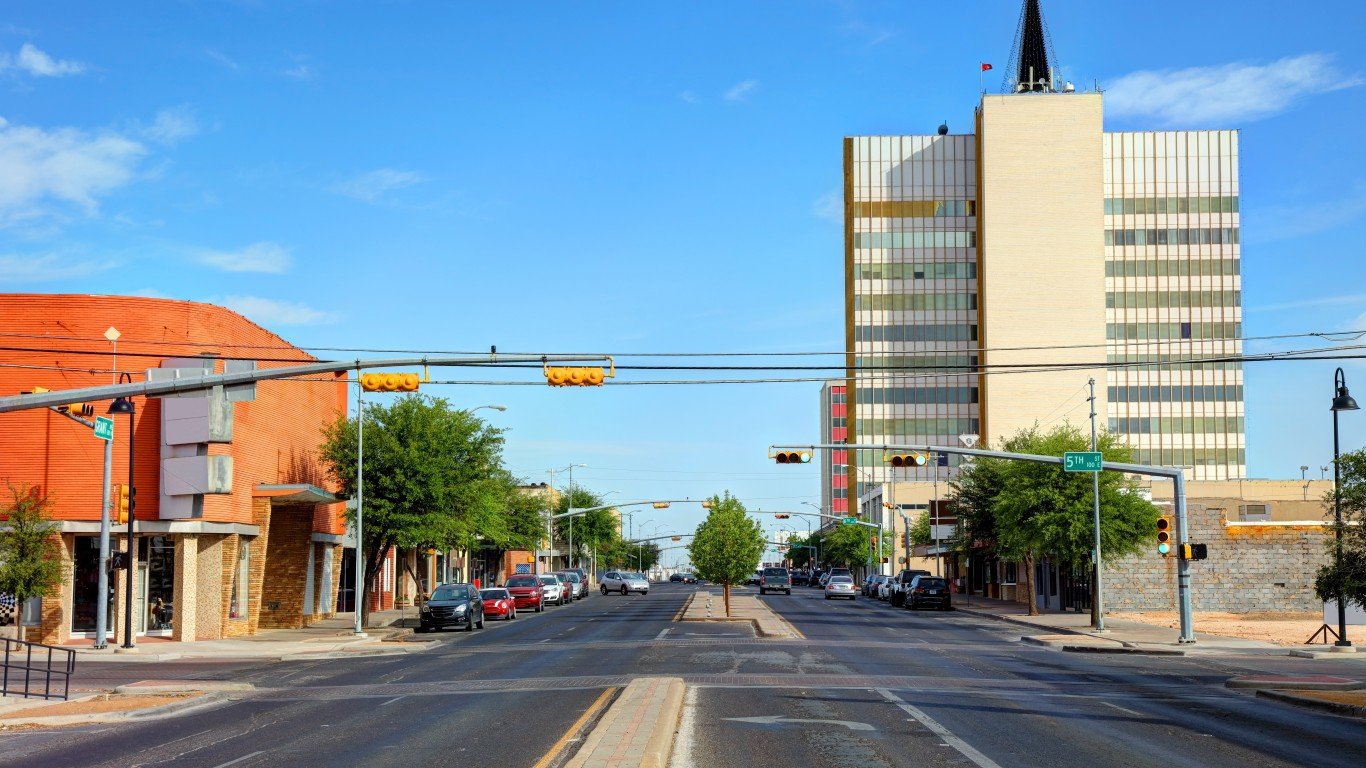
47. Ector County, Texas
> Net population change, 2020-2021: -2.6% (-4,376 people)
> Net change from migration: -5,878 people
> Natural population change: +1,592 people
> Total population, 2021: 161,091
> Largest place in county: Odessa
[in-text-ad-2]
46. Alexander County, Illinois
> Net population change, 2020-2021: -2.7% (-138 people)
> Net change from migration: -84 people
> Natural population change: -52 people
> Total population, 2021: 5,030
> Largest place in county: Cairo

45. Terrell County, Texas
> Net population change, 2020-2021: -2.7% (-20 people)
> Net change from migration: -17 people
> Natural population change: -2 people
> Total population, 2021: 724
> Largest place in county: Sanderson
[in-text-ad]
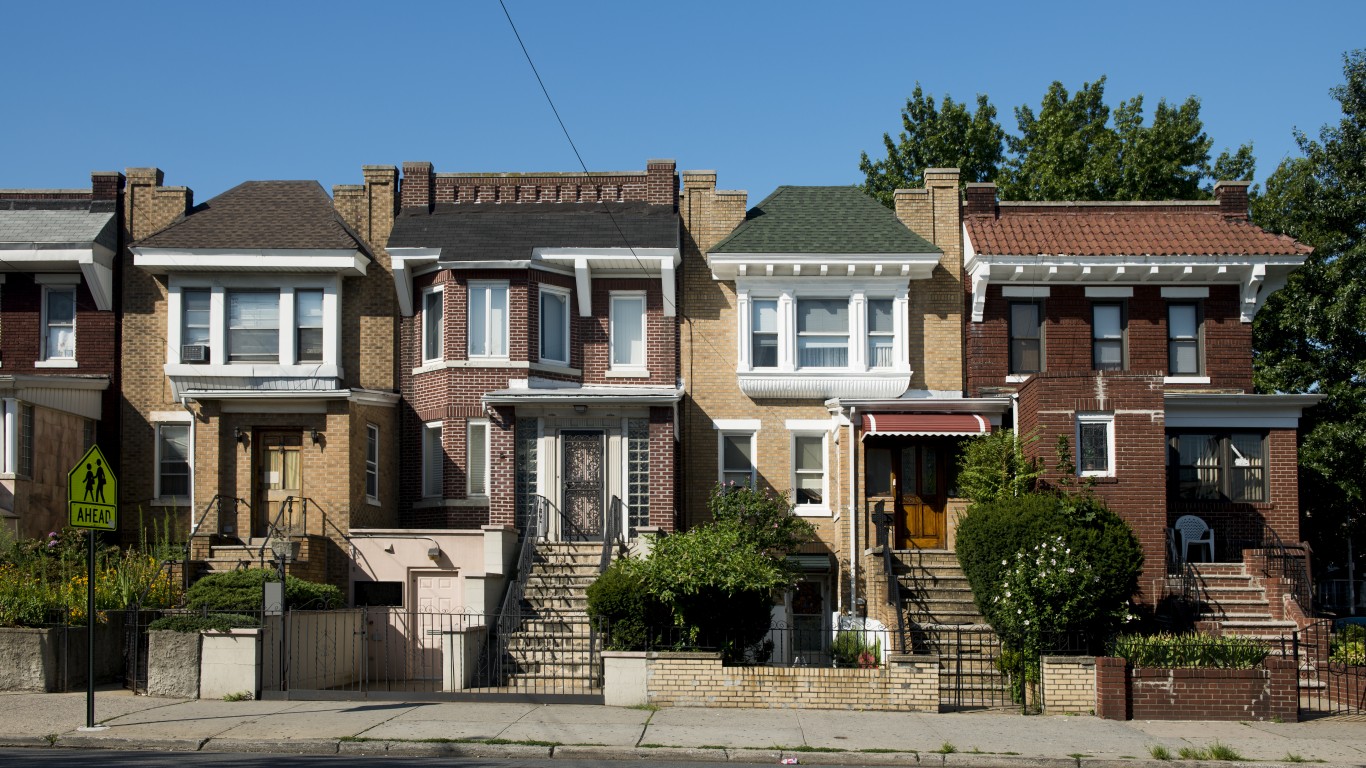
44. Queens County, New York
> Net population change, 2020-2021: -2.7% (-64,648 people)
> Net change from migration: -70,420 people
> Natural population change: +6,823 people
> Total population, 2021: 2,331,143
> Largest place in county: Queens (NYC)
[recirclink id=1063362]

43. Alexandria city, Virginia
> Net population change, 2020-2021: -2.8% (-4,391 people)
> Net change from migration: -5,580 people
> Natural population change: +1,290 people
> Total population, 2021: 154,706
> Largest place in county: Alexandria

42. Sharkey County, Mississippi
> Net population change, 2020-2021: -2.8% (-104 people)
> Net change from migration: -94 people
> Natural population change: -8 people
> Total population, 2021: 3,663
> Largest place in county: Rolling Fork
[in-text-ad-2]

41. Phillips County, Kansas
> Net population change, 2020-2021: -2.8% (-138 people)
> Net change from migration: -103 people
> Natural population change: -33 people
> Total population, 2021: 4,815
> Largest place in county: Phillipsburg

40. Hudson County, New Jersey
> Net population change, 2020-2021: -2.8% (-20,192 people)
> Net change from migration: -23,731 people
> Natural population change: +3,925 people
> Total population, 2021: 702,463
> Largest place in county: Jersey City
[in-text-ad]
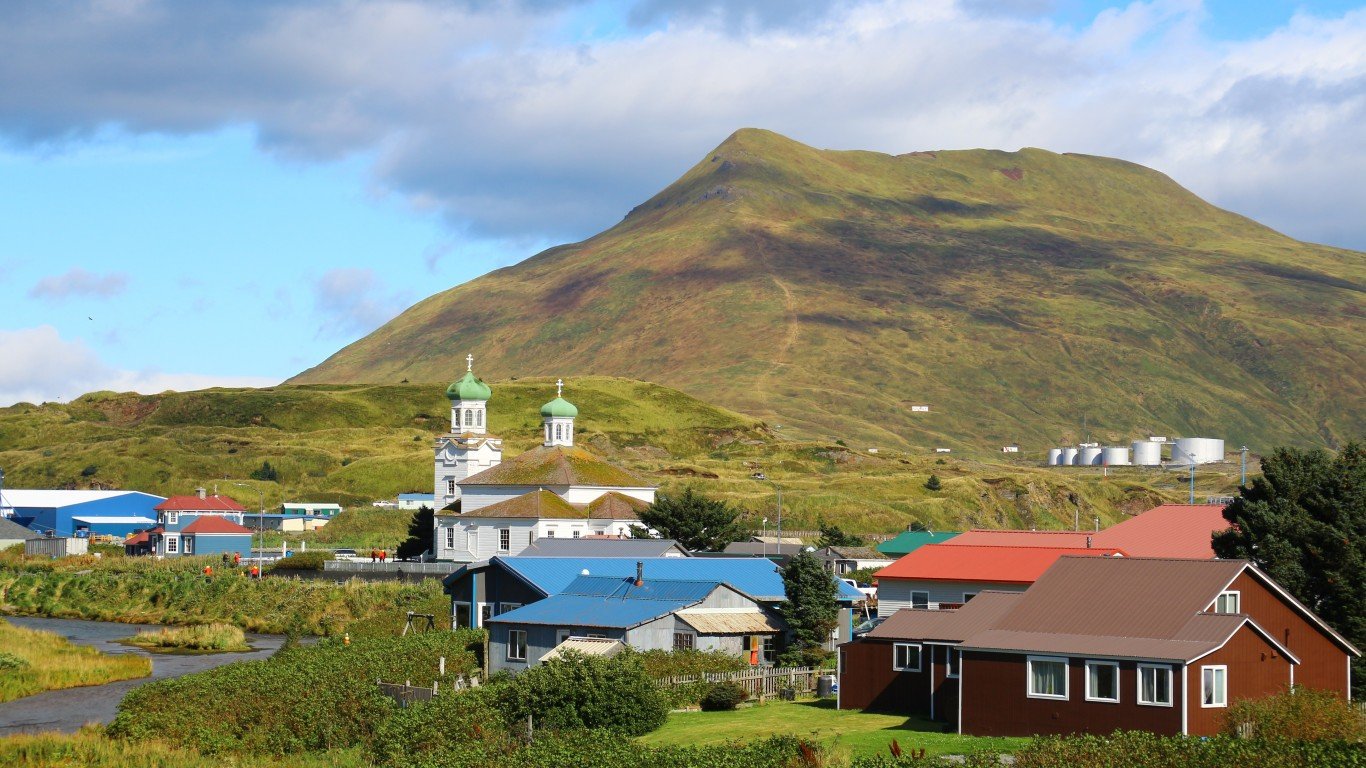
39. Aleutians West Census Area, Alaska
> Net population change, 2020-2021: -2.8% (-147 people)
> Net change from migration: -160 people
> Natural population change: +15 people
> Total population, 2021: 5,059
> Largest place in county: Unalaska
[recirclink id=1041933]

38. Bronx County, New York
> Net population change, 2020-2021: -2.8% (-41,490 people)
> Net change from migration: -46,308 people
> Natural population change: +5,551 people
> Total population, 2021: 1,424,948
> Largest place in county: The Bronx (NYC)
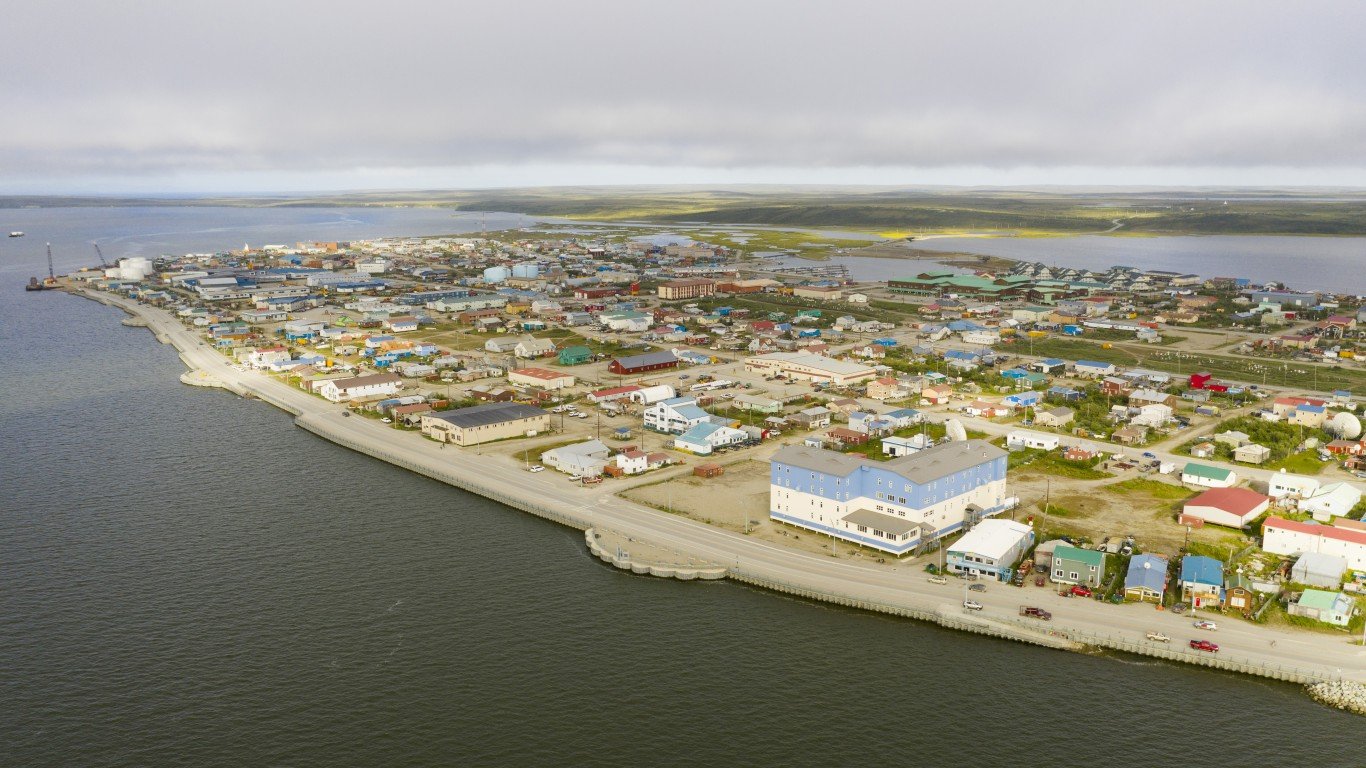
37. Northwest Arctic Borough, Alaska
> Net population change, 2020-2021: -2.9% (-224 people)
> Net change from migration: -312 people
> Natural population change: +93 people
> Total population, 2021: 7,560
> Largest place in county: Kotzebue
[in-text-ad-2]
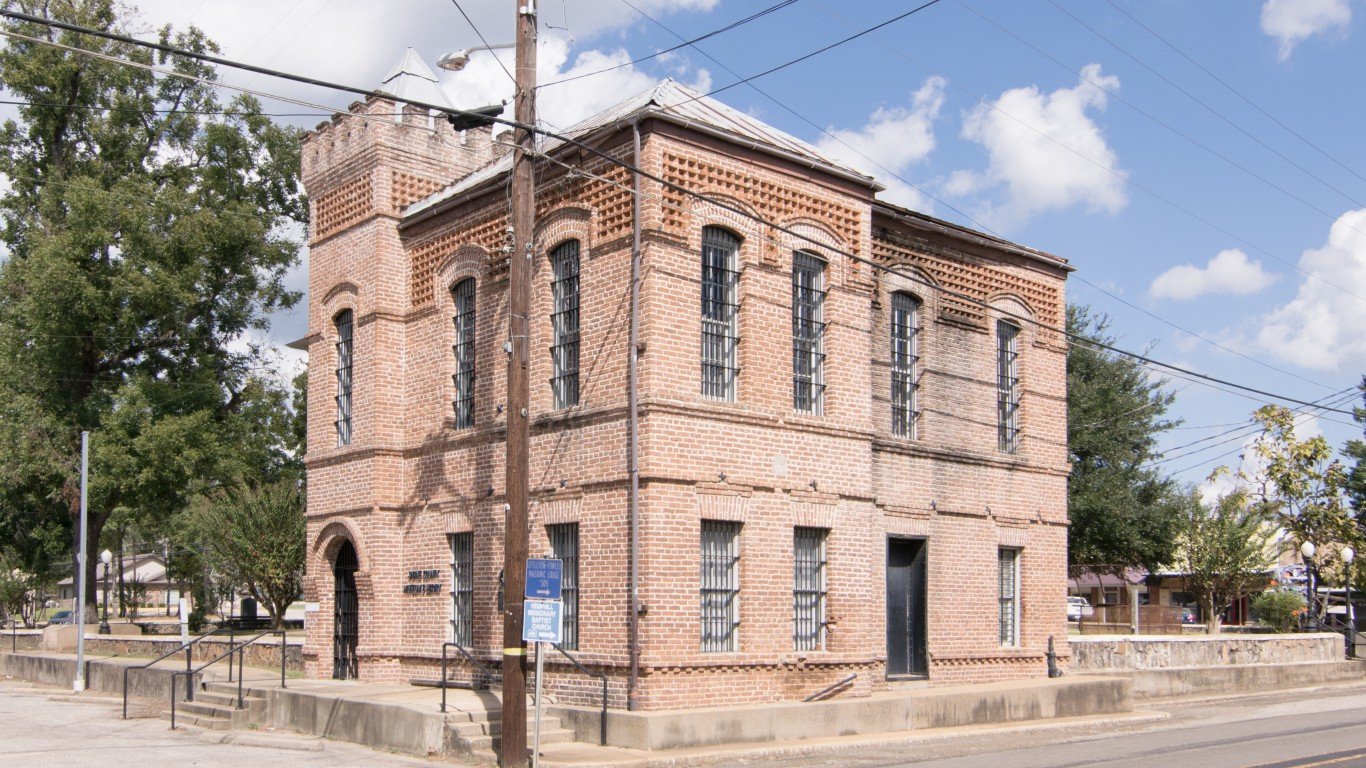
36. Hemphill County, Texas
> Net population change, 2020-2021: -2.9% (-97 people)
> Net change from migration: -90 people
> Natural population change: -7 people
> Total population, 2021: 3,271
> Largest place in county: Canadian

35. Wichita County, Kansas
> Net population change, 2020-2021: -2.9% (-62 people)
> Net change from migration: -66 people
> Natural population change: +6 people
> Total population, 2021: 2,082
> Largest place in county: Leoti
[in-text-ad]

34. Washington, District of Columbia
> Net population change, 2020-2021: -2.9% (-20,043 people)
> Net change from migration: -21,902 people
> Natural population change: +2,171 people
> Total population, 2021: 670,050
> Largest place in county: Washington, D.C.
[recirclink id=1060074]
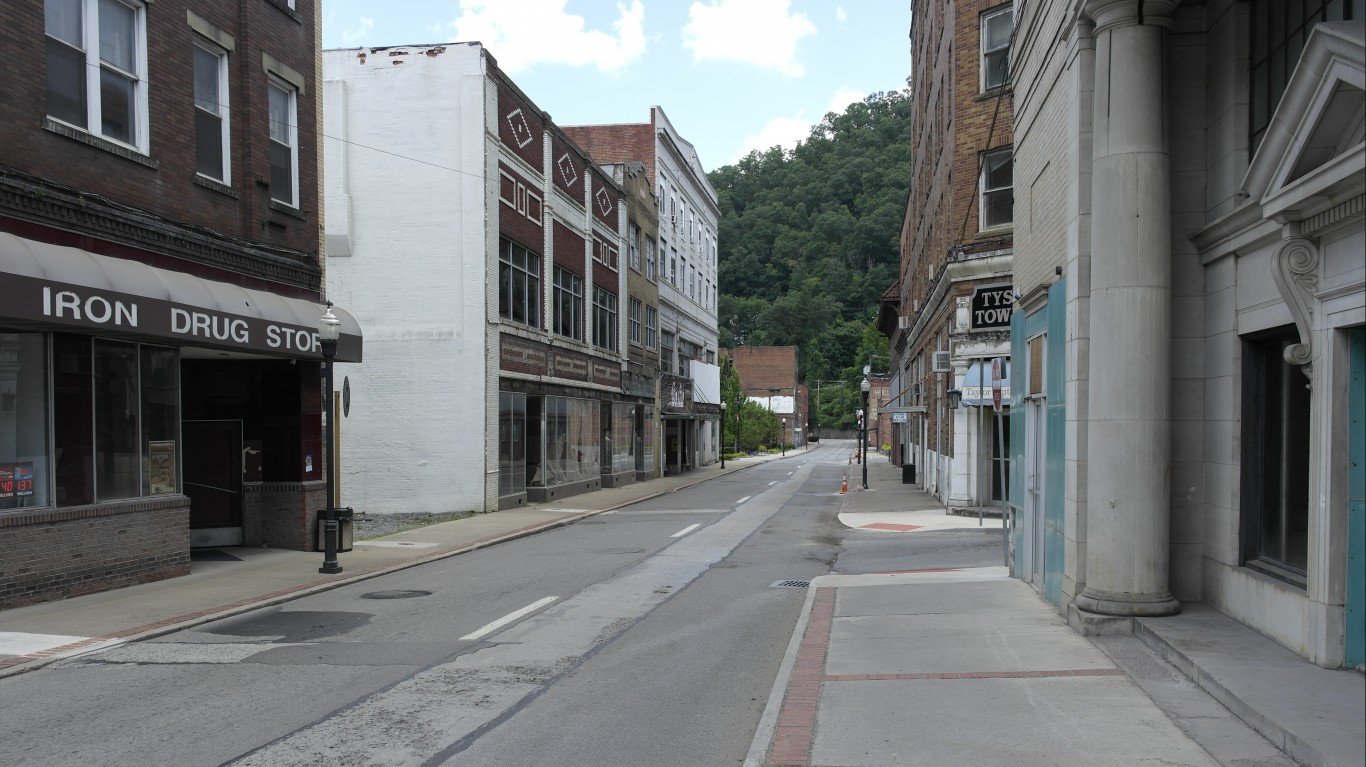
33. McDowell County, West Virginia
> Net population change, 2020-2021: -2.9% (-553 people)
> Net change from migration: -340 people
> Natural population change: -209 people
> Total population, 2021: 18,363
> Largest place in county: Welch

32. Macon County, Alabama
> Net population change, 2020-2021: -3.0% (-581 people)
> Net change from migration: -409 people
> Natural population change: -166 people
> Total population, 2021: 18,895
> Largest place in county: Tuskegee
[in-text-ad-2]

31. Suffolk County, Massachusetts
> Net population change, 2020-2021: -3.0% (-24,186 people)
> Net change from migration: -25,884 people
> Natural population change: +2,110 people
> Total population, 2021: 771,245
> Largest place in county: Boston
30. Roberts County, Texas
> Net population change, 2020-2021: -3.2% (-26 people)
> Net change from migration: -20 people
> Natural population change: -6 people
> Total population, 2021: 797
> Largest place in county: Miami
[in-text-ad]

29. Kings County, New York
> Net population change, 2020-2021: -3.2% (-86,341 people)
> Net change from migration: -99,455 people
> Natural population change: +14,713 people
> Total population, 2021: 2,641,052
> Largest place in county: Brooklyn (NYC)
[recirclink id=1056694]
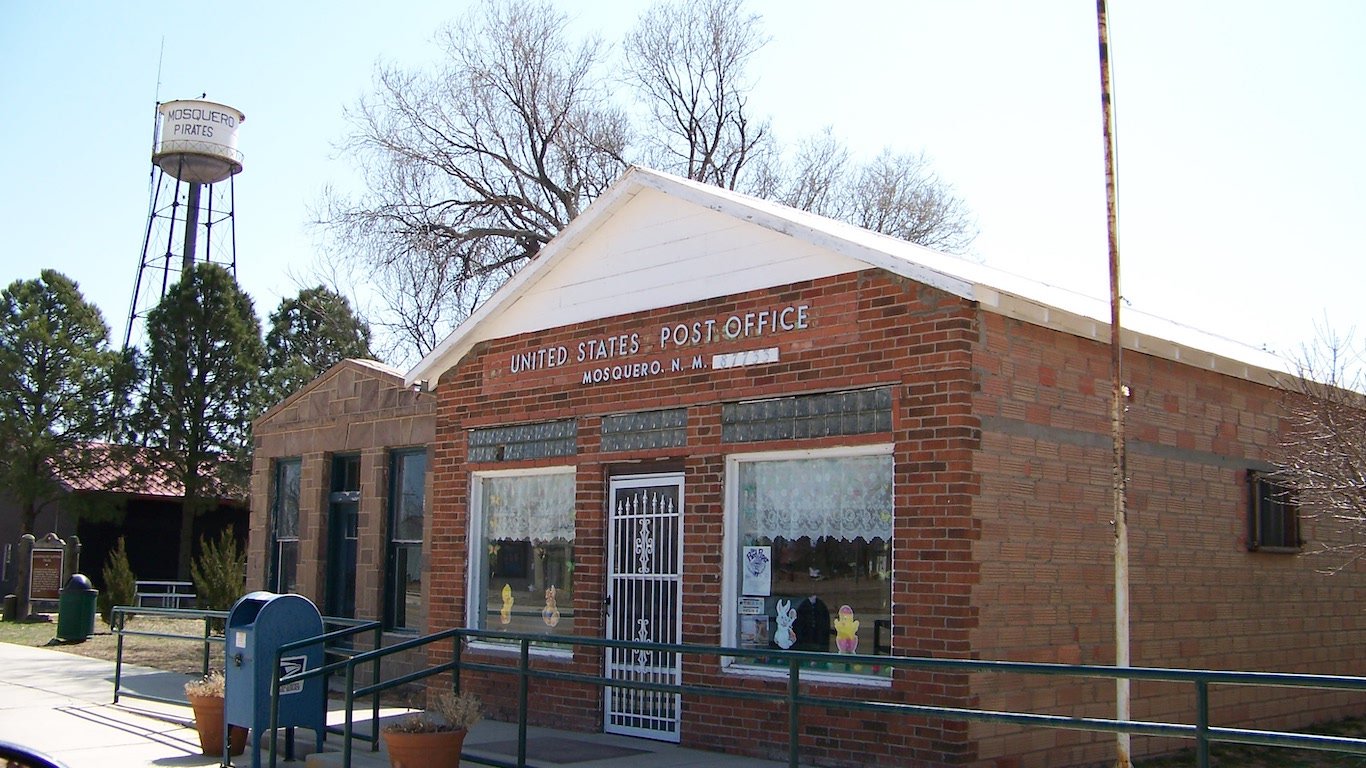
28. Harding County, New Mexico
> Net population change, 2020-2021: -3.2% (-21 people)
> Net change from migration: -7 people
> Natural population change: -13 people
> Total population, 2021: 639
> Largest place in county: Roy

27. San Mateo County, California
> Net population change, 2020-2021: -3.2% (-24,565 people)
> Net change from migration: -26,232 people
> Natural population change: +2,074 people
> Total population, 2021: 737,888
> Largest place in county: Daly City
[in-text-ad-2]

26. Lowndes County, Alabama
> Net population change, 2020-2021: -3.2% (-332 people)
> Net change from migration: -290 people
> Natural population change: -38 people
> Total population, 2021: 9,965
> Largest place in county: Fort Deposit

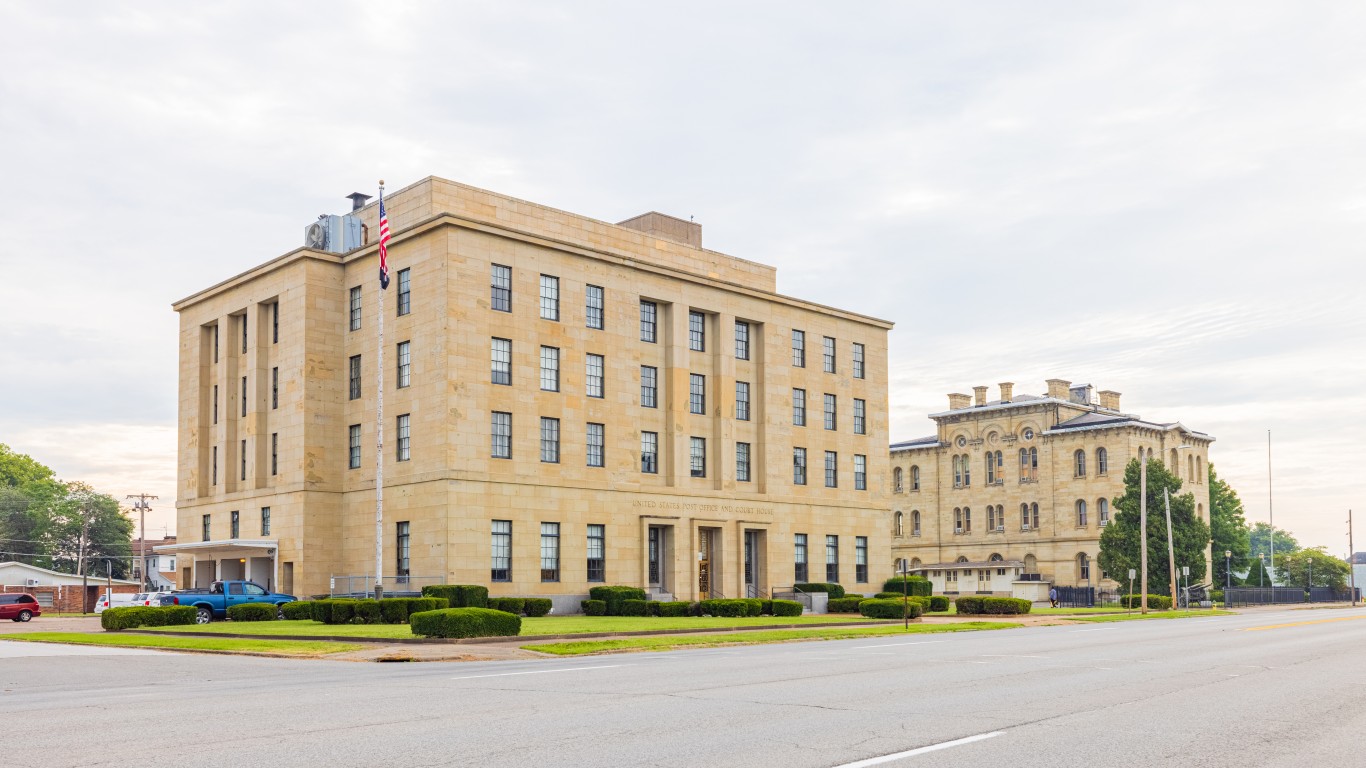
25. Phillips County, Arkansas
> Net population change, 2020-2021: -3.3% (-539 people)
> Net change from migration: -514 people
> Natural population change: -16 people
> Total population, 2021: 15,906
> Largest place in county: West Helena
[in-text-ad]
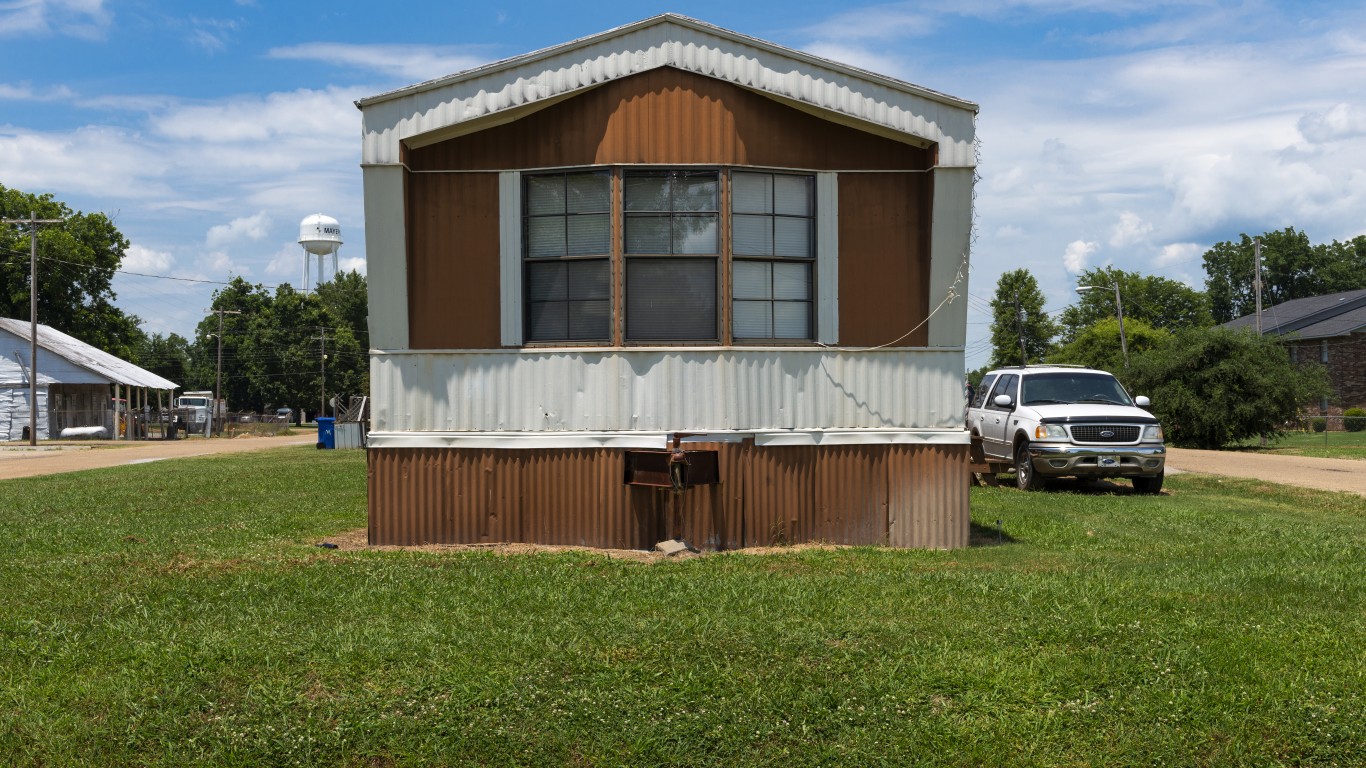
24. Issaquena County, Mississippi
> Net population change, 2020-2021: -3.5% (-46 people)
> Net change from migration: -31 people
> Natural population change: -14 people
> Total population, 2021: 1,280
> Largest place in county: Mayersville
[recirclink id=1043576]

23. Wrangell City and Borough, Alaska
> Net population change, 2020-2021: -3.5% (-75 people)
> Net change from migration: -27 people
> Natural population change: -48 people
> Total population, 2021: 2,055
> Largest place in county: N/A

22. Quitman County, Mississippi
> Net population change, 2020-2021: -3.5% (-218 people)
> Net change from migration: -188 people
> Natural population change: -28 people
> Total population, 2021: 5,935
> Largest place in county: Marks
[in-text-ad-2]

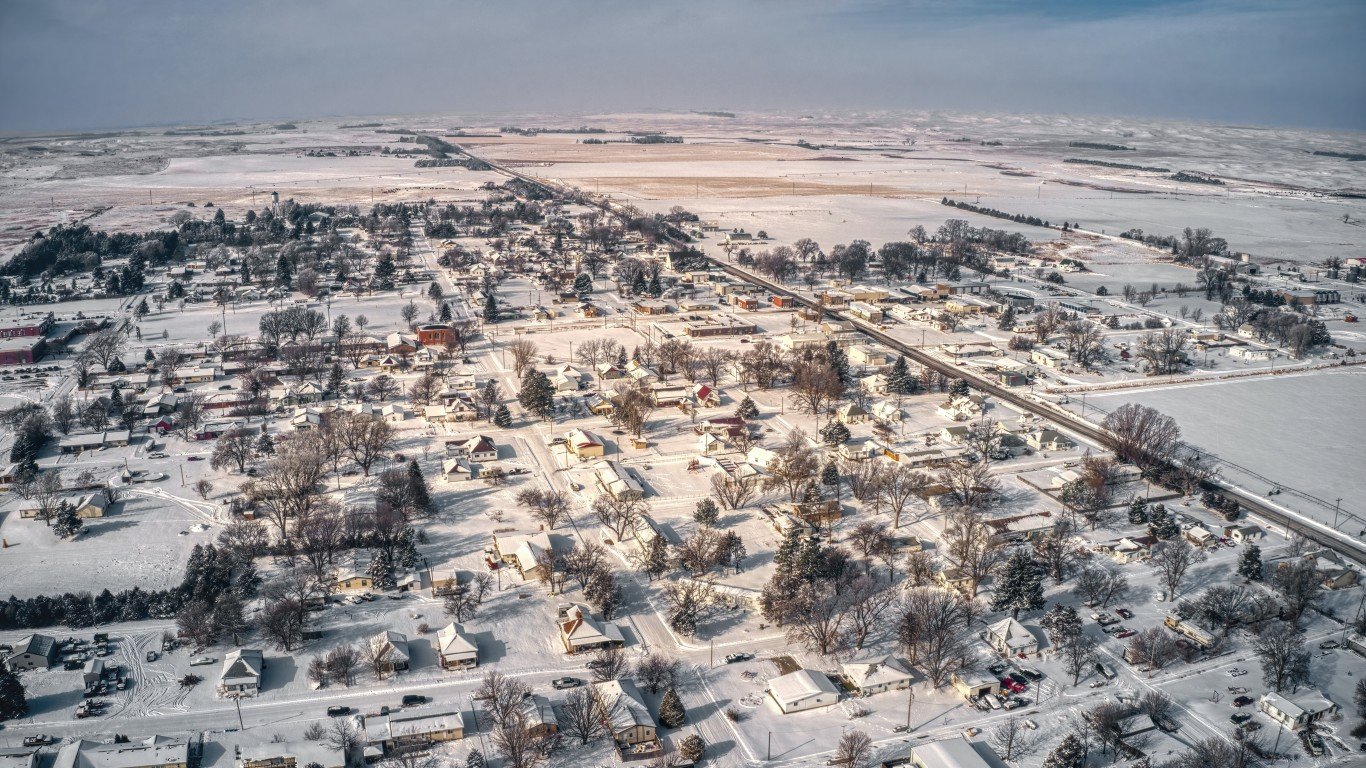
21. Gosper County, Nebraska
> Net population change, 2020-2021: -3.5% (-67 people)
> Net change from migration: -52 people
> Natural population change: -14 people
> Total population, 2021: 1,824
> Largest place in county: Elwood
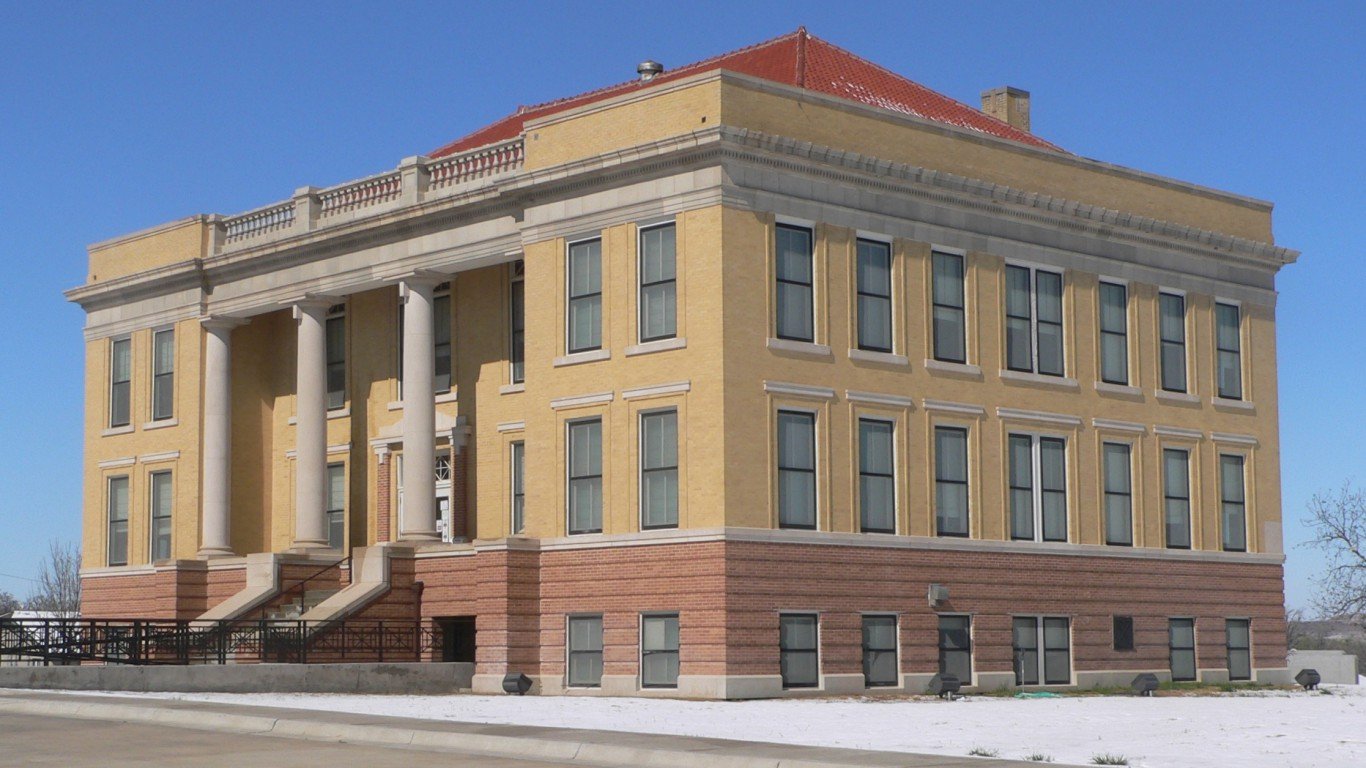
20. Reagan County, Texas
> Net population change, 2020-2021: -3.6% (-123 people)
> Net change from migration: -152 people
> Natural population change: +32 people
> Total population, 2021: 3,253
> Largest place in county: Big Lake
[in-text-ad]
19. Lipscomb County, Texas
> Net population change, 2020-2021: -3.6% (-111 people)
> Net change from migration: -126 people
> Natural population change: +16 people
> Total population, 2021: 2,931
> Largest place in county: Booker
[recirclink id=1063362]
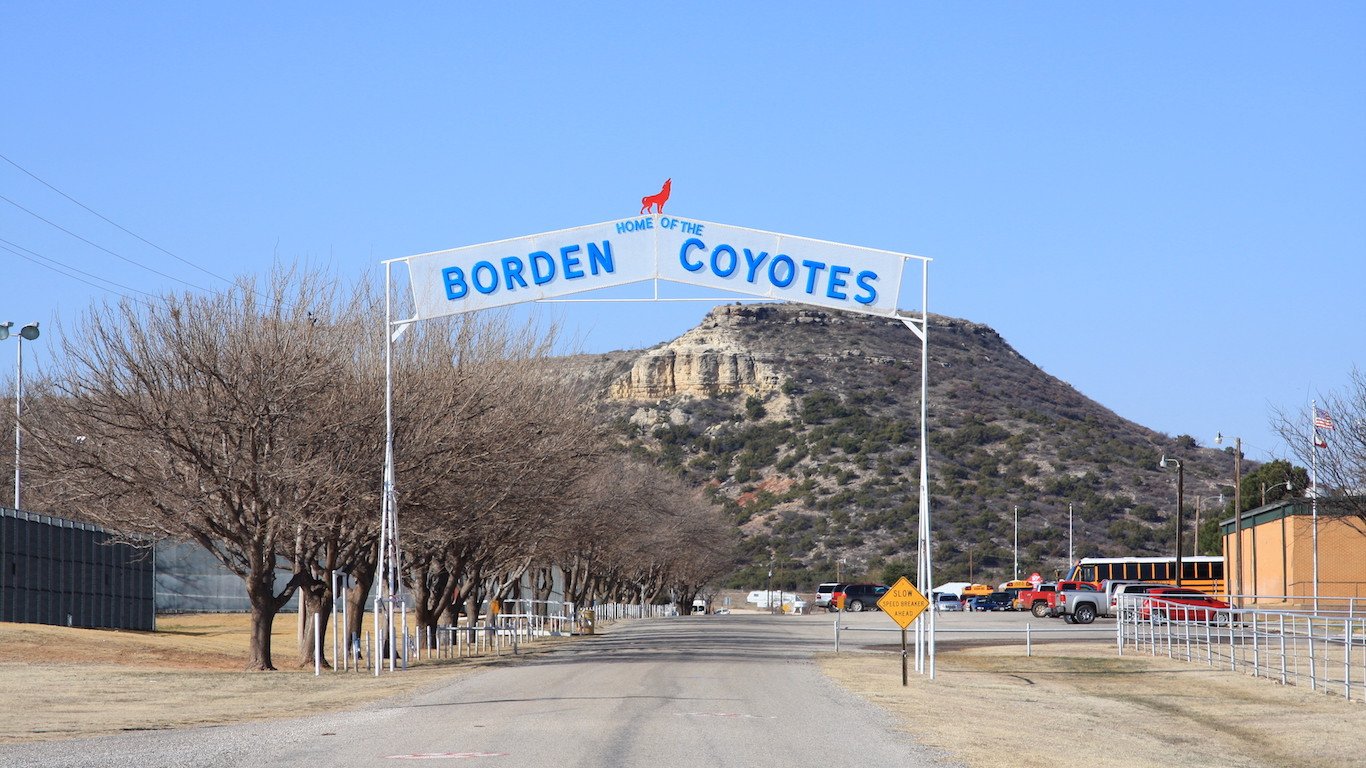
18. Borden County, Texas
> Net population change, 2020-2021: -3.7% (-24 people)
> Net change from migration: -19 people
> Natural population change: -5 people
> Total population, 2021: 617
> Largest place in county: N/A
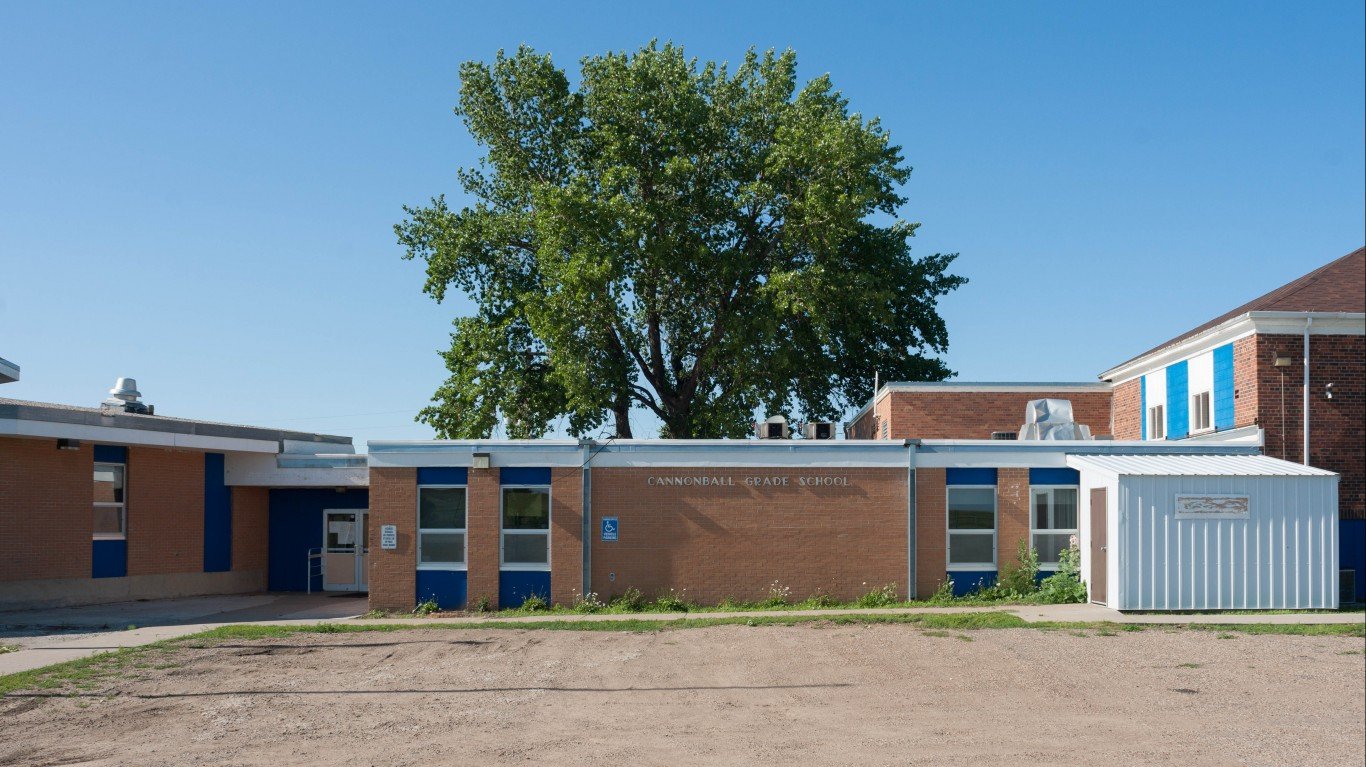
17. Sioux County, North Dakota
> Net population change, 2020-2021: -3.8% (-146 people)
> Net change from migration: -131 people
> Natural population change: -13 people
> Total population, 2021: 3,738
> Largest place in county: Cannon Ball
[in-text-ad-2]
16. Logan County, Nebraska
> Net population change, 2020-2021: -3.8% (-27 people)
> Net change from migration: -23 people
> Natural population change: -3 people
> Total population, 2021: 687
> Largest place in county: Stapleton
15. Ward County, Texas
> Net population change, 2020-2021: -4.0% (-462 people)
> Net change from migration: -561 people
> Natural population change: +110 people
> Total population, 2021: 11,194
> Largest place in county: Monahans
[in-text-ad]
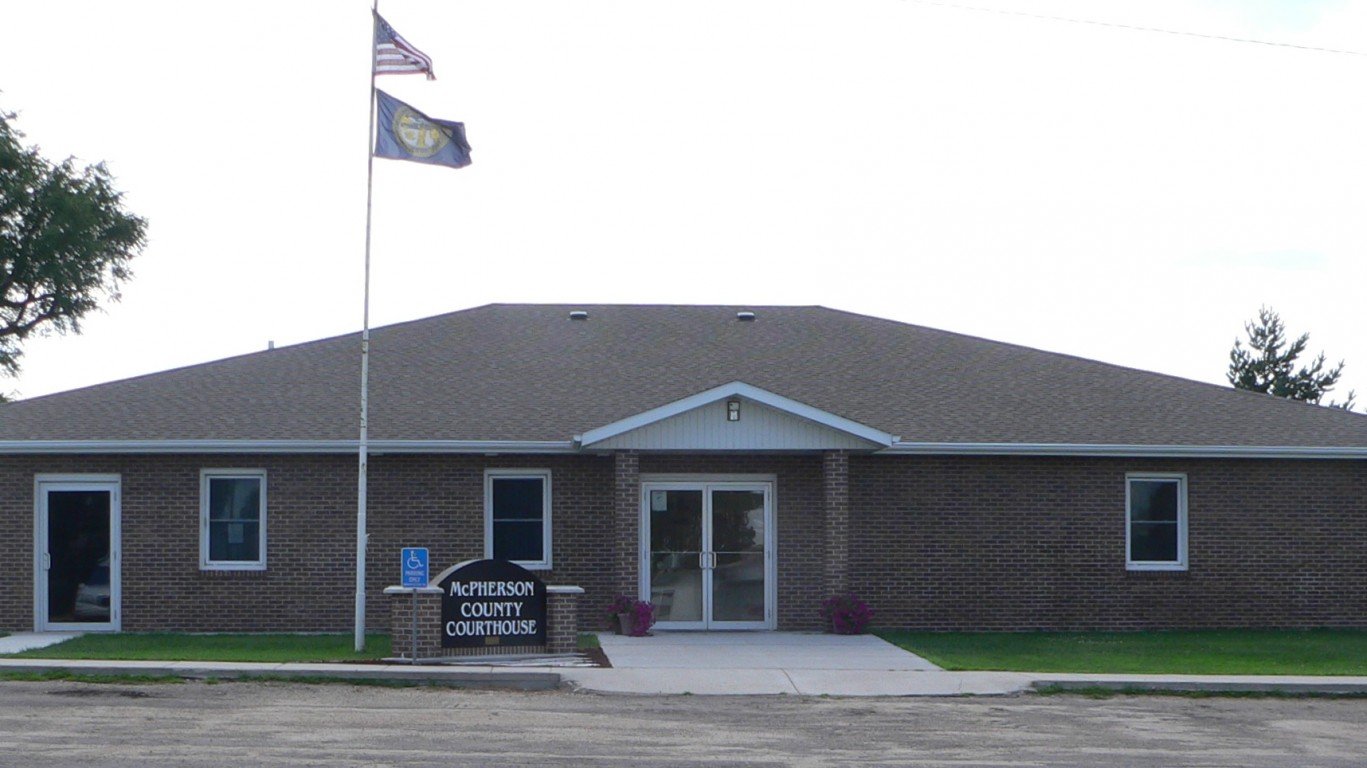
14. McPherson County, Nebraska
> Net population change, 2020-2021: -4.3% (-17 people)
> Net change from migration: -12 people
> Natural population change: -4 people
> Total population, 2021: 379
> Largest place in county: N/A
[recirclink id=1041933]

13. Winkler County, Texas
> Net population change, 2020-2021: -4.3% (-334 people)
> Net change from migration: -400 people
> Natural population change: +74 people
> Total population, 2021: 7,415
> Largest place in county: Kermit

12. King County, Texas
> Net population change, 2020-2021: -4.4% (-12 people)
> Net change from migration: -12 people
> Natural population change: None
> Total population, 2021: 258
> Largest place in county: N/A
[in-text-ad-2]

11. Chattahoochee County, Georgia
> Net population change, 2020-2021: -4.6% (-434 people)
> Net change from migration: -533 people
> Natural population change: +109 people
> Total population, 2021: 9,048
> Largest place in county: Fort Benning South
10. Jones County, South Dakota
> Net population change, 2020-2021: -5.0% (-46 people)
> Net change from migration: -41 people
> Natural population change: -4 people
> Total population, 2021: 879
> Largest place in county: Murdo
[in-text-ad]
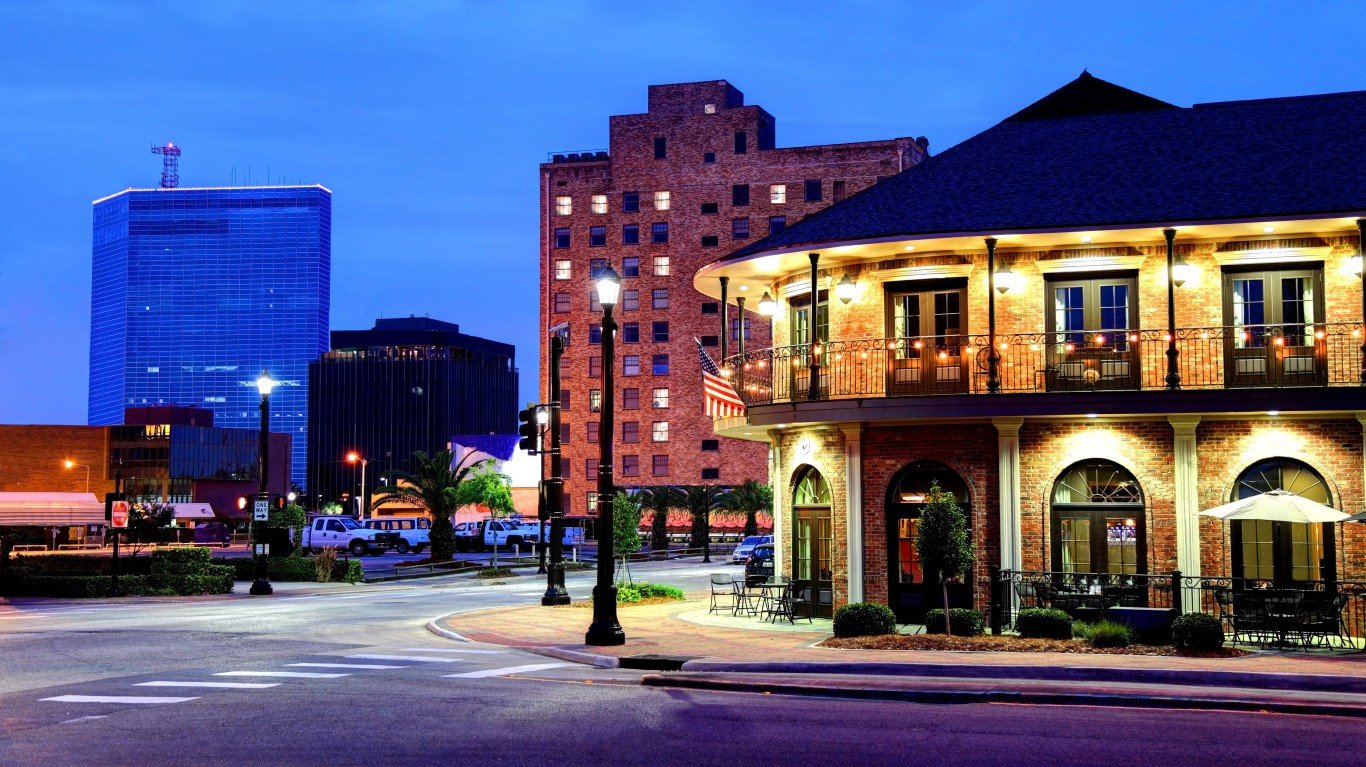
9. Calcasieu Parish, Louisiana
> Net population change, 2020-2021: -5.1% (-11,134 people)
> Net change from migration: -11,288 people
> Natural population change: +358 people
> Total population, 2021: 205,282
> Largest place in county: Lake Charles
[recirclink id=1060074]
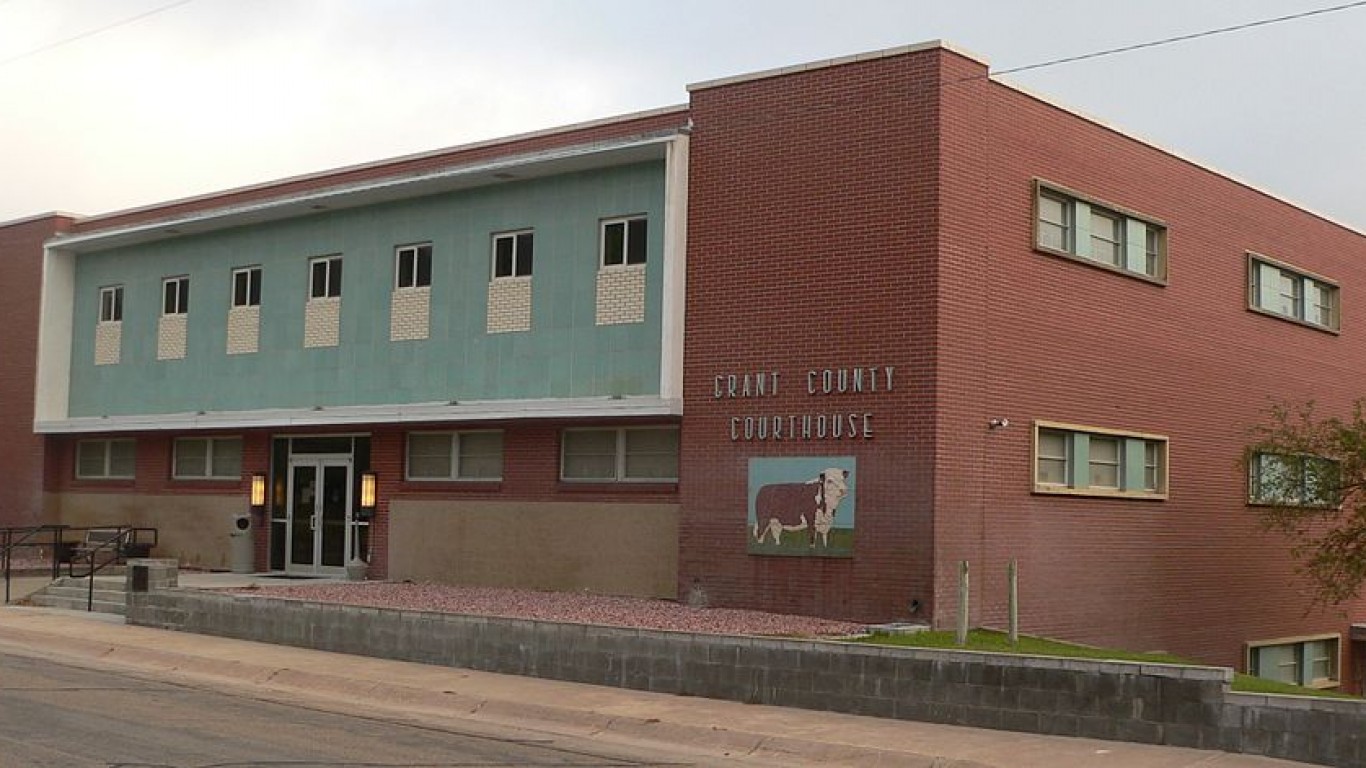
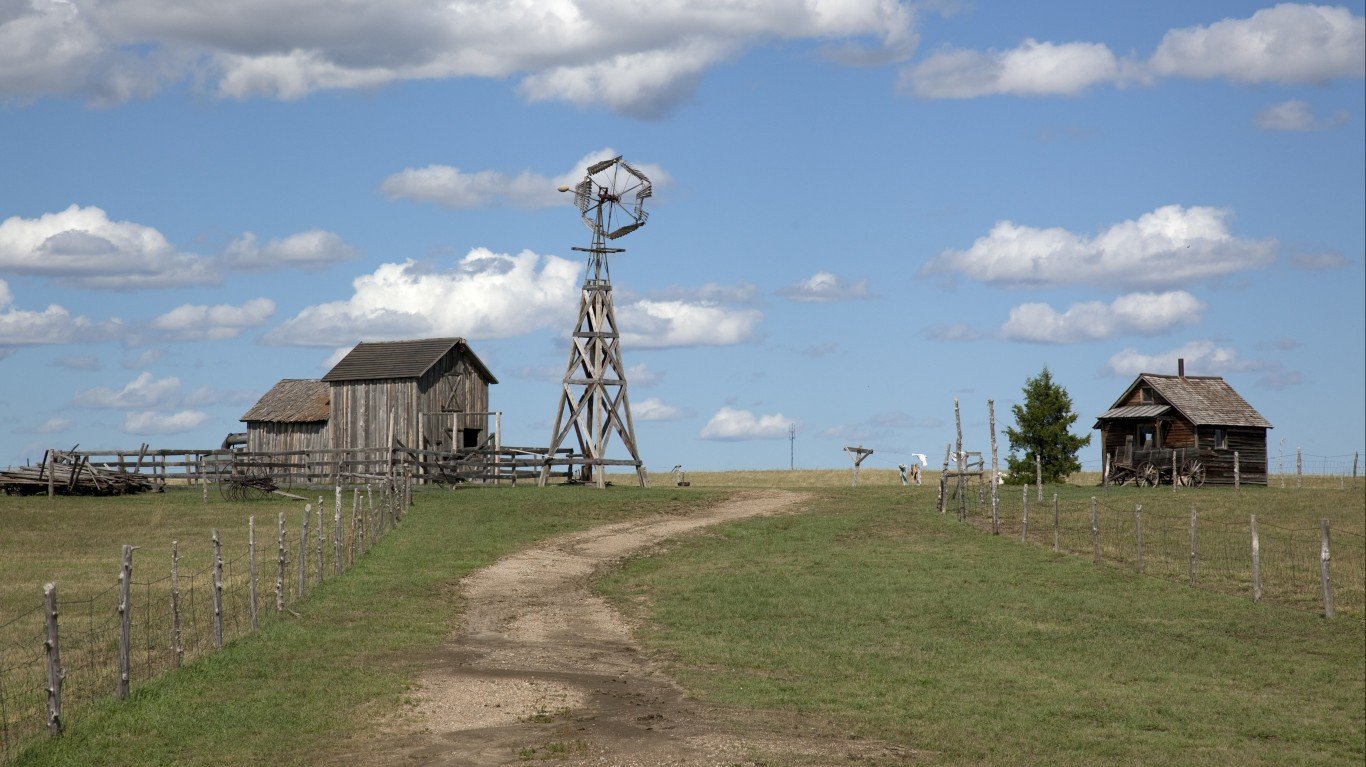
8. Grant County, Nebraska
> Net population change, 2020-2021: -5.2% (-32 people)
> Net change from migration: -31 people
> Natural population change: +1 person
> Total population, 2021: 579
> Largest place in county: Hyannis
7. McKenzie County, North Dakota
> Net population change, 2020-2021: -6.3% (-925 people)
> Net change from migration: -1,052 people
> Natural population change: +149 people
> Total population, 2021: 13,819
> Largest place in county: Watford City
[in-text-ad-2]

6. San Francisco County, California
> Net population change, 2020-2021: -6.3% (-54,813 people)
> Net change from migration: -54,674 people
> Natural population change: +809 people
> Total population, 2021: 815,201
> Largest place in county: San Francisco
5. Williams County, North Dakota
> Net population change, 2020-2021: -6.5% (-2,665 people)
> Net change from migration: -3,120 people
> Natural population change: +517 people
> Total population, 2021: 38,484
> Largest place in county: Williston
[in-text-ad]

4. New York County, New York
> Net population change, 2020-2021: -6.6% (-110,958 people)
> Net change from migration: -111,204 people
> Natural population change: +2,231 people
> Total population, 2021: 1,576,876
> Largest place in county: Manhattan (NYC)
[recirclink id=1056694]

3. Skagway Municipality, Alaska
> Net population change, 2020-2021: -8.6% (-107 people)
> Net change from migration: -92 people
> Natural population change: -13 people
> Total population, 2021: 1,132
> Largest place in county: N/A
2. Cameron Parish, Louisiana
> Net population change, 2020-2021: -9.6% (-539 people)
> Net change from migration: -536 people
> Natural population change: +4 people
> Total population, 2021: 5,080
> Largest place in county: Hackberry
[in-text-ad-2]

1. Loving County, Texas
> Net population change, 2020-2021: -14.9% (-10 people)
> Net change from migration: -7 people
> Natural population change: -2 people
> Total population, 2021: 57
> Largest place in county: N/A
Methodology
To identify the counties that shrunk the most in the last year, 24/7 Wall St. reviewed population change data from the U.S. Census Bureau. We ranked all U.S. counties and county equivalents – including Washington, D.C. – on the percent change in residents from July 1, 2020 to July 1, 2021.
The components of population change are net migration – the number of people who move to a given county less the number of people who move out – and natural population change, meaning the number of births in a given county less the number of deaths.
Due to margins of error in the census estimates, the raw population change number is close to, but not precisely equal to, the sum of net migration and natural population change.
Contact [email protected] for any questions or corrections.