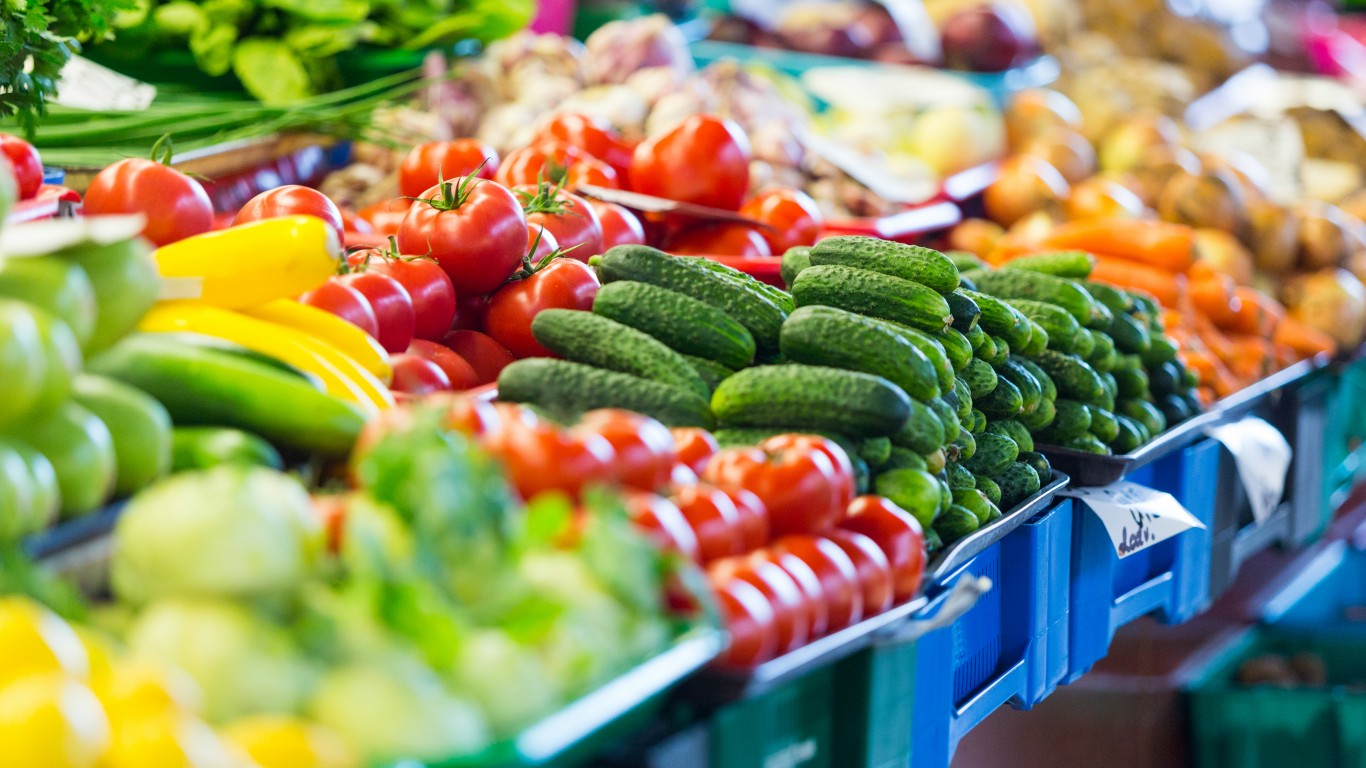
Inflation is surging in the United States – in large part because of rising food prices. In cities across the country, food today is 8% more expensive on average than it was a year ago, and American families are feeling the pinch.
According to the Economic Policy Institute, a nonprofit think tank, a family of four – two adults and two children – can expect to pay an estimated $9,835 on food in 2022. This amount varies across the country, however, and in many major metropolitan areas, families are paying thousands more than the estimated national average for food. Here is a look at the countries with the most and least affordable groceries.
Using data from the EPI’s Family Budget Calculator, 24/7 Wall St. identified the 50 U.S. metro areas where families pay the most for food. Metro areas are ranked on estimated food expenditure in 2022, assuming a nutritionally adequate diet for two adults and two children, where almost all food is bought at a grocery store and prepared at home.
In metro areas with the same estimated annual food cost, the metro area with the higher food insecurity rate – defined as the share of the population not able to always afford or otherwise access well-balanced meals – ranks worse.
Among the metro areas on this list, estimated annual food costs range from about $10,500 to over $15,000. The largest share of metro areas on this list are in the Northeast, though California alone is home to nine, the most of any state. Higher food costs in these places are often a reflection of what residents can afford. Most metro areas on this list have a higher median family income than the national average of $80,069. Here is a look at the income needed to be middle class in each state.
For many families in these metro areas, high incomes are usually enough to offset higher food costs as in the majority of these places, the share of households receiving government assistance to afford groceries in the form of SNAP benefits, or Food Stamps, is below the national recipiency rate of 12.1%.
Click here to see the metros where families pay the most for food
Click here to read our detailed methodology
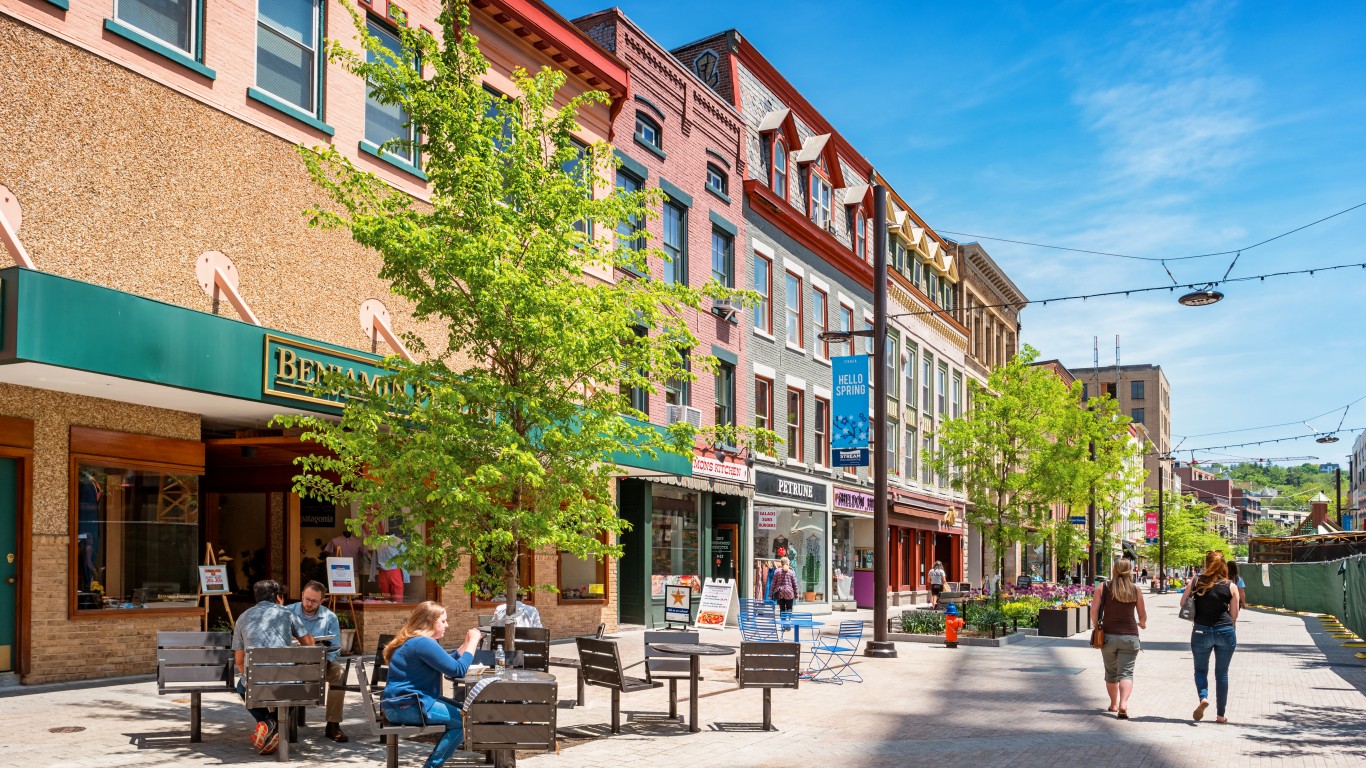
50. Ithaca, NY
> Est. annual food costs: $10,494
> Median family income: $87,977 — 63rd highest of 376 metros
> Food Stamp recipiency rate: 9.9% — 108th lowest of 376 metros
> Food insecurity rate: 5.4% — 107th lowest of 376 metros
[in-text-ad]

49. Poughkeepsie-Newburgh-Middletown, NY
> Est. annual food costs: $10,502
> Median family income: $100,123 — 22nd highest of 376 metros
> Food Stamp recipiency rate: 9.4% — 88th lowest of 376 metros
> Food insecurity rate: 5.2% — 102nd lowest of 376 metros
[recirclink id=1066858]

48. Durham-Chapel Hill, NC
> Est. annual food costs: $10,514
> Median family income: $84,764 — 79th highest of 376 metros
> Food Stamp recipiency rate: 9.8% — 103rd lowest of 376 metros
> Food insecurity rate: 7.0% — 177th lowest of 376 metros
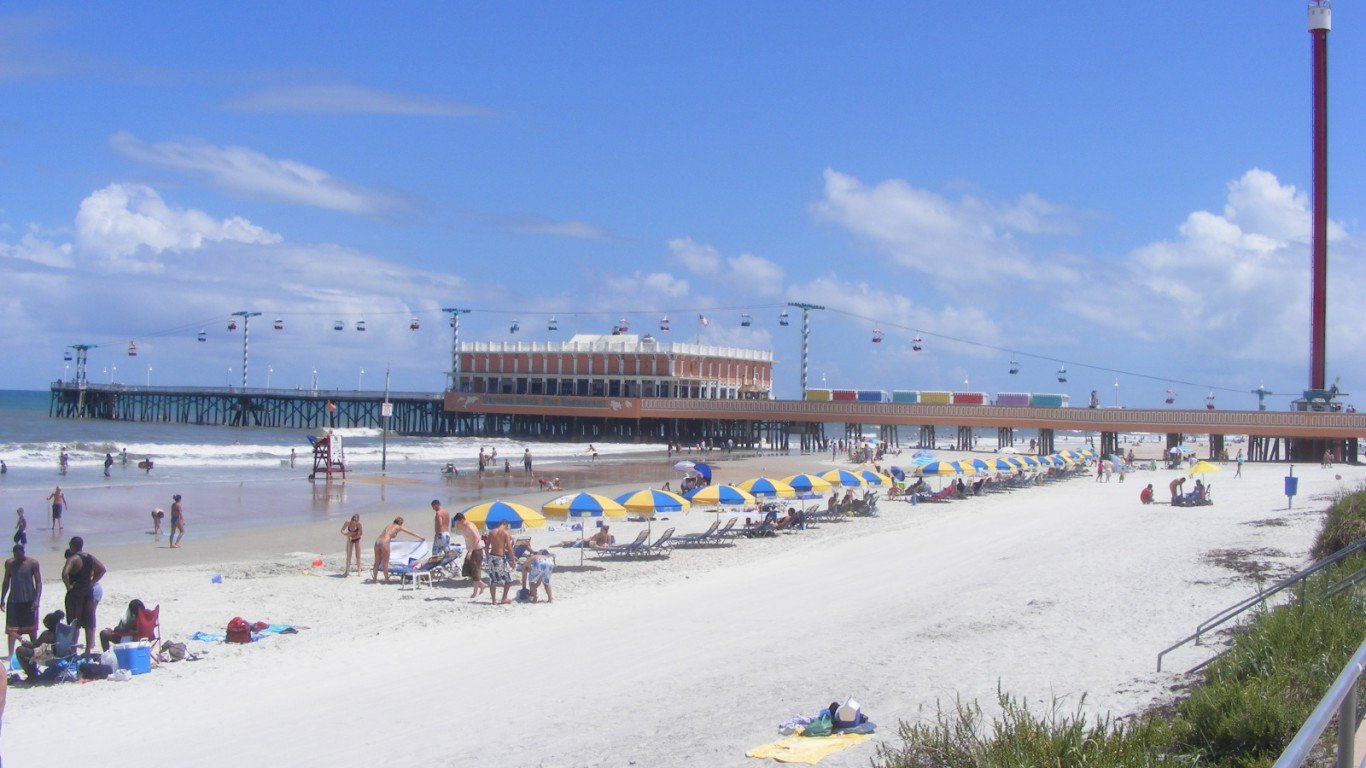
47. Deltona-Daytona Beach-Ormond Beach, FL
> Est. annual food costs: $10,524
> Median family income: $65,794 — 90th lowest of 376 metros
> Food Stamp recipiency rate: 12.7% — 170th highest of 376 metros
> Food insecurity rate: 13.2% — 25th highest of 376 metros
[in-text-ad-2]

46. Philadelphia-Camden-Wilmington, PA-NJ-DE-MD
> Est. annual food costs: $10,532
> Median family income: $95,369 — 36th highest of 376 metros
> Food Stamp recipiency rate: 13.2% — 155th highest of 376 metros
> Food insecurity rate: 3.6% — 37th lowest of 376 metros

45. Sacramento-Roseville-Folsom, CA
> Est. annual food costs: $10,549
> Median family income: $90,500 — 50th highest of 376 metros
> Food Stamp recipiency rate: 10.6% — 139th lowest of 376 metros
> Food insecurity rate: 4.1% — 51st lowest of 376 metros
[in-text-ad]
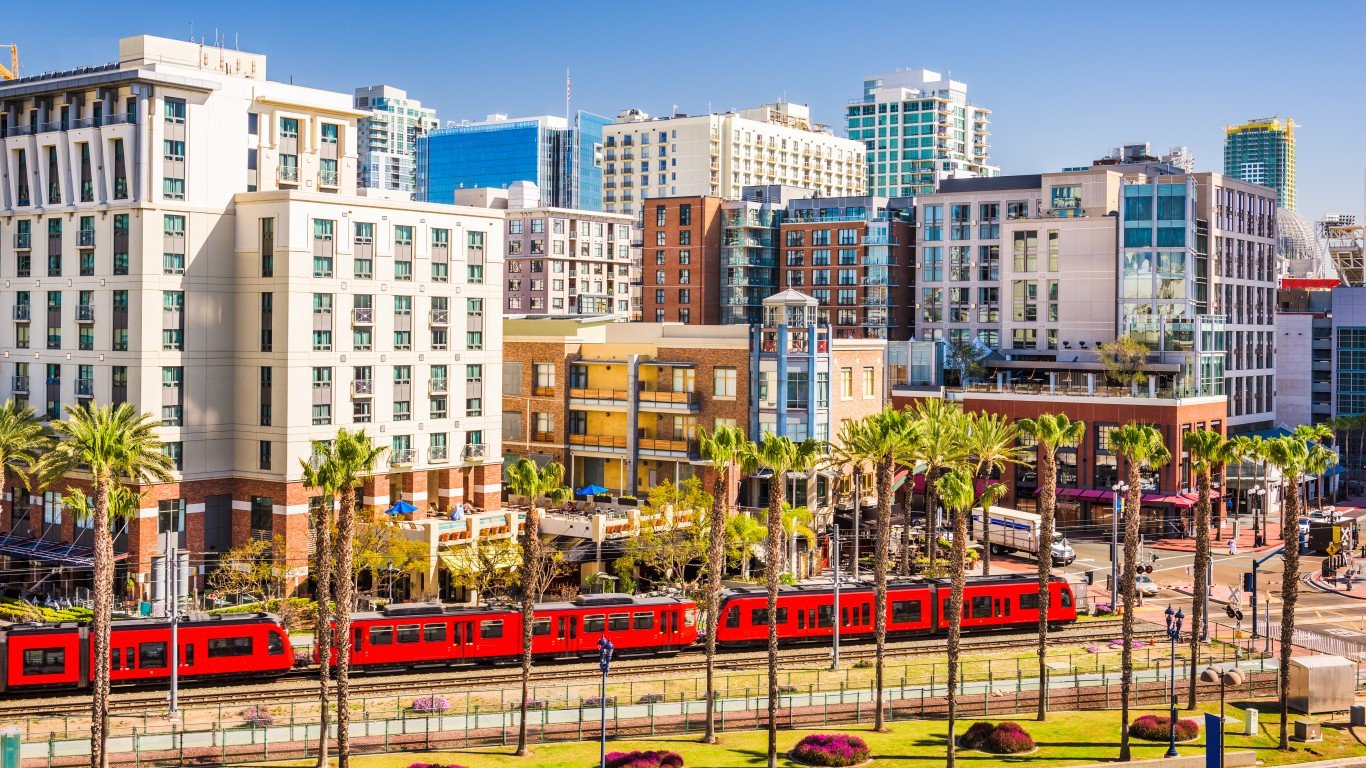
44. San Diego-Chula Vista-Carlsbad, CA
> Est. annual food costs: $10,554
> Median family income: $95,623 — 33rd highest of 376 metros
> Food Stamp recipiency rate: 8.2% — 50th lowest of 376 metros
> Food insecurity rate: 3.1% — 17th lowest of 376 metros
[recirclink id=1067232]

43. Manchester-Nashua, NH
> Est. annual food costs: $10,554
> Median family income: $103,238 — 16th highest of 376 metros
> Food Stamp recipiency rate: 7.7% — 40th lowest of 376 metros
> Food insecurity rate: 5.5% — 115th lowest of 376 metros

42. Homosassa Springs, FL
> Est. annual food costs: $10,554
> Median family income: $57,253 — 21st lowest of 376 metros
> Food Stamp recipiency rate: 12.9% — 162nd highest of 376 metros
> Food insecurity rate: 12.9% — 27th highest of 376 metros
[in-text-ad-2]

41. Springfield, MA
> Est. annual food costs: $10,603
> Median family income: $79,907 — 122nd highest of 376 metros (tied)
> Food Stamp recipiency rate: 18.8% — 24th highest of 376 metros
> Food insecurity rate: 6.2% — 144th lowest of 376 metros

40. Hartford-East Hartford-Middletown, CT
> Est. annual food costs: $10,614
> Median family income: $101,543 — 19th highest of 376 metros
> Food Stamp recipiency rate: 13.7% — 131st highest of 376 metros
> Food insecurity rate: 4.6% — 70th lowest of 376 metros
[in-text-ad]

39. Albany-Schenectady-Troy, NY
> Est. annual food costs: $10,632
> Median family income: $95,438 — 34th highest of 376 metros (tied)
> Food Stamp recipiency rate: 10.6% — 138th lowest of 376 metros
> Food insecurity rate: 4.7% — 79th lowest of 376 metros
[recirclink id=1068988]

38. Norwich-New London, CT
> Est. annual food costs: $10,644
> Median family income: $94,894 — 38th highest of 376 metros
> Food Stamp recipiency rate: 10.9% — 146th lowest of 376 metros
> Food insecurity rate: 7.1% — 183rd lowest of 376 metros

37. Bend, OR
> Est. annual food costs: $10,674
> Median family income: $81,822 — 109th highest of 376 metros
> Food Stamp recipiency rate: 11.3% — 165th lowest of 376 metros
> Food insecurity rate: 5.3% — 104th lowest of 376 metros
[in-text-ad-2]

36. Bangor, ME
> Est. annual food costs: $10,674
> Median family income: $67,988 — 115th lowest of 376 metros
> Food Stamp recipiency rate: 16.9% — 54th highest of 376 metros
> Food insecurity rate: 5.5% — 114th lowest of 376 metros

35. Bellingham, WA
> Est. annual food costs: $10,674
> Median family income: $83,751 — 87th highest of 376 metros (tied)
> Food Stamp recipiency rate: 12.4% — 182nd highest of 376 metros
> Food insecurity rate: 7.5% — 176th highest of 376 metros
[in-text-ad]

34. Auburn-Opelika, AL
> Est. annual food costs: $10,674
> Median family income: $75,091 — 171st highest of 376 metros
> Food Stamp recipiency rate: 9.4% — 87th lowest of 376 metros
> Food insecurity rate: 12.2% — 37th highest of 376 metros
[recirclink id=1074786]

33. Glens Falls, NY
> Est. annual food costs: $10,688
> Median family income: $77,435 — 147th highest of 376 metros
> Food Stamp recipiency rate: 13.1% — 156th highest of 376 metros
> Food insecurity rate: 4.1% — 50th lowest of 376 metros
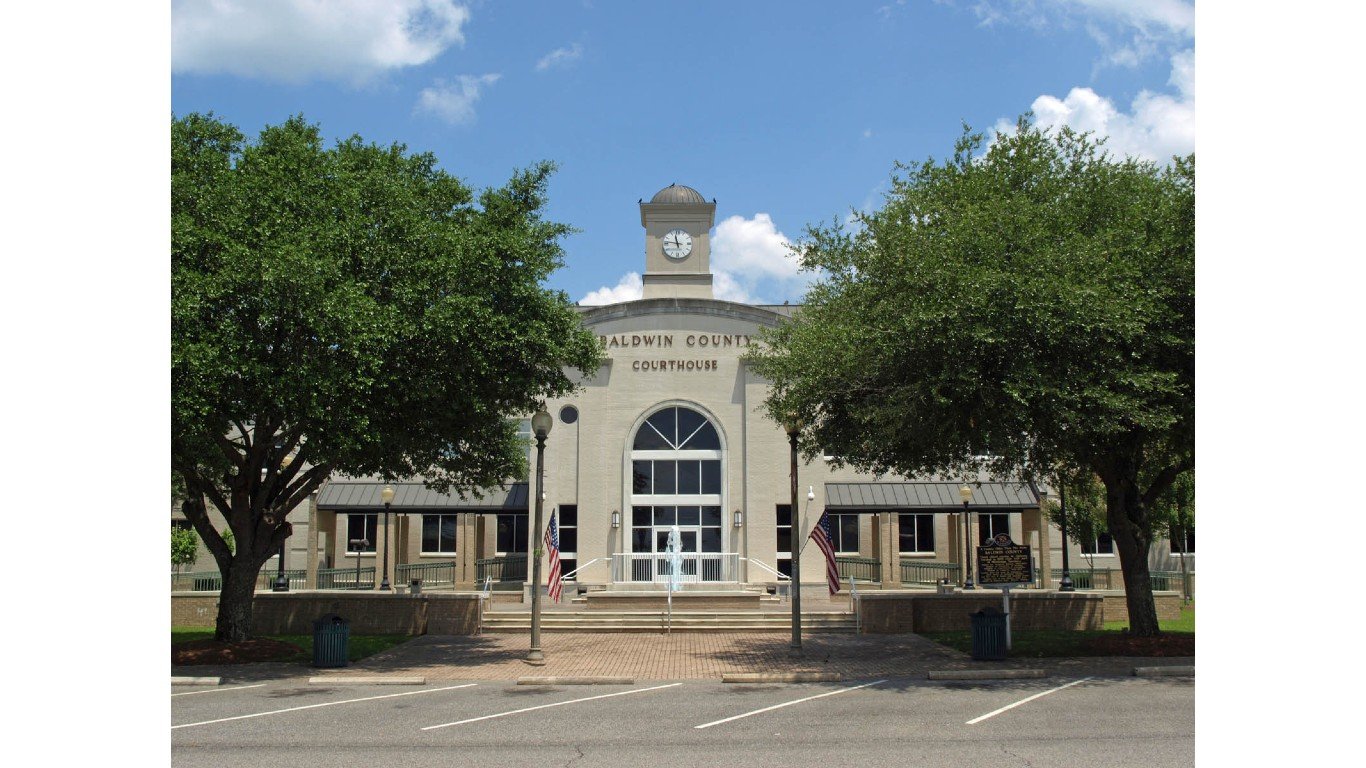
32. Daphne-Fairhope-Foley, AL
> Est. annual food costs: $10,734
> Median family income: $79,907 — 122nd highest of 376 metros (tied)
> Food Stamp recipiency rate: 7.2% — 25th lowest of 376 metros
> Food insecurity rate: 5.4% — 112th lowest of 376 metros
[in-text-ad-2]

31. North Port-Sarasota-Bradenton, FL
> Est. annual food costs: $10,751
> Median family income: $77,172 — 149th highest of 376 metros
> Food Stamp recipiency rate: 8.1% — 48th lowest of 376 metros
> Food insecurity rate: 6.7% — 166th lowest of 376 metros

30. State College, PA
> Est. annual food costs: $10,764
> Median family income: $90,415 — 53rd highest of 376 metros
> Food Stamp recipiency rate: 6.8% — 20th lowest of 376 metros
> Food insecurity rate: 3.7% — 41st lowest of 376 metros
[in-text-ad]

29. Providence-Warwick, RI-MA
> Est. annual food costs: $10,768
> Median family income: $89,555 — 58th highest of 376 metros
> Food Stamp recipiency rate: 16.2% — 71st highest of 376 metros
> Food insecurity rate: 4.6% — 72nd lowest of 376 metros
[recirclink id=1076681]

28. Miami-Fort Lauderdale-Pompano Beach, FL
> Est. annual food costs: $10,824
> Median family income: $69,172 — 129th lowest of 376 metros
> Food Stamp recipiency rate: 17.4% — 46th highest of 376 metros
> Food insecurity rate: 2.7% — 11th lowest of 376 metros

27. Manhattan, KS
> Est. annual food costs: $10,848
> Median family income: $70,357 — 141st lowest of 376 metros
> Food Stamp recipiency rate: 7.4% — 31st lowest of 376 metros
> Food insecurity rate: 15.3% — 12th highest of 376 metros
[in-text-ad-2]

26. Gettysburg, PA
> Est. annual food costs: $10,884
> Median family income: $84,709 — 81st highest of 376 metros
> Food Stamp recipiency rate: 8.1% — 49th lowest of 376 metros
> Food insecurity rate: 3.0% — 15th lowest of 376 metros

25. Worcester, MA-CT
> Est. annual food costs: $10,884
> Median family income: $96,860 — 30th highest of 376 metros
> Food Stamp recipiency rate: 13.6% — 140th highest of 376 metros
> Food insecurity rate: 5.0% — 93rd lowest of 376 metros
[in-text-ad]

24. Charlottesville, VA
> Est. annual food costs: $10,961
> Median family income: $95,708 — 32nd highest of 376 metros
> Food Stamp recipiency rate: 6.0% — 7th lowest of 376 metros
> Food insecurity rate: 3.2% — 24th lowest of 376 metros
[recirclink id=1066858]

23. Lewiston-Auburn, ME
> Est. annual food costs: $11,003
> Median family income: $70,817 — 150th lowest of 376 metros
> Food Stamp recipiency rate: 18.3% — 27th highest of 376 metros
> Food insecurity rate: 3.5% — 36th lowest of 376 metros

22. Pittsfield, MA
> Est. annual food costs: $11,033
> Median family income: $82,207 — 101st highest of 376 metros
> Food Stamp recipiency rate: 14.2% — 114th highest of 376 metros
> Food insecurity rate: 6.0% — 132nd lowest of 376 metros
[in-text-ad-2]

21. Naples-Marco Island, FL
> Est. annual food costs: $11,033
> Median family income: $84,784 — 78th highest of 376 metros
> Food Stamp recipiency rate: 7.6% — 39th lowest of 376 metros
> Food insecurity rate: 9.5% — 97th highest of 376 metros

20. Washington-Arlington-Alexandria, DC-VA-MD-WV
> Est. annual food costs: $11,160
> Median family income: $126,840 — 3rd highest of 376 metros
> Food Stamp recipiency rate: 7.2% — 24th lowest of 376 metros
> Food insecurity rate: 2.3% — 6th lowest of 376 metros
[in-text-ad]
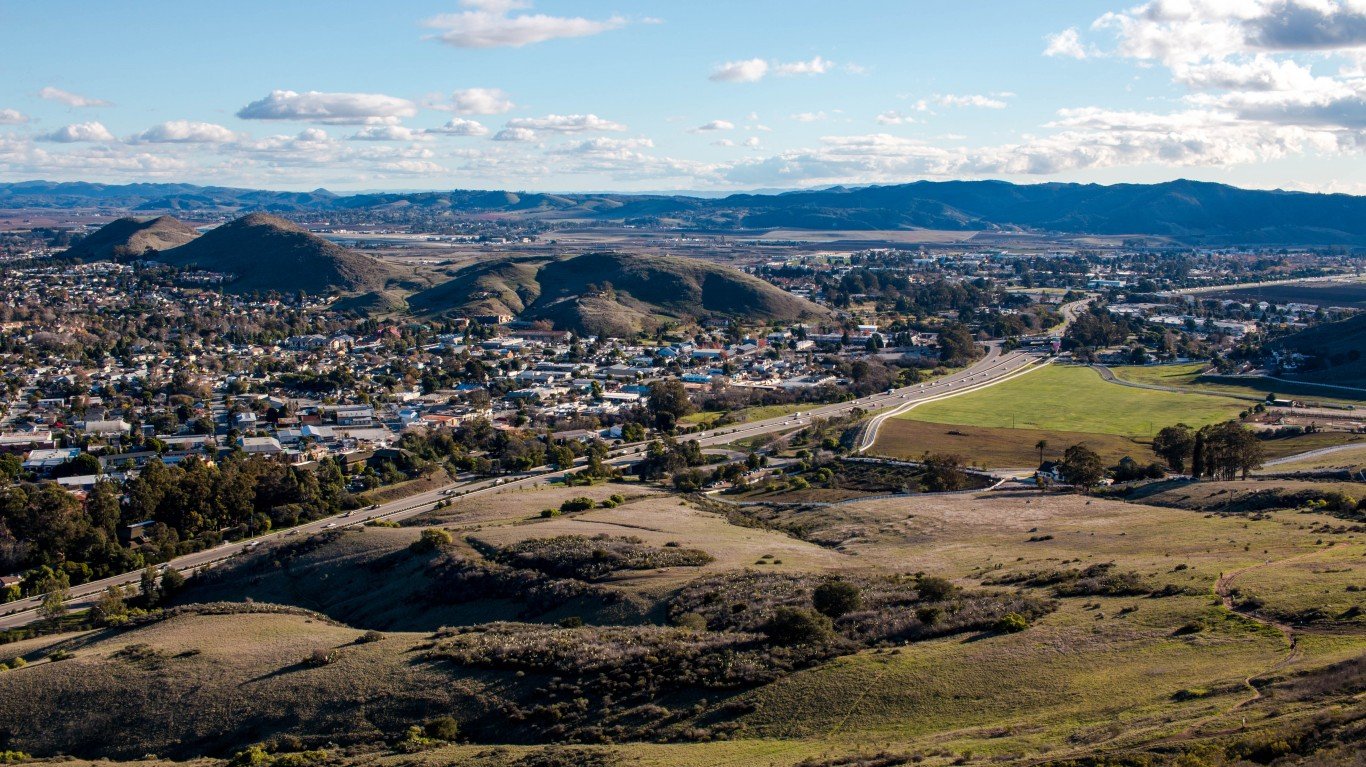
19. San Luis Obispo-Paso Robles, CA
> Est. annual food costs: $11,243
> Median family income: $97,590 — 26th highest of 376 metros
> Food Stamp recipiency rate: 5.4% — 4th lowest of 376 metros
> Food insecurity rate: 4.5% — 62nd lowest of 376 metros
[recirclink id=1067232]

18. Seattle-Tacoma-Bellevue, WA
> Est. annual food costs: $11,293
> Median family income: $109,109 — 9th highest of 376 metros
> Food Stamp recipiency rate: 10.0% — 110th lowest of 376 metros
> Food insecurity rate: 4.3% — 57th lowest of 376 metros
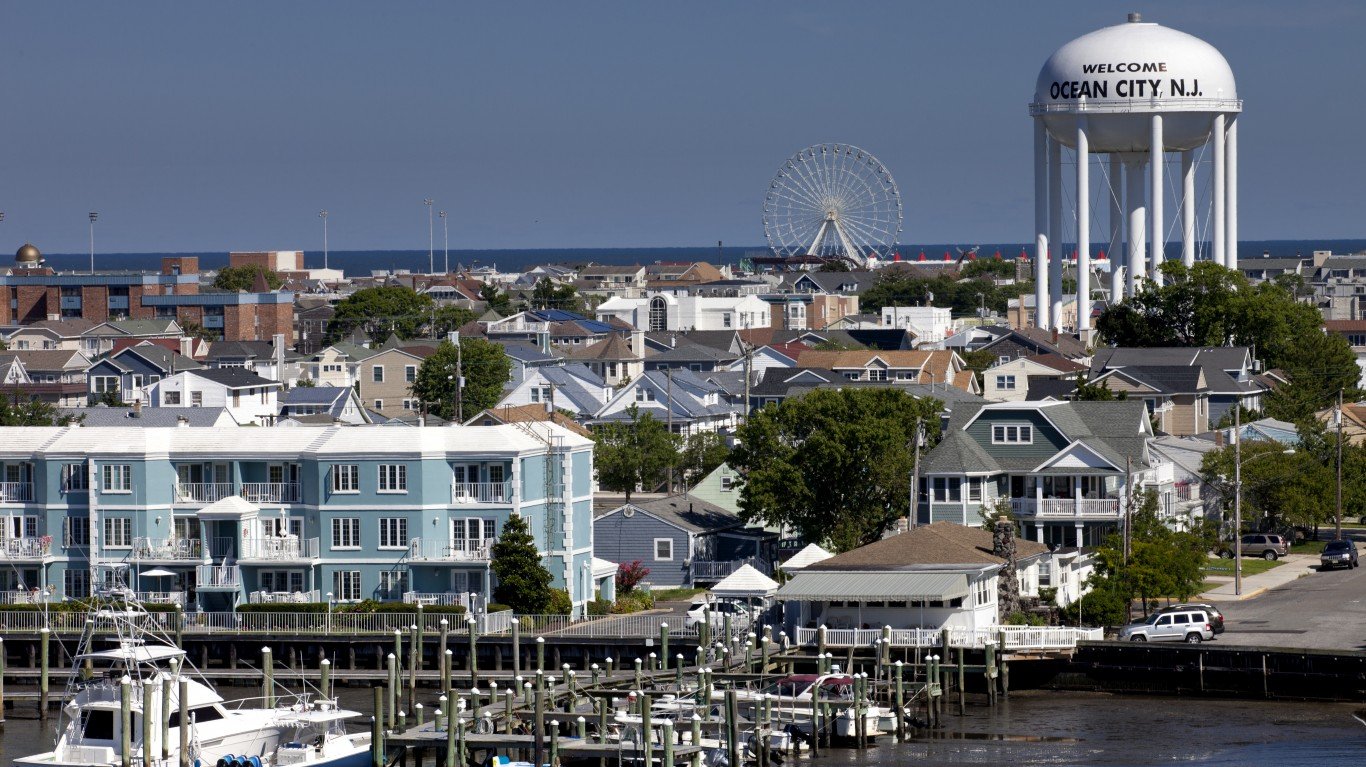
17. Ocean City, NJ
> Est. annual food costs: $11,303
> Median family income: $87,716 — 65th highest of 376 metros
> Food Stamp recipiency rate: 7.0% — 22nd lowest of 376 metros
> Food insecurity rate: 8.8% — 124th highest of 376 metros
[in-text-ad-2]

16. Sebastian-Vero Beach, FL
> Est. annual food costs: $11,333
> Median family income: $72,001 — 170th lowest of 376 metros
> Food Stamp recipiency rate: 8.2% — 51st lowest of 376 metros
> Food insecurity rate: 13.6% — 21st highest of 376 metros

15. Burlington-South Burlington, VT
> Est. annual food costs: $11,376
> Median family income: $95,011 — 37th highest of 376 metros
> Food Stamp recipiency rate: 8.9% — 69th lowest of 376 metros
> Food insecurity rate: 2.5% — 8th lowest of 376 metros
[in-text-ad]

14. San Jose-Sunnyvale-Santa Clara, CA
> Est. annual food costs: $11,513
> Median family income: $145,548 — the highest of 376 metros
> Food Stamp recipiency rate: 5.4% — 3rd lowest of 376 metros
> Food insecurity rate: 1.1% — the lowest of 376 metros
[recirclink id=1068988]

13. Boulder, CO
> Est. annual food costs: $11,843
> Median family income: $118,307 — 5th highest of 376 metros
> Food Stamp recipiency rate: 5.5% — 5th lowest of 376 metros
> Food insecurity rate: 3.1% — 19th lowest of 376 metros

12. Madera, CA
> Est. annual food costs: $11,903
> Median family income: $65,627 — 88th lowest of 376 metros
> Food Stamp recipiency rate: 19.3% — 20th highest of 376 metros
> Food insecurity rate: 9.4% — 100th highest of 376 metros
[in-text-ad-2]

11. Santa Rosa-Petaluma, CA
> Est. annual food costs: $11,993
> Median family income: $102,411 — 18th highest of 376 metros
> Food Stamp recipiency rate: 6.8% — 21st lowest of 376 metros
> Food insecurity rate: 4.0% — 49th lowest of 376 metros

10. Boston-Cambridge-Newton, MA-NH
> Est. annual food costs: $12,133
> Median family income: $116,181 — 6th highest of 376 metros
> Food Stamp recipiency rate: 10.6% — 137th lowest of 376 metros
> Food insecurity rate: 3.4% — 31st lowest of 376 metros
[in-text-ad]

9. Bridgeport-Stamford-Norwalk, CT
> Est. annual food costs: $12,173
> Median family income: $120,156 — 4th highest of 376 metros
> Food Stamp recipiency rate: 9.1% — 78th lowest of 376 metros
> Food insecurity rate: 3.2% — 26th lowest of 376 metros
[recirclink id=1074786]

8. Portland-South Portland, ME
> Est. annual food costs: $12,245
> Median family income: $89,988 — 56th highest of 376 metros
> Food Stamp recipiency rate: 9.4% — 91st lowest of 376 metros
> Food insecurity rate: 3.9% — 47th lowest of 376 metros

7. Santa Cruz-Watsonville, CA
> Est. annual food costs: $12,293
> Median family income: $109,931 — 8th highest of 376 metros
> Food Stamp recipiency rate: 9.2% — 81st lowest of 376 metros
> Food insecurity rate: 3.8% — 43rd lowest of 376 metros
[in-text-ad-2]

6. New York-Newark-Jersey City, NY-NJ-PA
> Est. annual food costs: $12,418
> Median family income: $99,148 — 24th highest of 376 metros
> Food Stamp recipiency rate: 13.6% — 139th highest of 376 metros
> Food insecurity rate: 1.6% — 4th lowest of 376 metros

5. Napa, CA
> Est. annual food costs: $13,132
> Median family income: $107,995 — 11th highest of 376 metros
> Food Stamp recipiency rate: 5.1% — the lowest of 376 metros
> Food insecurity rate: 2.3% — 7th lowest of 376 metros
[in-text-ad]

4. Barnstable Town, MA
> Est. annual food costs: $13,162
> Median family income: $99,410 — 23rd highest of 376 metros
> Food Stamp recipiency rate: 7.5% — 35th lowest of 376 metros
> Food insecurity rate: 9.7% — 87th highest of 376 metros
[recirclink id=1076681]

3. San Francisco-Oakland-Berkeley, CA
> Est. annual food costs: $13,305
> Median family income: $131,087 — 2nd highest of 376 metros
> Food Stamp recipiency rate: 6.6% — 15th lowest of 376 metros
> Food insecurity rate: 1.4% — 2nd lowest of 376 metros

2. Urban Honolulu, HI
> Est. annual food costs: $13,846
> Median family income: $103,845 — 15th highest of 376 metros
> Food Stamp recipiency rate: 10.2% — 122nd lowest of 376 metros
> Food insecurity rate: 5.2% — 101st lowest of 376 metros
[in-text-ad-2]

1. Kahului-Wailuku-Lahaina, HI
> Est. annual food costs: $15,094
> Median family income: $92,627 — 46th highest of 376 metros
> Food Stamp recipiency rate: 10.7% — 142nd lowest of 376 metros
> Food insecurity rate: 8.2% — 153rd highest of 376 metros
Methodology
To determine the metros with the highest food costs for a family of four, 24/7 Wall St. reviewed data from the Economic Policy Institute’s 2022 Family Budget Calculator.
In the Family Budget Calculator, the EPI estimates the annual food budget necessary for families to maintain a modest yet adequate standard of living. The budgets are created for 10 family types for U.S. counties and metro areas. A family of four is defined by the EPI as a married couple living with their two children, and the two children are assumed to be a four-year-old and an eight-year-old. Food cost estimates assume that almost all food is purchased at a grocery store and prepared at home.
We used the 384 metropolitan statistical areas as delineated by the United States Office of Management and Budget and used by the Census Bureau as our definition of metros.
Metros are ranked based on the EPI’s annual food cost estimates. Ties were broken based on the rate of food insecurity. The food insecurity rate – or the share of the population that lacks adequate access to food – is from the Robert Wood Johnson Foundation and the University of Wisconsin Population Health Institute joint program’s 2021 County Health Rankings & Roadmaps report.
Additional information on median family income and the share of households that receive benefits from the Supplemental Nutrition Assistance Program – formerly known as food stamps – are from the U.S. Census Bureau’s 2020 American Community Survey. Because the Census Bureau did not release one-year estimates for 2020 due to data collection issues caused by the COVID-19 pandemic, all ACS data are five-year estimates.
Contact [email protected] for any questions or corrections.