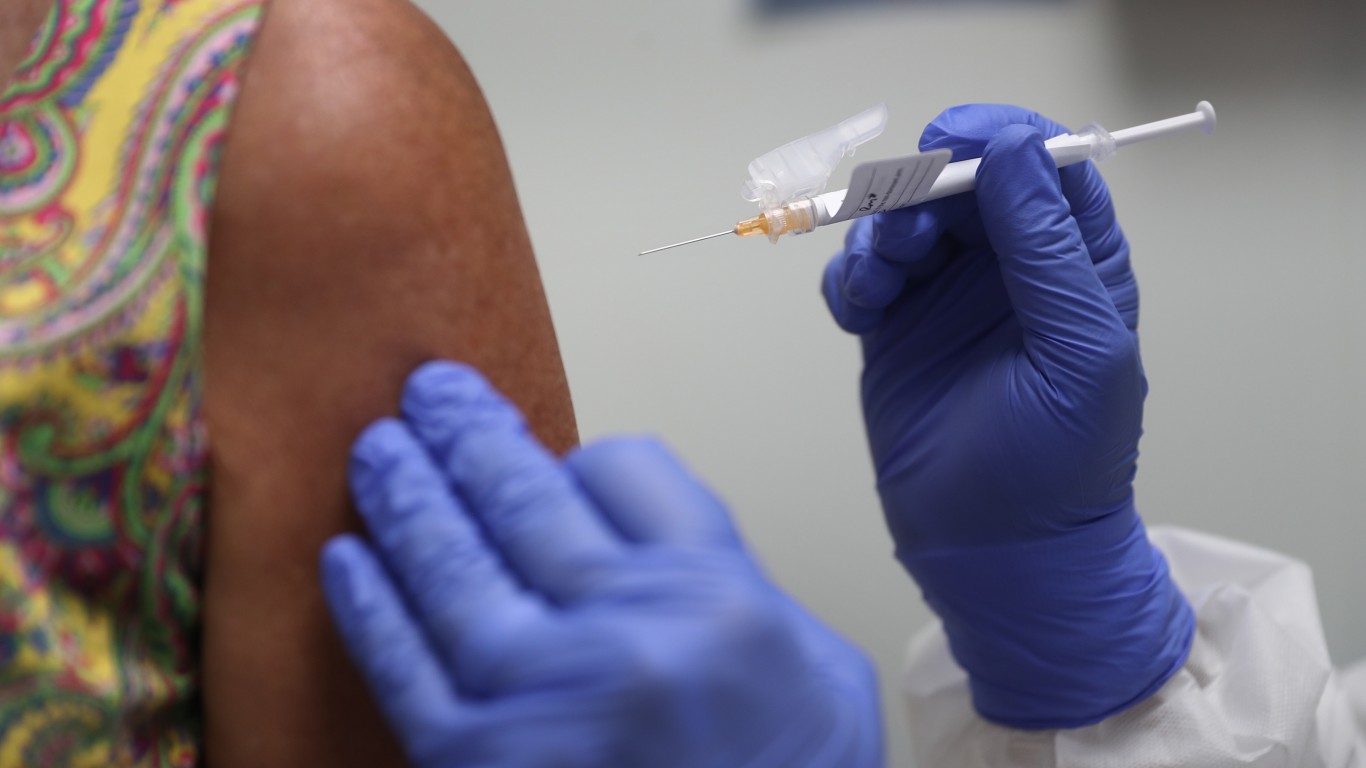

The omicron variant pushed new daily cases of COVID-19 to all-time highs in the United States and underscored the urgency of the national vaccination effort. So far, an estimated 220,287,778 Americans have been fully vaccinated, or 67.3% of the population.
Some states are proving more effective than others in getting their residents vaccinated. Depending on the state, the share of the population that has been fully vaccinated ranges from as low as 51.0% all the way up to 82.9%.
Due in large part to vaccine hesitancy and resistance, millions of doses are currently sitting idle under the purview of state governments, yet to be administered. As of May 10, only about 79.1% of the 733,497,200 doses of the vaccine that have been distributed to the 50 states and Washington D.C. have been administered. In one state, only 64.6% of delivered doses have gone into the arms of residents.
Meanwhile, the virus continues to spread. In total, there have been 24,777 known infections for every 100,000 people nationwide.

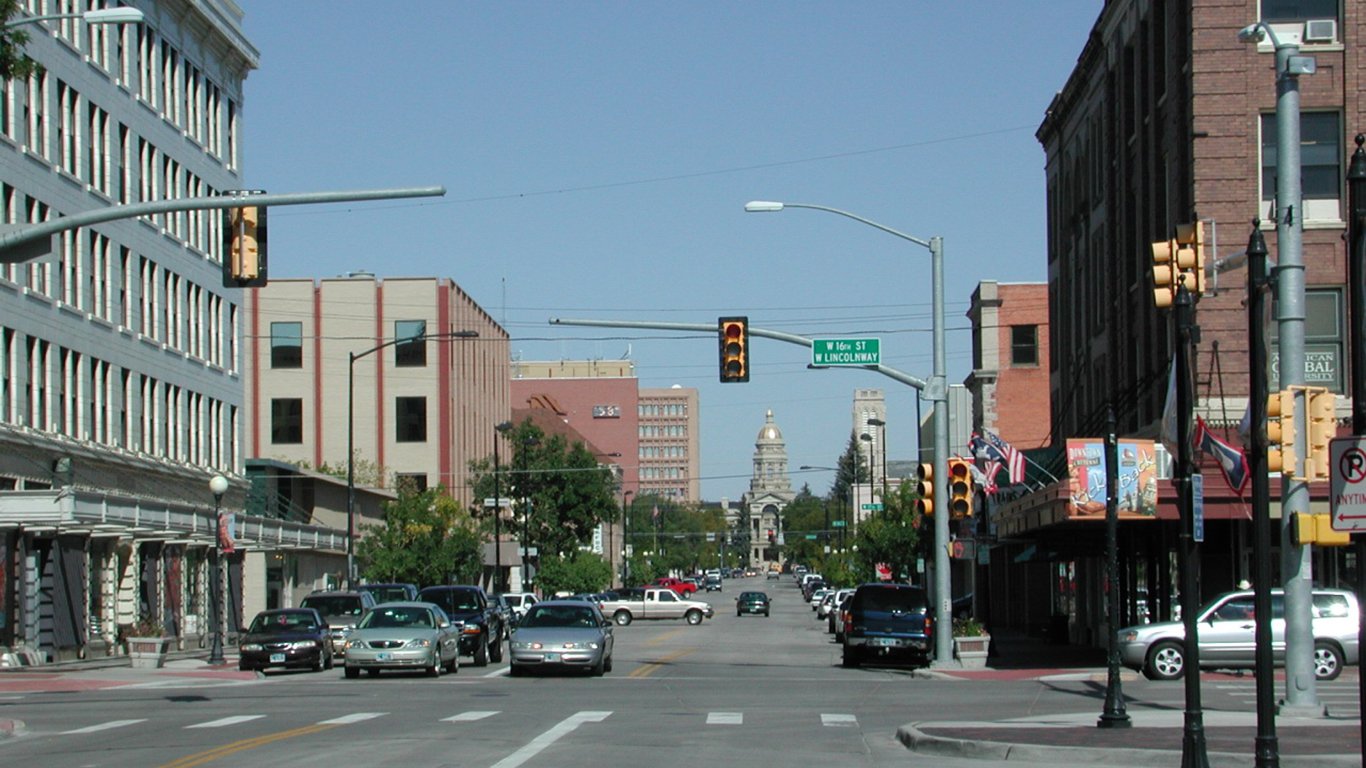
51. Wyoming
> Residents who are fully vaccinated as of May 10, 2022: 294,921 (51.0% of the pop.)
> Share of vaccine doses administered: 75.8%
> Cumulative COVID-19 cases as of May 10, 2022: 27,131 per 100,000 people (total: 156,745)
> Population: 577,737

50. Alabama
> Residents who are fully vaccinated as of May 10, 2022: 2,510,123 (51.4% of the pop.)
> Share of vaccine doses administered: 64.6%
> Cumulative COVID-19 cases as of May 10, 2022: 26,657 per 100,000 people (total: 1,302,945)
> Population: 4,887,871

49. Mississippi
> Residents who are fully vaccinated as of May 10, 2022: 1,544,644 (51.7% of the pop.)
> Share of vaccine doses administered: 69.6%
> Cumulative COVID-19 cases as of May 10, 2022: 26,744 per 100,000 people (total: 798,721)
> Population: 2,986,530

48. Louisiana
> Residents who are fully vaccinated as of May 10, 2022: 2,489,408 (53.4% of the pop.)
> Share of vaccine doses administered: 75.4%
> Cumulative COVID-19 cases as of May 10, 2022: 25,225 per 100,000 people (total: 1,175,460)
> Population: 4,659,978

47. Arkansas
> Residents who are fully vaccinated as of May 10, 2022: 1,645,807 (54.6% of the pop.)
> Share of vaccine doses administered: 68.1%
> Cumulative COVID-19 cases as of May 10, 2022: 27,777 per 100,000 people (total: 837,154)
> Population: 3,013,825

46. Tennessee
> Residents who are fully vaccinated as of May 10, 2022: 3,728,311 (55.1% of the pop.)
> Share of vaccine doses administered: 76.9%
> Cumulative COVID-19 cases as of May 10, 2022: 30,056 per 100,000 people (total: 2,034,782)
> Population: 6,770,010

45. Indiana
> Residents who are fully vaccinated as of May 10, 2022: 3,696,517 (55.2% of the pop.)
> Share of vaccine doses administered: 70.6%
> Cumulative COVID-19 cases as of May 10, 2022: 25,510 per 100,000 people (total: 1,707,085)
> Population: 6,691,878

44. Georgia
> Residents who are fully vaccinated as of May 10, 2022: 5,823,420 (55.4% of the pop.)
> Share of vaccine doses administered: 68.4%
> Cumulative COVID-19 cases as of May 10, 2022: 23,971 per 100,000 people (total: 2,521,664)
> Population: 10,519,475

43. Idaho
> Residents who are fully vaccinated as of May 10, 2022: 975,357 (55.6% of the pop.)
> Share of vaccine doses administered: 72.4%
> Cumulative COVID-19 cases as of May 10, 2022: 25,473 per 100,000 people (total: 446,856)
> Population: 1,754,208
These are all the counties in Idaho where COVID-19 is slowing (and where it’s still getting worse).

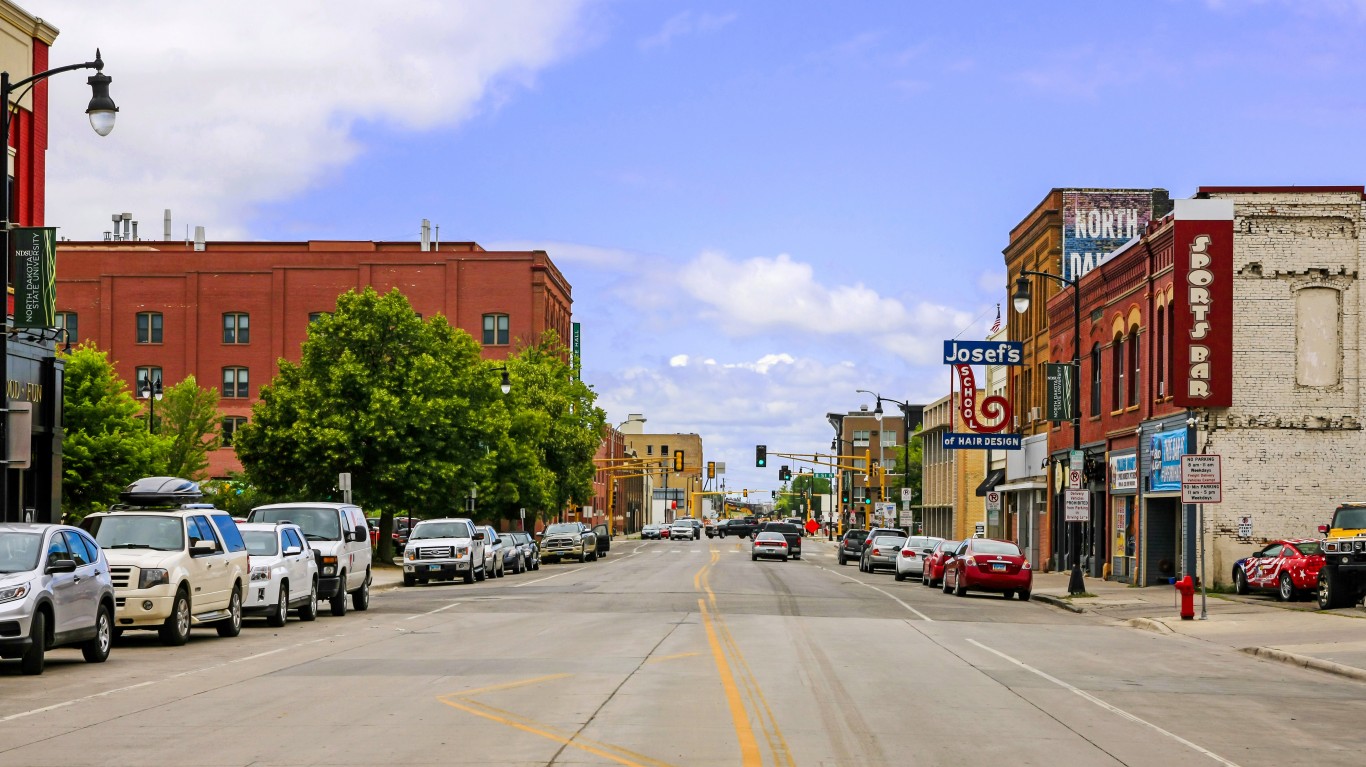
42. North Dakota
> Residents who are fully vaccinated as of May 10, 2022: 424,144 (55.8% of the pop.)
> Share of vaccine doses administered: 79.1%
> Cumulative COVID-19 cases as of May 10, 2022: 31,805 per 100,000 people (total: 241,739)
> Population: 760,077

41. Missouri
> Residents who are fully vaccinated as of May 10, 2022: 3,447,293 (56.3% of the pop.)
> Share of vaccine doses administered: 76.6%
> Cumulative COVID-19 cases as of May 10, 2022: 23,311 per 100,000 people (total: 1,428,117)
> Population: 6,126,452

40. Montana
> Residents who are fully vaccinated as of May 10, 2022: 607,733 (57.2% of the pop.)
> Share of vaccine doses administered: 80.0%
> Cumulative COVID-19 cases as of May 10, 2022: 25,849 per 100,000 people (total: 274,598)
> Population: 1,062,305

39. West Virginia
> Residents who are fully vaccinated as of May 10, 2022: 1,033,454 (57.2% of the pop.)
> Share of vaccine doses administered: 66.5%
> Cumulative COVID-19 cases as of May 10, 2022: 27,850 per 100,000 people (total: 502,930)
> Population: 1,805,832

38. Kentucky
> Residents who are fully vaccinated as of May 10, 2022: 2,567,447 (57.5% of the pop.)
> Share of vaccine doses administered: 73.1%
> Cumulative COVID-19 cases as of May 10, 2022: 29,813 per 100,000 people (total: 1,332,165)
> Population: 4,468,402

37. Oklahoma
> Residents who are fully vaccinated as of May 10, 2022: 2,270,521 (57.6% of the pop.)
> Share of vaccine doses administered: 80.6%
> Cumulative COVID-19 cases as of May 10, 2022: 26,442 per 100,000 people (total: 1,042,637)
> Population: 3,943,079

36. South Carolina
> Residents who are fully vaccinated as of May 10, 2022: 2,941,514 (57.9% of the pop.)
> Share of vaccine doses administered: 71.2%
> Cumulative COVID-19 cases as of May 10, 2022: 29,060 per 100,000 people (total: 1,477,460)
> Population: 5,084,127

35. Ohio
> Residents who are fully vaccinated as of May 10, 2022: 6,845,768 (58.6% of the pop.)
> Share of vaccine doses administered: 76.7%
> Cumulative COVID-19 cases as of May 10, 2022: 23,167 per 100,000 people (total: 2,708,071)
> Population: 11,689,442
These are all the counties in Ohio where COVID-19 is slowing (and where it’s still getting worse).

34. Michigan
> Residents who are fully vaccinated as of May 10, 2022: 6,017,558 (60.2% of the pop.)
> Share of vaccine doses administered: 74.4%
> Cumulative COVID-19 cases as of May 10, 2022: 24,459 per 100,000 people (total: 2,444,891)
> Population: 9,995,915

33. Kansas
> Residents who are fully vaccinated as of May 10, 2022: 1,794,235 (61.6% of the pop.)
> Share of vaccine doses administered: 76.0%
> Cumulative COVID-19 cases as of May 10, 2022: 26,723 per 100,000 people (total: 778,045)
> Population: 2,911,505
These are all the counties in Kansas where COVID-19 is slowing (and where it’s still getting worse).

32. South Dakota
> Residents who are fully vaccinated as of May 10, 2022: 545,551 (61.8% of the pop.)
> Share of vaccine doses administered: 74.9%
> Cumulative COVID-19 cases as of May 10, 2022: 26,998 per 100,000 people (total: 238,185)
> Population: 882,235

31. Nevada
> Residents who are fully vaccinated as of May 10, 2022: 1,876,622 (61.8% of the pop.)
> Share of vaccine doses administered: 82.1%
> Cumulative COVID-19 cases as of May 10, 2022: 23,798 per 100,000 people (total: 722,133)
> Population: 3,034,392
These are all the counties in Nevada where COVID-19 is slowing (and where it’s still getting worse).

30. Alaska
> Residents who are fully vaccinated as of May 10, 2022: 457,284 (62.0% of the pop.)
> Share of vaccine doses administered: 74.2%
> Cumulative COVID-19 cases as of May 10, 2022: 33,406 per 100,000 people (total: 246,345)
> Population: 737,438
These are all the counties in Alaska where COVID-19 is slowing (and where it’s still getting worse).

29. Iowa
> Residents who are fully vaccinated as of May 10, 2022: 1,957,511 (62.0% of the pop.)
> Share of vaccine doses administered: 76.6%
> Cumulative COVID-19 cases as of May 10, 2022: 24,289 per 100,000 people (total: 766,593)
> Population: 3,156,145
These are all the counties in Iowa where COVID-19 is slowing (and where it’s still getting worse).

28. North Carolina
> Residents who are fully vaccinated as of May 10, 2022: 6,440,201 (62.0% of the pop.)
> Share of vaccine doses administered: 75.5%
> Cumulative COVID-19 cases as of May 10, 2022: 25,746 per 100,000 people (total: 2,673,326)
> Population: 10,383,620

27. Texas
> Residents who are fully vaccinated as of May 10, 2022: 17,865,393 (62.2% of the pop.)
> Share of vaccine doses administered: 75.5%
> Cumulative COVID-19 cases as of May 10, 2022: 23,558 per 100,000 people (total: 6,761,711)
> Population: 28,701,845
These are all the counties in Texas where COVID-19 is slowing (and where it’s still getting worse).

26. Arizona
> Residents who are fully vaccinated as of May 10, 2022: 4,492,459 (62.6% of the pop.)
> Share of vaccine doses administered: 81.5%
> Cumulative COVID-19 cases as of May 10, 2022: 28,242 per 100,000 people (total: 2,025,435)
> Population: 7,171,646

25. Nebraska
> Residents who are fully vaccinated as of May 10, 2022: 1,231,862 (63.9% of the pop.)
> Share of vaccine doses administered: 80.4%
> Cumulative COVID-19 cases as of May 10, 2022: 24,922 per 100,000 people (total: 480,805)
> Population: 1,929,268

24. Utah
> Residents who are fully vaccinated as of May 10, 2022: 2,065,141 (65.3% of the pop.)
> Share of vaccine doses administered: 82.9%
> Cumulative COVID-19 cases as of May 10, 2022: 29,593 per 100,000 people (total: 935,479)
> Population: 3,161,105
These are all the counties in Utah where COVID-19 is slowing (and where it’s still getting worse).

23. Wisconsin
> Residents who are fully vaccinated as of May 10, 2022: 3,823,041 (65.8% of the pop.)
> Share of vaccine doses administered: 87.7%
> Cumulative COVID-19 cases as of May 10, 2022: 27,919 per 100,000 people (total: 1,623,087)
> Population: 5,813,568

22. Florida
> Residents who are fully vaccinated as of May 10, 2022: 14,413,807 (67.7% of the pop.)
> Share of vaccine doses administered: 77.7%
> Cumulative COVID-19 cases as of May 10, 2022: 28,008 per 100,000 people (total: 5,965,411)
> Population: 21,299,325

21. Pennsylvania
> Residents who are fully vaccinated as of May 10, 2022: 8,787,666 (68.6% of the pop.)
> Share of vaccine doses administered: 75.0%
> Cumulative COVID-19 cases as of May 10, 2022: 22,133 per 100,000 people (total: 2,834,586)
> Population: 12,807,060

20. Illinois
> Residents who are fully vaccinated as of May 10, 2022: 8,747,591 (68.7% of the pop.)
> Share of vaccine doses administered: 82.5%
> Cumulative COVID-19 cases as of May 10, 2022: 24,875 per 100,000 people (total: 3,169,315)
> Population: 12,741,080

19. Minnesota
> Residents who are fully vaccinated as of May 10, 2022: 3,906,456 (69.6% of the pop.)
> Share of vaccine doses administered: 81.1%
> Cumulative COVID-19 cases as of May 10, 2022: 26,090 per 100,000 people (total: 1,463,955)
> Population: 5,611,179

18. Delaware
> Residents who are fully vaccinated as of May 10, 2022: 674,994 (69.8% of the pop.)
> Share of vaccine doses administered: 76.8%
> Cumulative COVID-19 cases as of May 10, 2022: 27,335 per 100,000 people (total: 264,376)
> Population: 967,171

17. Oregon
> Residents who are fully vaccinated as of May 10, 2022: 2,941,760 (70.2% of the pop.)
> Share of vaccine doses administered: 77.3%
> Cumulative COVID-19 cases as of May 10, 2022: 17,405 per 100,000 people (total: 729,412)
> Population: 4,190,713
These are all the counties in Oregon where COVID-19 is slowing (and where it’s still getting worse).

16. New Hampshire
> Residents who are fully vaccinated as of May 10, 2022: 960,457 (70.8% of the pop.)
> Share of vaccine doses administered: 72.3%
> Cumulative COVID-19 cases as of May 10, 2022: 23,096 per 100,000 people (total: 313,288)
> Population: 1,356,458

15. Colorado
> Residents who are fully vaccinated as of May 10, 2022: 4,051,340 (71.1% of the pop.)
> Share of vaccine doses administered: 85.6%
> Cumulative COVID-19 cases as of May 10, 2022: 24,382 per 100,000 people (total: 1,388,702)
> Population: 5,695,564

14. New Mexico
> Residents who are fully vaccinated as of May 10, 2022: 1,494,120 (71.3% of the pop.)
> Share of vaccine doses administered: 87.9%
> Cumulative COVID-19 cases as of May 10, 2022: 25,004 per 100,000 people (total: 523,940)
> Population: 2,095,428

13. California
> Residents who are fully vaccinated as of May 10, 2022: 28,513,412 (72.1% of the pop.)
> Share of vaccine doses administered: 83.0%
> Cumulative COVID-19 cases as of May 10, 2022: 23,445 per 100,000 people (total: 9,274,208)
> Population: 39,557,045

12. Washington
> Residents who are fully vaccinated as of May 10, 2022: 5,535,274 (73.5% of the pop.)
> Share of vaccine doses administered: 81.0%
> Cumulative COVID-19 cases as of May 10, 2022: 20,062 per 100,000 people (total: 1,511,764)
> Population: 7,535,591

11. Virginia
> Residents who are fully vaccinated as of May 10, 2022: 6,261,697 (73.5% of the pop.)
> Share of vaccine doses administered: 83.6%
> Cumulative COVID-19 cases as of May 10, 2022: 20,172 per 100,000 people (total: 1,718,169)
> Population: 8,517,685

10. New Jersey
> Residents who are fully vaccinated as of May 10, 2022: 6,731,335 (75.6% of the pop.)
> Share of vaccine doses administered: 77.9%
> Cumulative COVID-19 cases as of May 10, 2022: 25,694 per 100,000 people (total: 2,288,950)
> Population: 8,908,520

9. Maryland
> Residents who are fully vaccinated as of May 10, 2022: 4,581,808 (75.8% of the pop.)
> Share of vaccine doses administered: 75.7%
> Cumulative COVID-19 cases as of May 10, 2022: 17,238 per 100,000 people (total: 1,041,621)
> Population: 6,042,718

8. New York
> Residents who are fully vaccinated as of May 10, 2022: 14,995,661 (76.7% of the pop.)
> Share of vaccine doses administered: 84.9%
> Cumulative COVID-19 cases as of May 10, 2022: 26,761 per 100,000 people (total: 5,229,663)
> Population: 19,542,209

7. Hawaii
> Residents who are fully vaccinated as of May 10, 2022: 1,109,417 (78.1% of the pop.)
> Share of vaccine doses administered: 83.8%
> Cumulative COVID-19 cases as of May 10, 2022: 17,326 per 100,000 people (total: 246,110)
> Population: 1,420,491
These are all the counties in Hawaii where COVID-19 is slowing (and where it’s still getting worse).

6. Massachusetts
> Residents who are fully vaccinated as of May 10, 2022: 5,457,960 (79.1% of the pop.)
> Share of vaccine doses administered: 87.4%
> Cumulative COVID-19 cases as of May 10, 2022: 25,787 per 100,000 people (total: 1,779,829)
> Population: 6,902,149

5. Connecticut
> Residents who are fully vaccinated as of May 10, 2022: 2,830,122 (79.2% of the pop.)
> Share of vaccine doses administered: 86.5%
> Cumulative COVID-19 cases as of May 10, 2022: 21,445 per 100,000 people (total: 766,172)
> Population: 3,572,665

4. Maine
> Residents who are fully vaccinated as of May 10, 2022: 1,072,089 (80.1% of the pop.)
> Share of vaccine doses administered: 83.4%
> Cumulative COVID-19 cases as of May 10, 2022: 18,730 per 100,000 people (total: 250,689)
> Population: 1,338,404
These are all the counties in Maine where COVID-19 is slowing (and where it’s still getting worse).

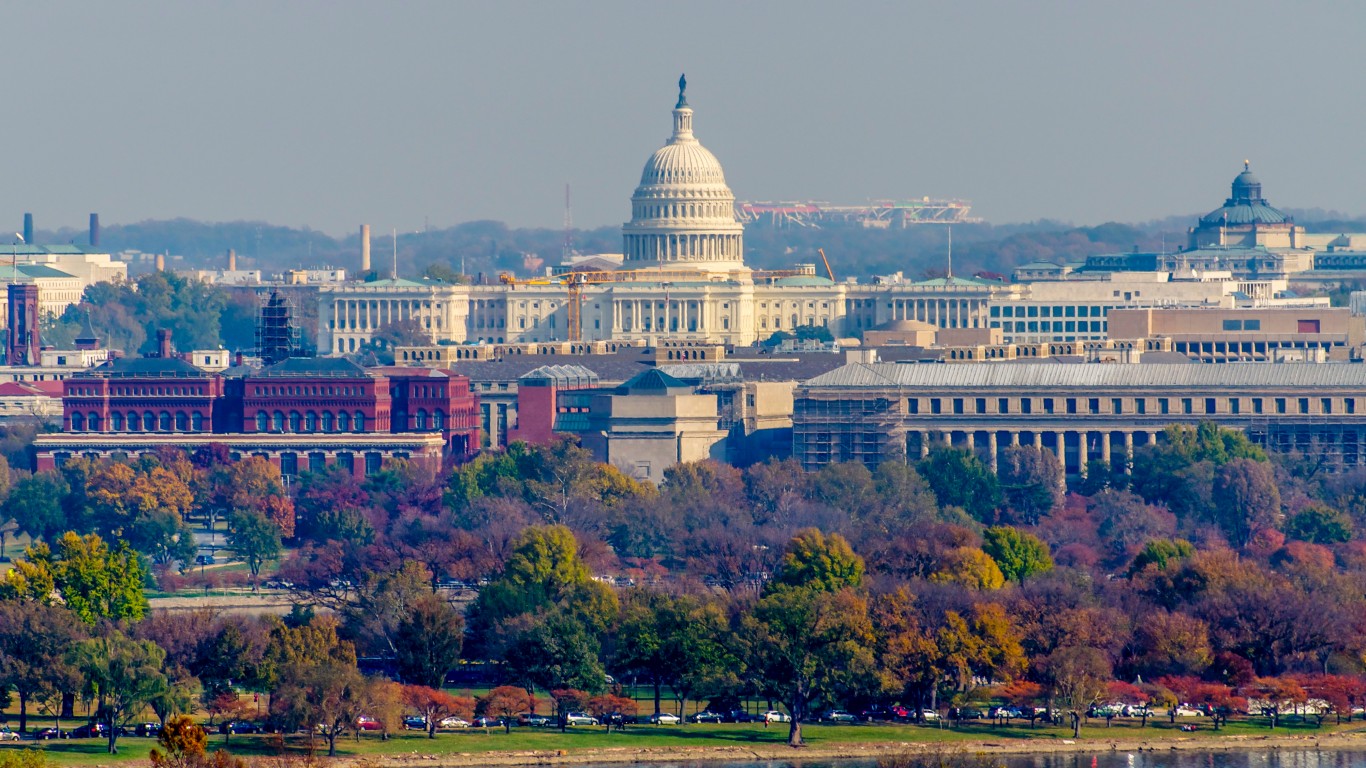
3. District of Columbia
> Residents who are fully vaccinated as of May 10, 2022: 549,099 (80.2% of the pop.)
> Share of vaccine doses administered: 83.5%
> Cumulative COVID-19 cases as of May 10, 2022: 20,737 per 100,000 people (total: 141,943)
> Population: 684,498
Click here to see all current COVID-19 data for Washington D.C.

2. Vermont
> Residents who are fully vaccinated as of May 10, 2022: 507,383 (81.0% of the pop.)
> Share of vaccine doses administered: 77.9%
> Cumulative COVID-19 cases as of May 10, 2022: 18,724 per 100,000 people (total: 117,267)
> Population: 626,299

1. Rhode Island
> Residents who are fully vaccinated as of May 10, 2022: 876,588 (82.9% of the pop.)
> Share of vaccine doses administered: 85.4%
> Cumulative COVID-19 cases as of May 10, 2022: 33,797 per 100,000 people (total: 357,345)
> Population: 1,057,315
Click here to see all coronavirus data for every state.
Take This Retirement Quiz To Get Matched With A Financial Advisor (Sponsored)
Take the quiz below to get matched with a financial advisor today.
Each advisor has been vetted by SmartAsset and is held to a fiduciary standard to act in your best interests.
Here’s how it works:
1. Answer SmartAsset advisor match quiz
2. Review your pre-screened matches at your leisure. Check out the
advisors’ profiles.
3. Speak with advisors at no cost to you. Have an introductory call on the phone or introduction in person and choose whom to work with in the future
Take the retirement quiz right here.
Thank you for reading! Have some feedback for us?
Contact the 24/7 Wall St. editorial team.


