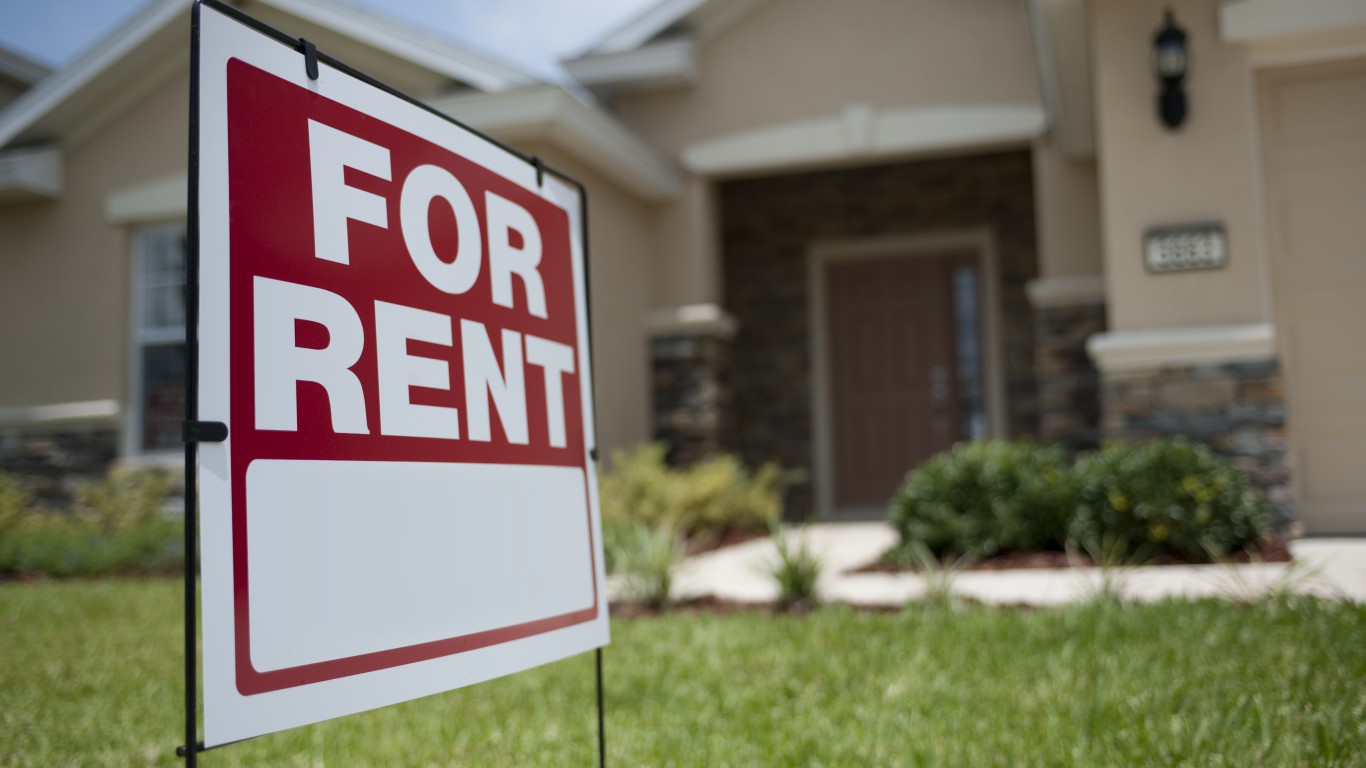
Rents across the country have gone through a period of historical growth in the past two years. According to real estate research firm CoStar Group, rents in the U.S. rose 11.3% last year. In contrast, over the previous five years, gross rents increased by 18.1%.
Rising rent prices are the result of soaring inflation and a squeeze on inventory. This lack of supply relative to demand comes as the number of people seeking to rent has increased substantially during the pandemic, while the number of available properties has been limited by shortages of building materials and other delays in construction resulting from the pandemic. This is the industry laying off the most Americans.
To determine the 50 cities with the highest rent, 24/7 Wall St. reviewed five-year estimates of median gross rent from the U.S. Census Bureau’s 2020 American Community Survey. The median gross rent across the United States is $1,096, and in the 50 cities on this list, defined as having populations greater than 25,000, monthly rents range from $2,305 to $3,375.
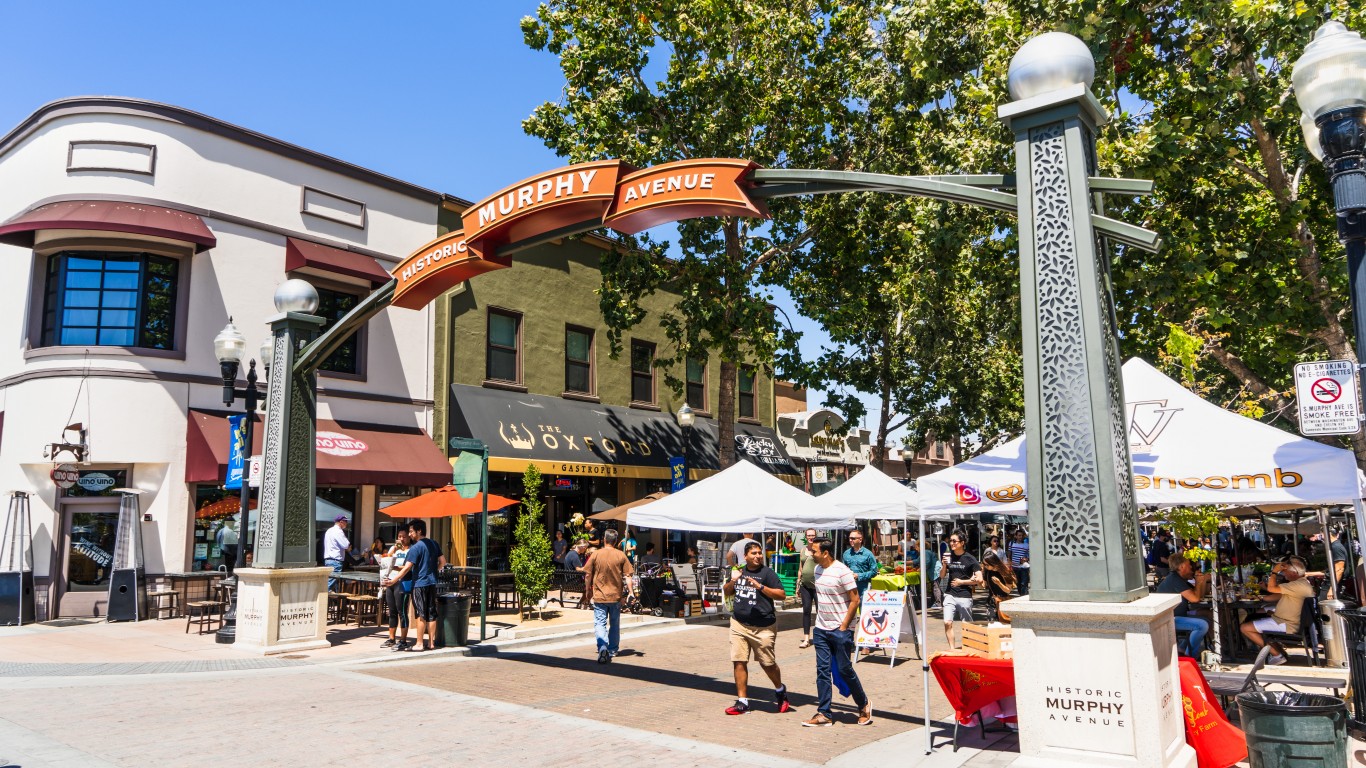
California alone is the home state of 39 of the 50 cities with the most expensive rent. Included are some of the affluent communities of Silicon Valley, such as Cupertino, Los Altos, Saratoga, and Palo Alto, as well as the most expensive parts of Los Angeles, San Francisco, and San Jose. Other states with cities on this list include Virginia, with three, and Hawaii, New Jersey, and Massachusetts, with two each. These are the states with the highest rent.
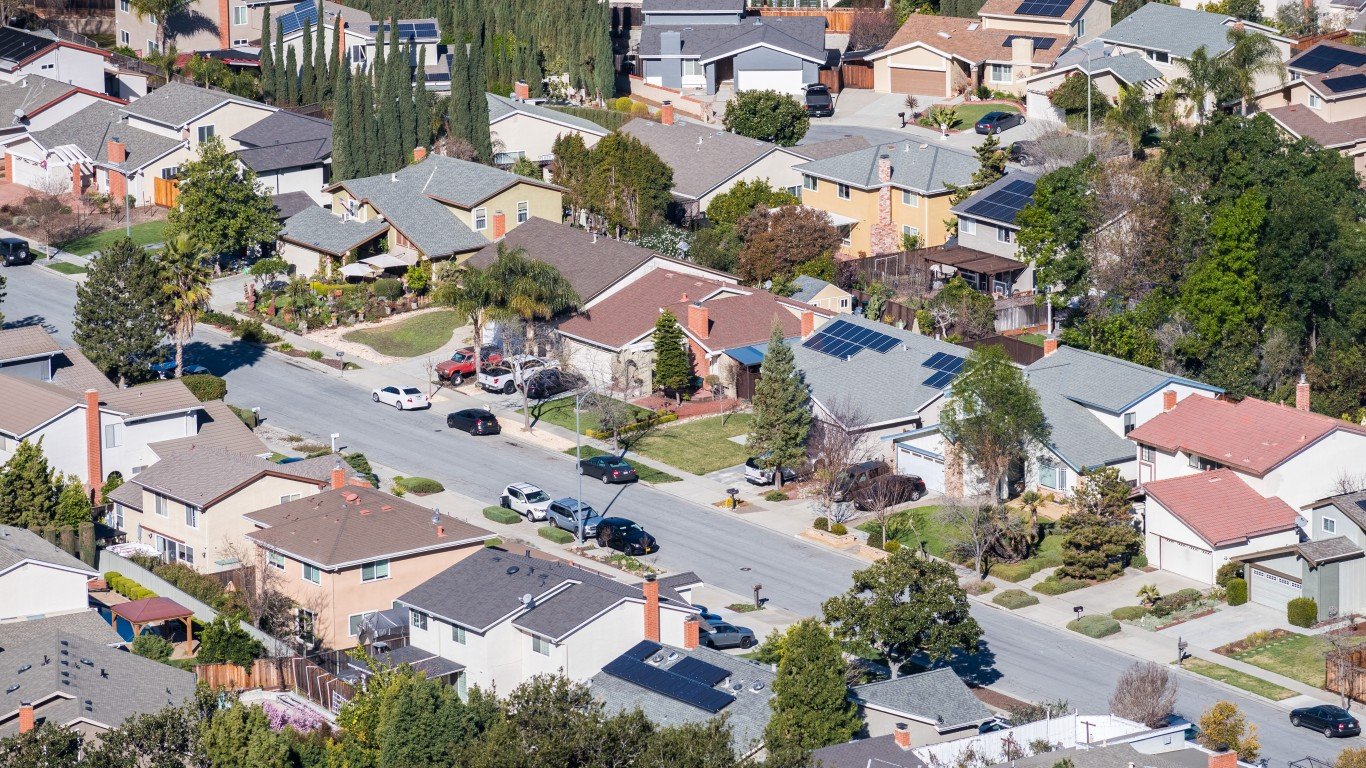
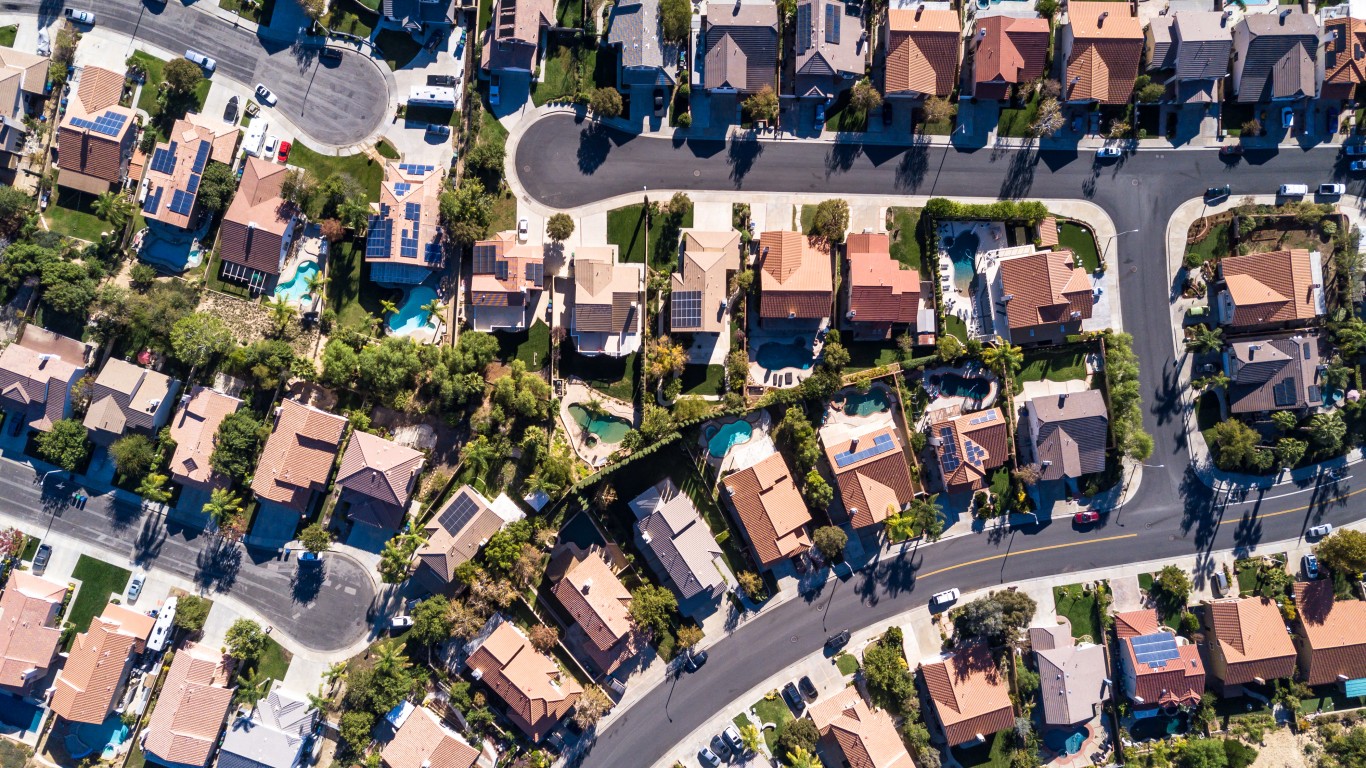
In many of the cities where rent costs are higher, a larger share of housing units are occupied by renters, rather than homeowners. This is largely because these places have more expensive housing markets as a whole, meaning residents are priced out of the possibility of owning a home and are forced to rent. Nationwide, the median home value is $229,800. In all 50 cities on this list, the typical home is worth at least double that, and 23 cities on this list have a median home value in excess of $1 million.
Property is actually, in many of these places, relatively affordable after accounting for the typical resident’s income. In roughly two-thirds of the cities on this list, median gross rent accounts for less than 29.6% of the local median household income – the national figure of rent as a percentage of income. In Los Altos, California, which has the highest rent of any city, the median gross rent is equal to 19.2% of the city’s annual median household income. These are the richest cities in America.
Click here for the cities with the highest rent
Click here for our detailed methodology
50. Brookline, Massachusetts
> Median monthly rental cost: $2,305
> Share of income typically spent on rent: 29.1% — 704th lowest of 1,778 cities (tied)
> Rental occupied housing units: 51.5% — 341st highest of 1,778 cities
> Median home value: $1,006,200 — 34th highest of 1,778 cities
[in-text-ad]
49. Union City, California
> Median monthly rental cost: $2,322
> Share of income typically spent on rent: 26.9% — 314th lowest of 1,778 cities (tied)
> Rental occupied housing units: 35.0% — 688th lowest of 1,778 cities
> Median home value: $812,000 — 82nd highest of 1,778 cities
[recirclink id=1090849]
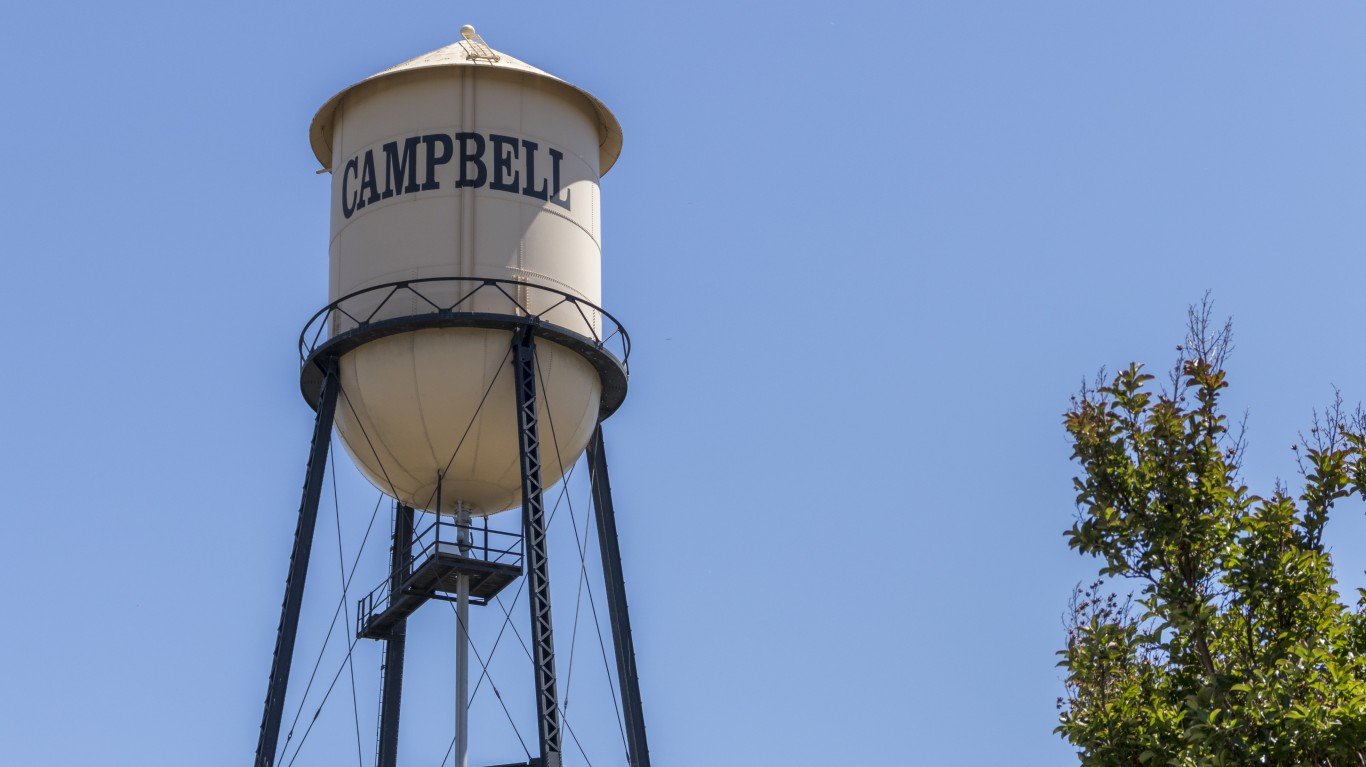
48. Campbell, California
> Median monthly rental cost: $2,323
> Share of income typically spent on rent: 29.8% — 848th lowest of 1,778 cities (tied)
> Rental occupied housing units: 50.8% — 360th highest of 1,778 cities
> Median home value: $1,156,000 — 24th highest of 1,778 cities
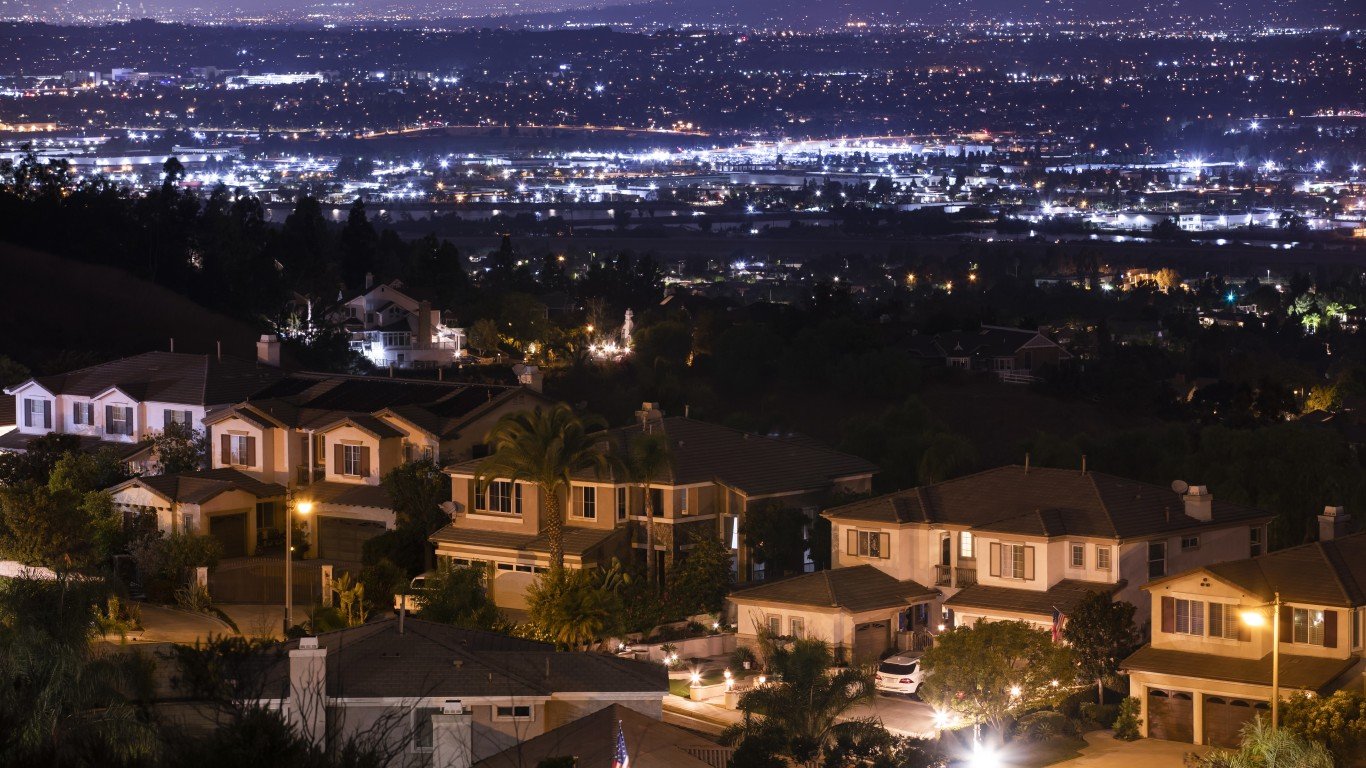
47. Yorba Linda, California
> Median monthly rental cost: $2,323
> Share of income typically spent on rent: 31.5% — 629th highest of 1,778 cities (tied)
> Rental occupied housing units: 17.6% — 126th lowest of 1,778 cities
> Median home value: $862,900 — 68th highest of 1,778 cities
[in-text-ad-2]
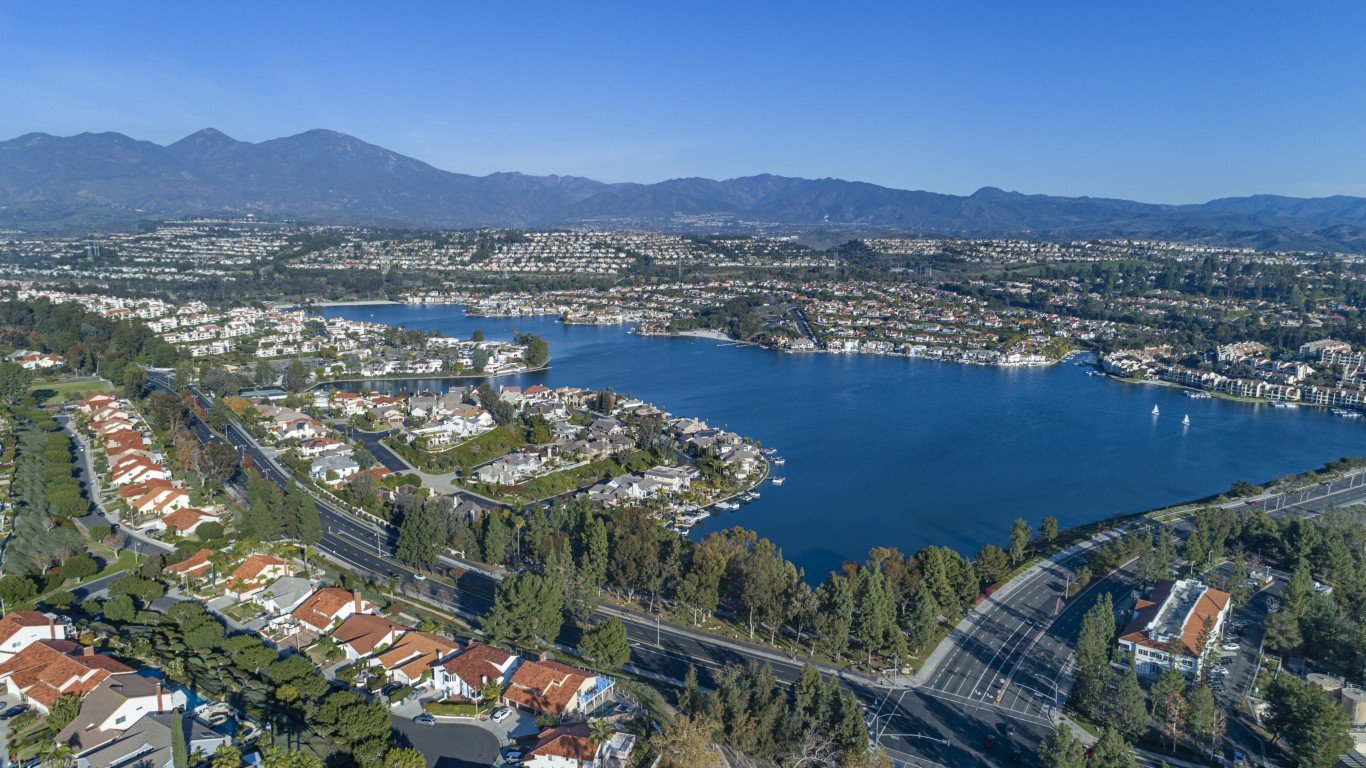
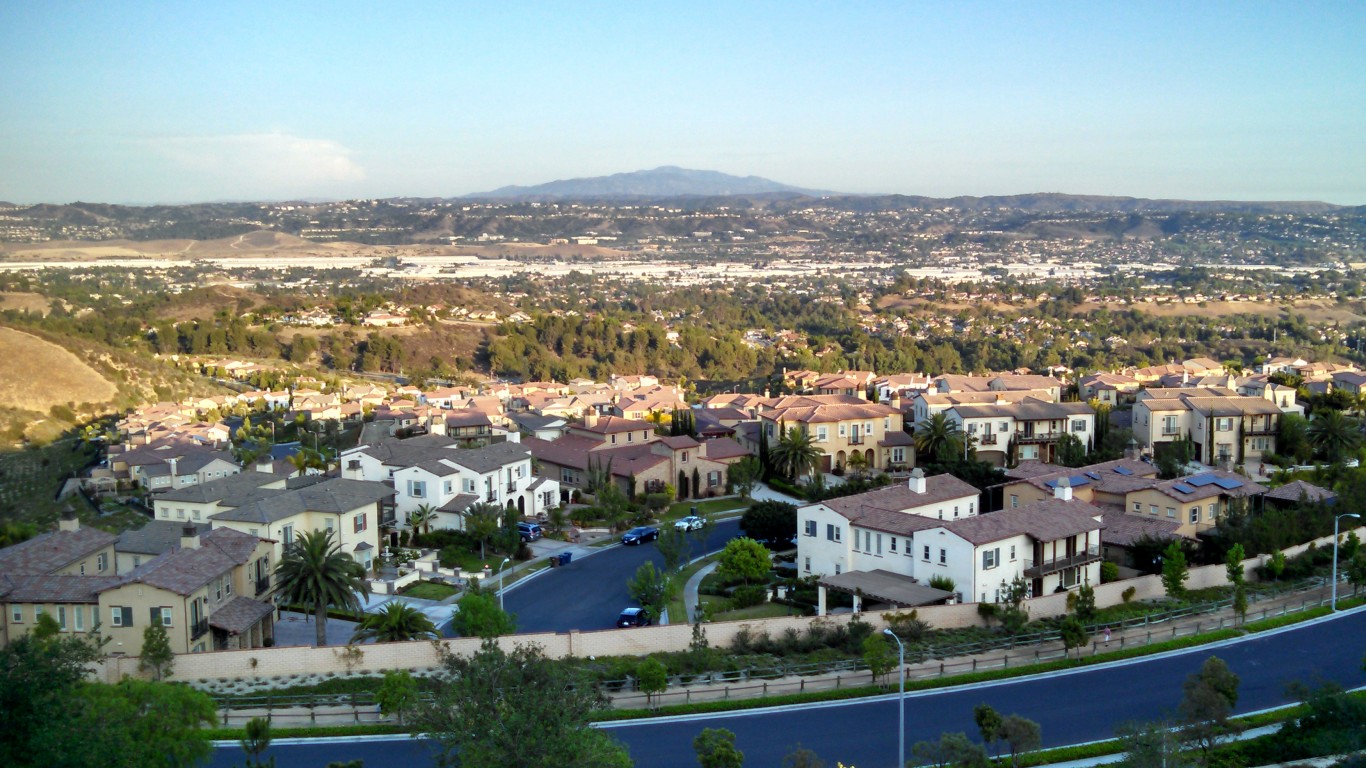
46. Mission Viejo, California
> Median monthly rental cost: $2,326
> Share of income typically spent on rent: 33.2% — 382nd highest of 1,778 cities (tied)
> Rental occupied housing units: 22.8% — 254th lowest of 1,778 cities
> Median home value: $732,100 — 104th highest of 1,778 cities
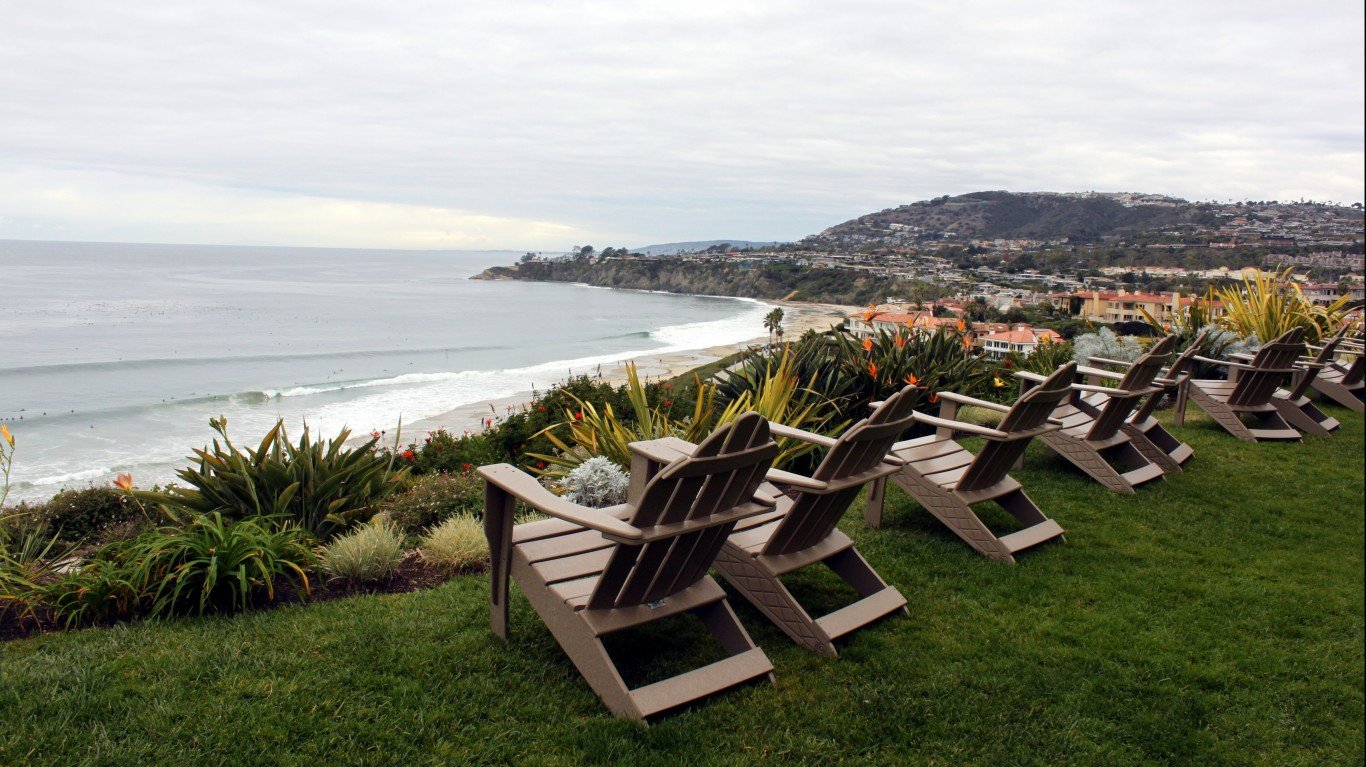
45. Laguna Niguel, California
> Median monthly rental cost: $2,331
> Share of income typically spent on rent: 33.3% — 370th highest of 1,778 cities (tied)
> Rental occupied housing units: 31.4% — 547th lowest of 1,778 cities
> Median home value: $863,600 — 67th highest of 1,778 cities
[in-text-ad]

44. Aliso Viejo, California
> Median monthly rental cost: $2,335
> Share of income typically spent on rent: 31.9% — 562nd highest of 1,778 cities (tied)
> Rental occupied housing units: 42.0% — 753rd highest of 1,778 cities
> Median home value: $656,600 — 139th highest of 1,778 cities
[recirclink id=1090988]

43. Burke, Virginia
> Median monthly rental cost: $2,345
> Share of income typically spent on rent: 27.6% — 412th lowest of 1,778 cities (tied)
> Rental occupied housing units: 13.0% — 46th lowest of 1,778 cities
> Median home value: $557,000 — 209th highest of 1,778 cities
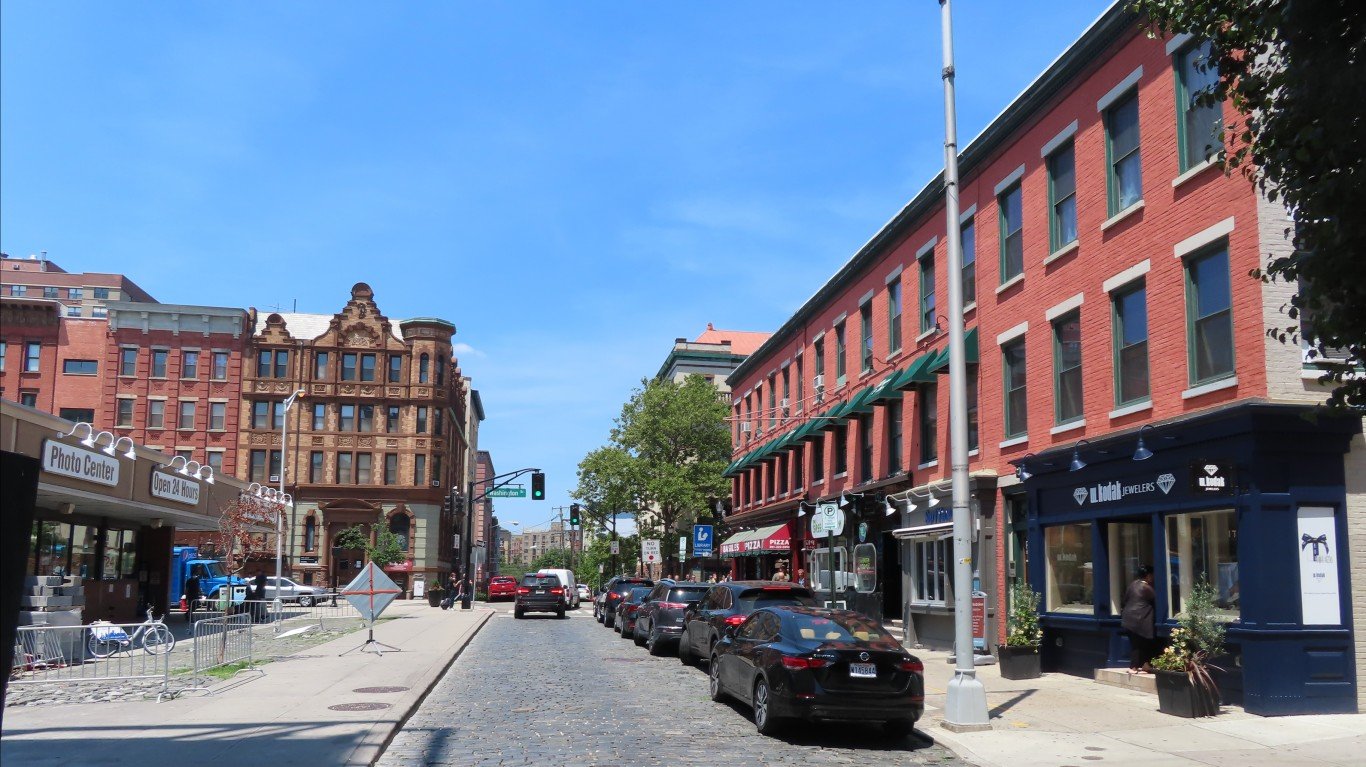
42. Hoboken, New Jersey
> Median monthly rental cost: $2,360
> Share of income typically spent on rent: 23.1% — 29th lowest of 1,778 cities (tied)
> Rental occupied housing units: 65.4% — 54th highest of 1,778 cities
> Median home value: $759,800 — 97th highest of 1,778 cities
[in-text-ad-2]
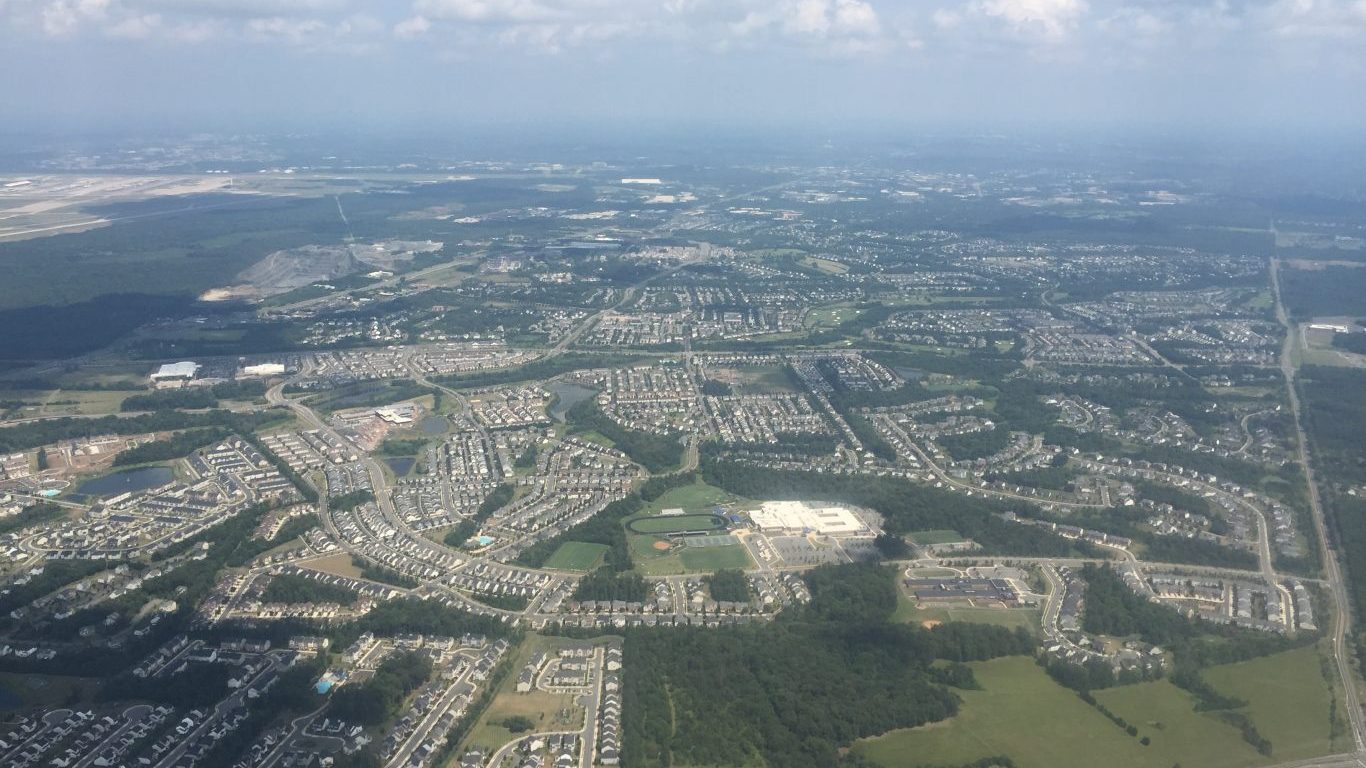
41. South Riding, Virginia
> Median monthly rental cost: $2,366
> Share of income typically spent on rent: 27.8% — 452nd lowest of 1,778 cities (tied)
> Rental occupied housing units: 15.9% — 98th lowest of 1,778 cities
> Median home value: $549,100 — 218th highest of 1,778 cities
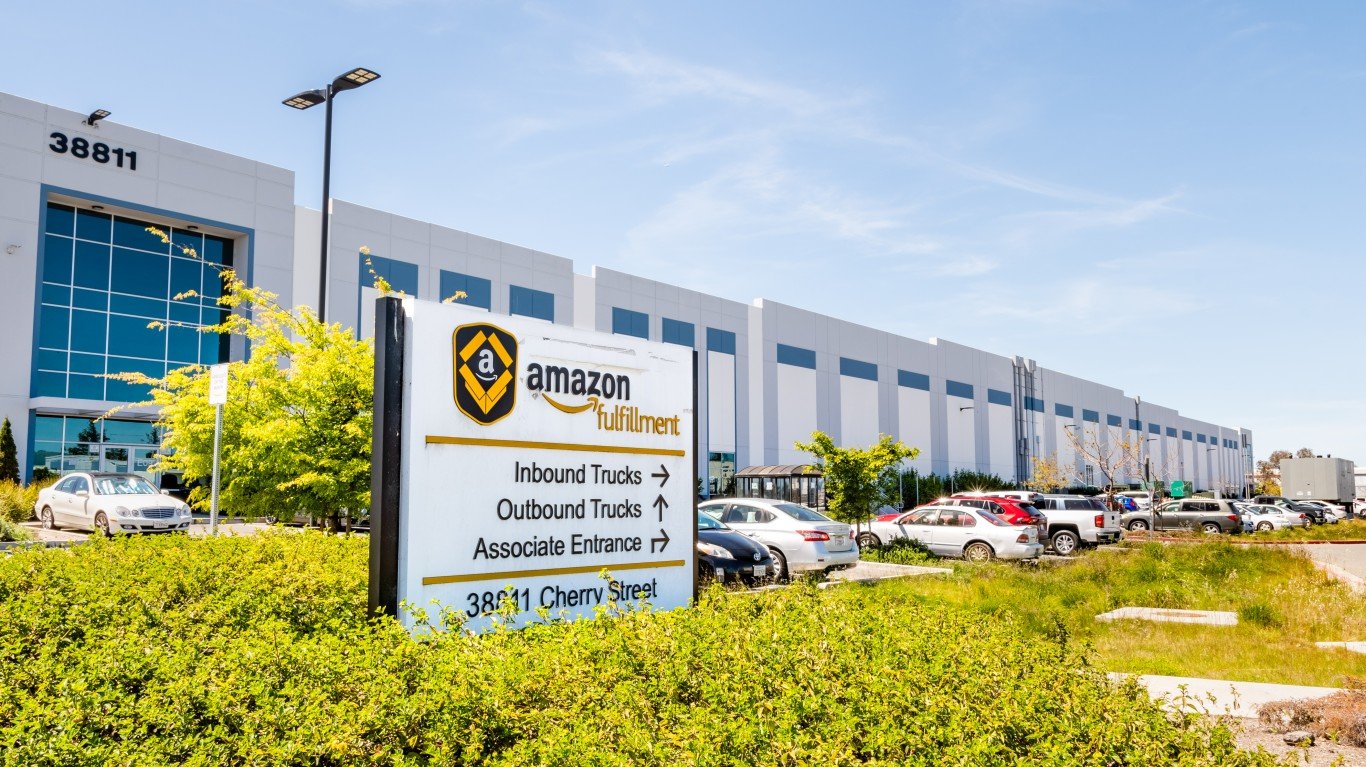
40. Newark, California
> Median monthly rental cost: $2,366
> Share of income typically spent on rent: 28.3% — 532nd lowest of 1,778 cities (tied)
> Rental occupied housing units: 31.5% — 551st lowest of 1,778 cities
> Median home value: $816,100 — 77th highest of 1,778 cities
[in-text-ad]
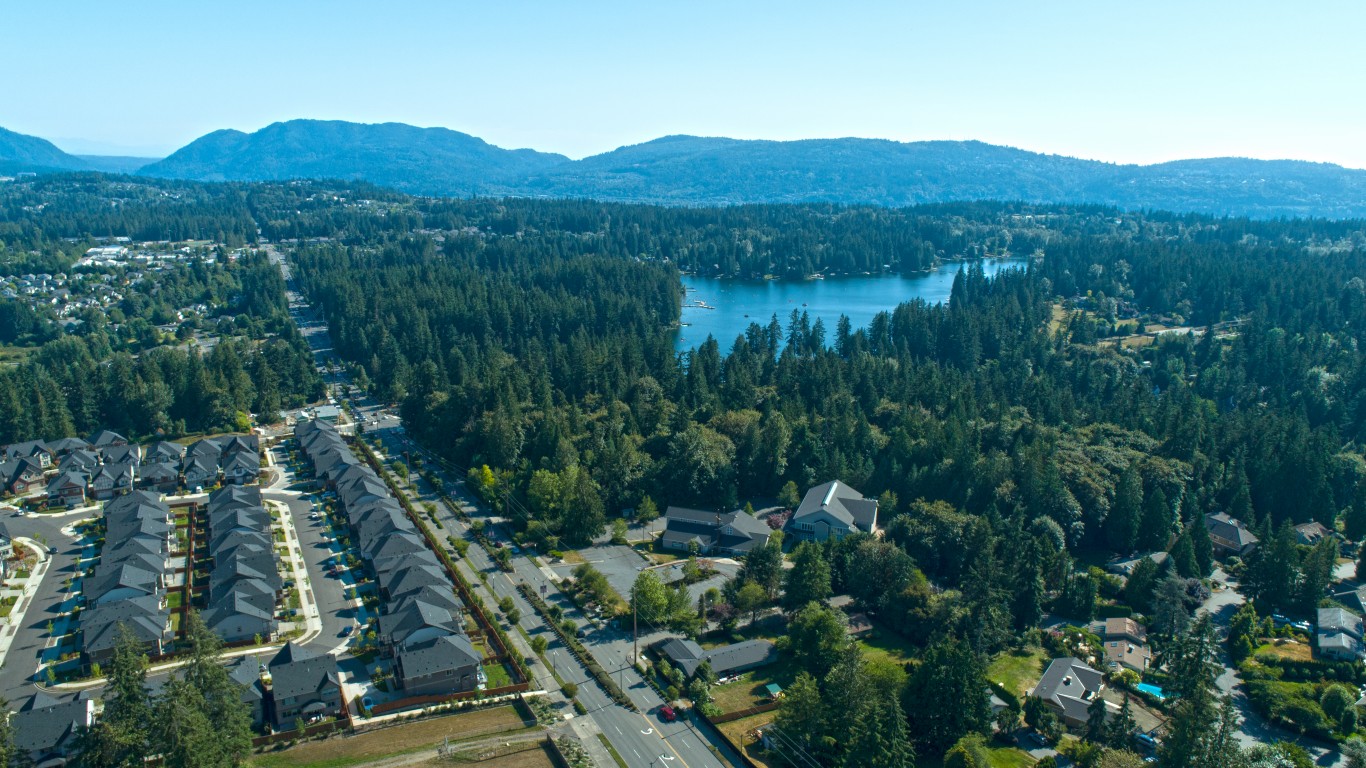
39. Sammamish, Washington
> Median monthly rental cost: $2,395
> Share of income typically spent on rent: 24.5% — 100th lowest of 1,778 cities (tied)
> Rental occupied housing units: 14.1% — 60th lowest of 1,778 cities
> Median home value: $878,000 — 64th highest of 1,778 cities
[recirclink id=1094298]

38. San Ramon, California
> Median monthly rental cost: $2,395
> Share of income typically spent on rent: 28.0% — 485th lowest of 1,778 cities (tied)
> Rental occupied housing units: 28.2% — 422nd lowest of 1,778 cities
> Median home value: $1,001,600 — 35th highest of 1,778 cities
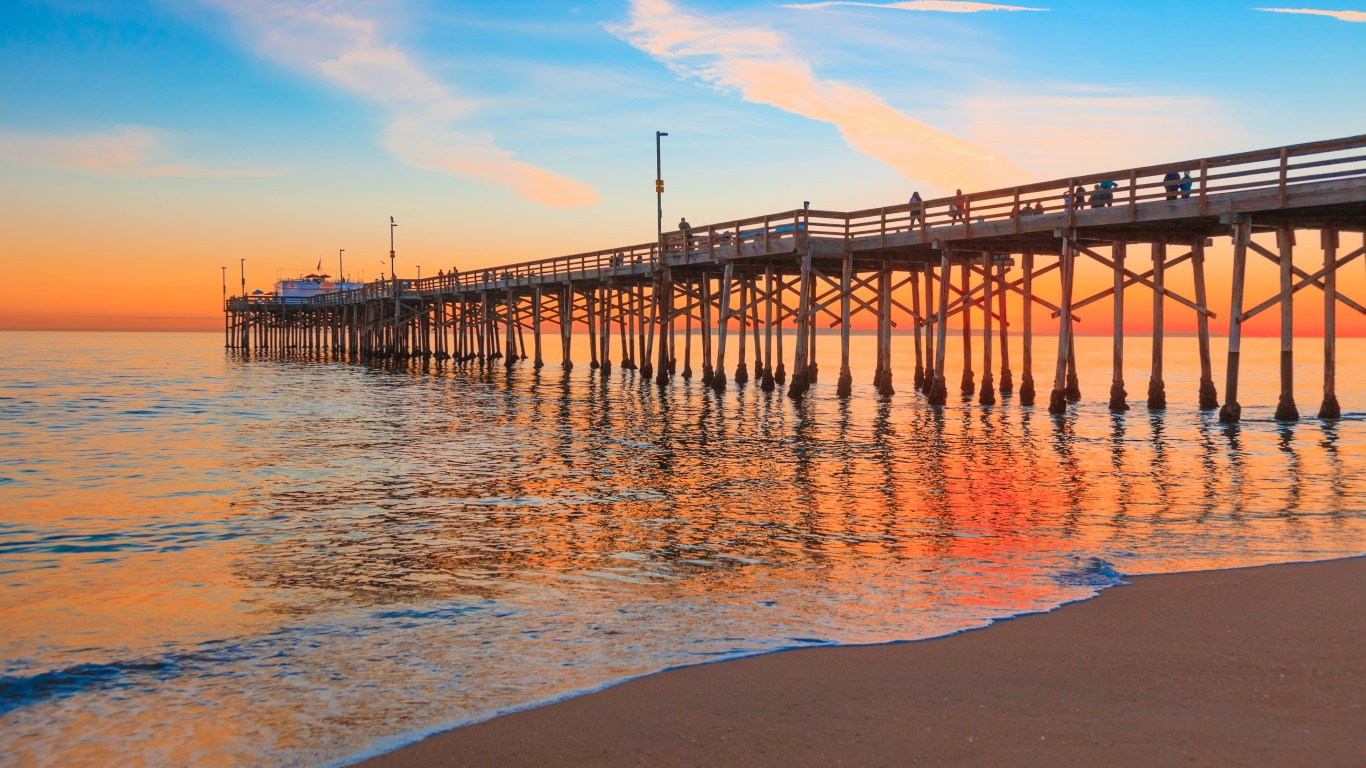
37. Newport Beach, California
> Median monthly rental cost: $2,409
> Share of income typically spent on rent: 29.0% — 680th lowest of 1,778 cities (tied)
> Rental occupied housing units: 45.7% — 566th highest of 1,778 cities
> Median home value: $1,976,400 — 8th highest of 1,778 cities
[in-text-ad-2]
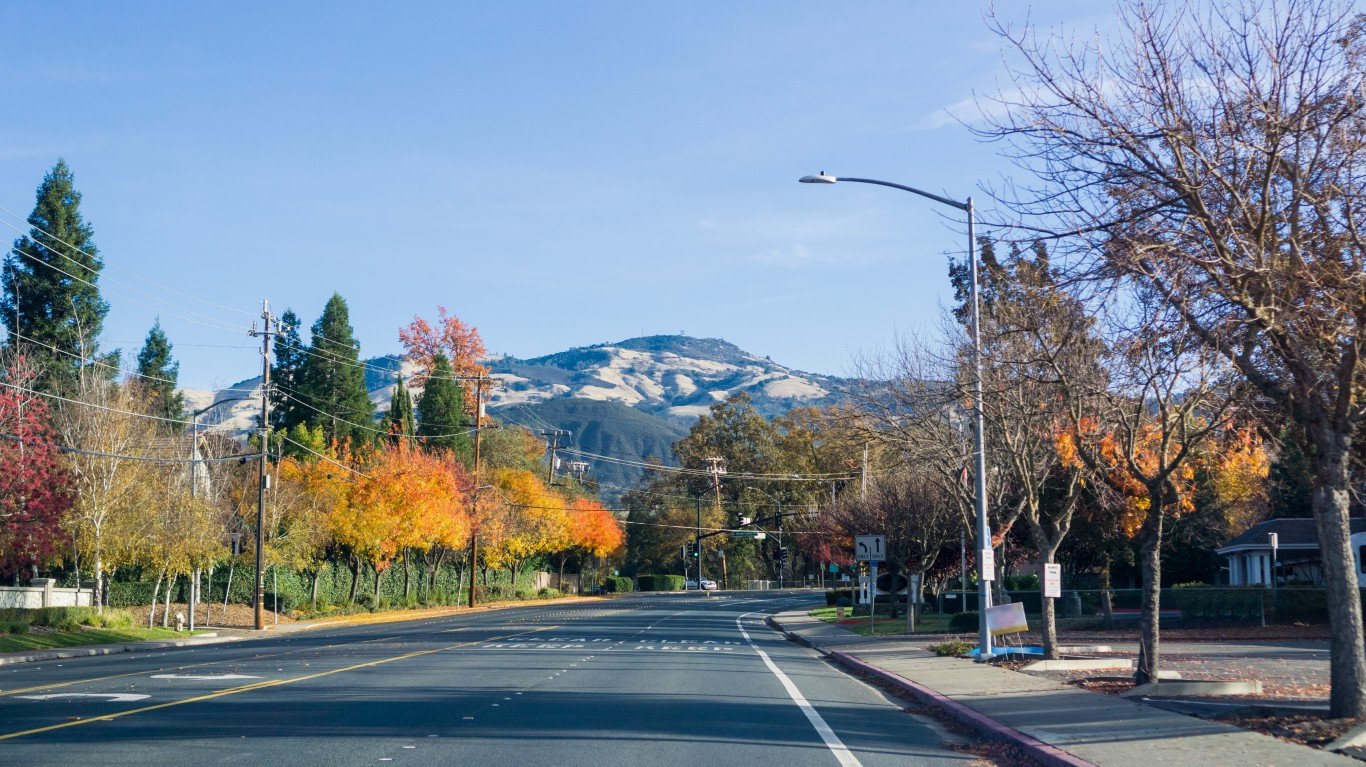
36. Danville, California
> Median monthly rental cost: $2,414
> Share of income typically spent on rent: 27.3% — 366th lowest of 1,778 cities (tied)
> Rental occupied housing units: 15.3% — 85th lowest of 1,778 cities
> Median home value: $1,152,300 — 25th highest of 1,778 cities (tied)

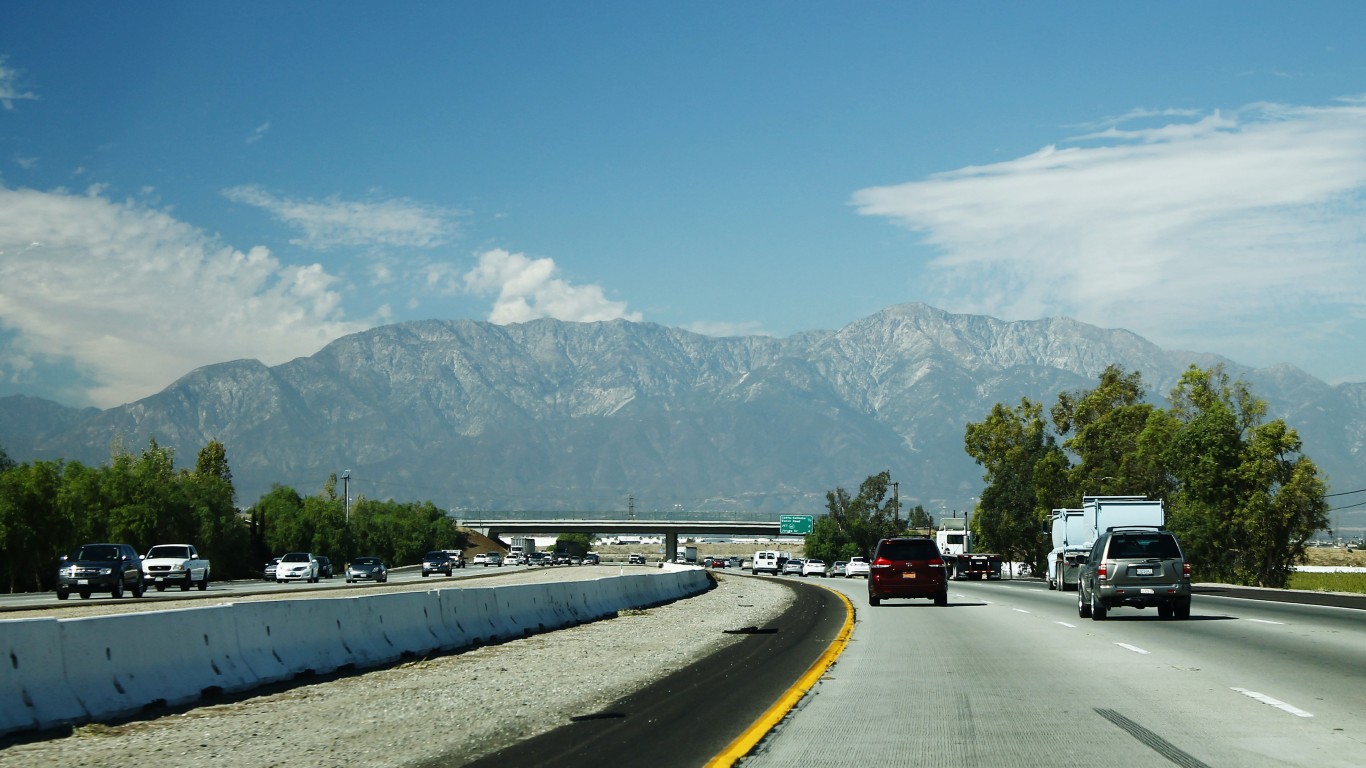
35. Temescal Valley, California
> Median monthly rental cost: $2,419
> Share of income typically spent on rent: 34.5% — 256th highest of 1,778 cities (tied)
> Rental occupied housing units: 17.3% — 119th lowest of 1,778 cities
> Median home value: $476,600 — 279th highest of 1,778 cities
[in-text-ad]
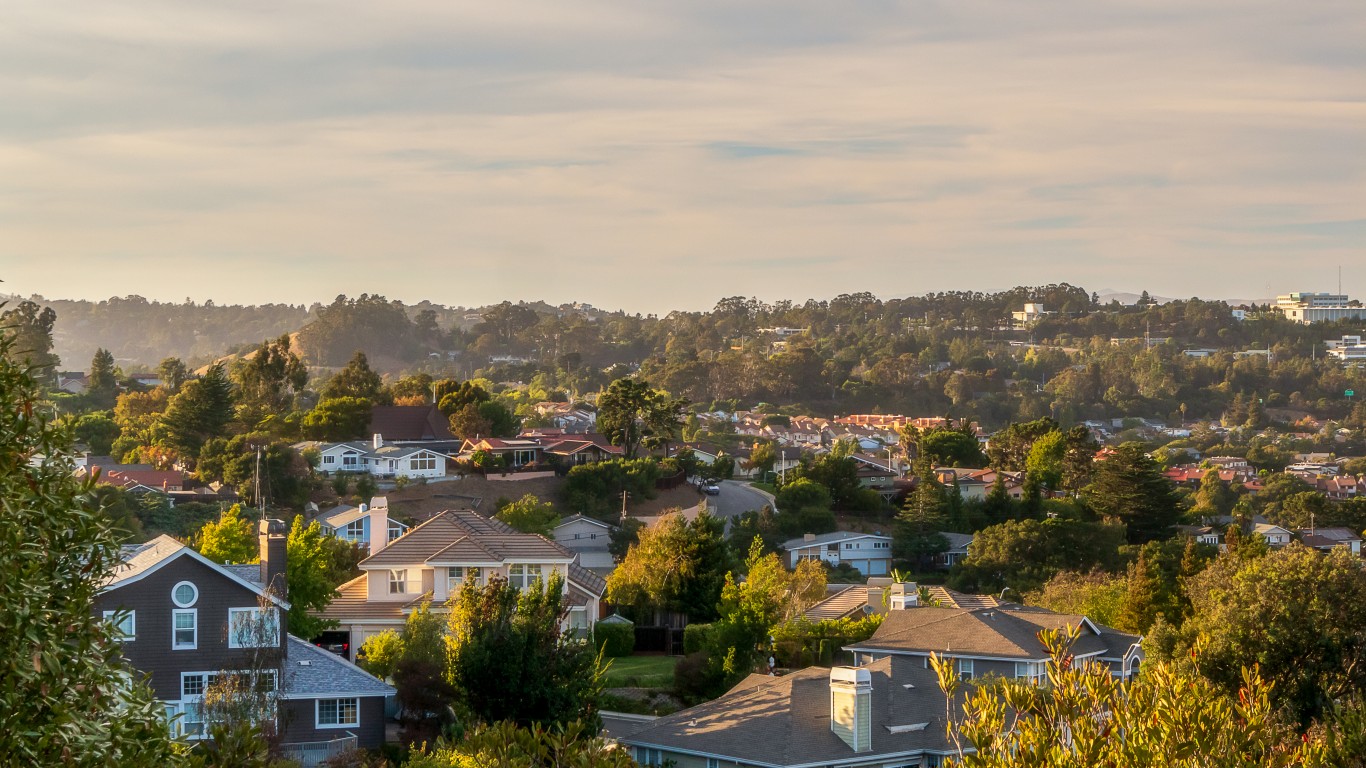
34. San Carlos, California
> Median monthly rental cost: $2,423
> Share of income typically spent on rent: 23.8% — 53rd lowest of 1,778 cities (tied)
> Rental occupied housing units: 30.5% — 515th lowest of 1,778 cities
> Median home value: $1,756,800 — 11th highest of 1,778 cities
[recirclink id=1101677]
33. Irvine, California
> Median monthly rental cost: $2,425
> Share of income typically spent on rent: 31.7% — 599th highest of 1,778 cities (tied)
> Rental occupied housing units: 54.8% — 242nd highest of 1,778 cities
> Median home value: $861,700 — 69th highest of 1,778 cities
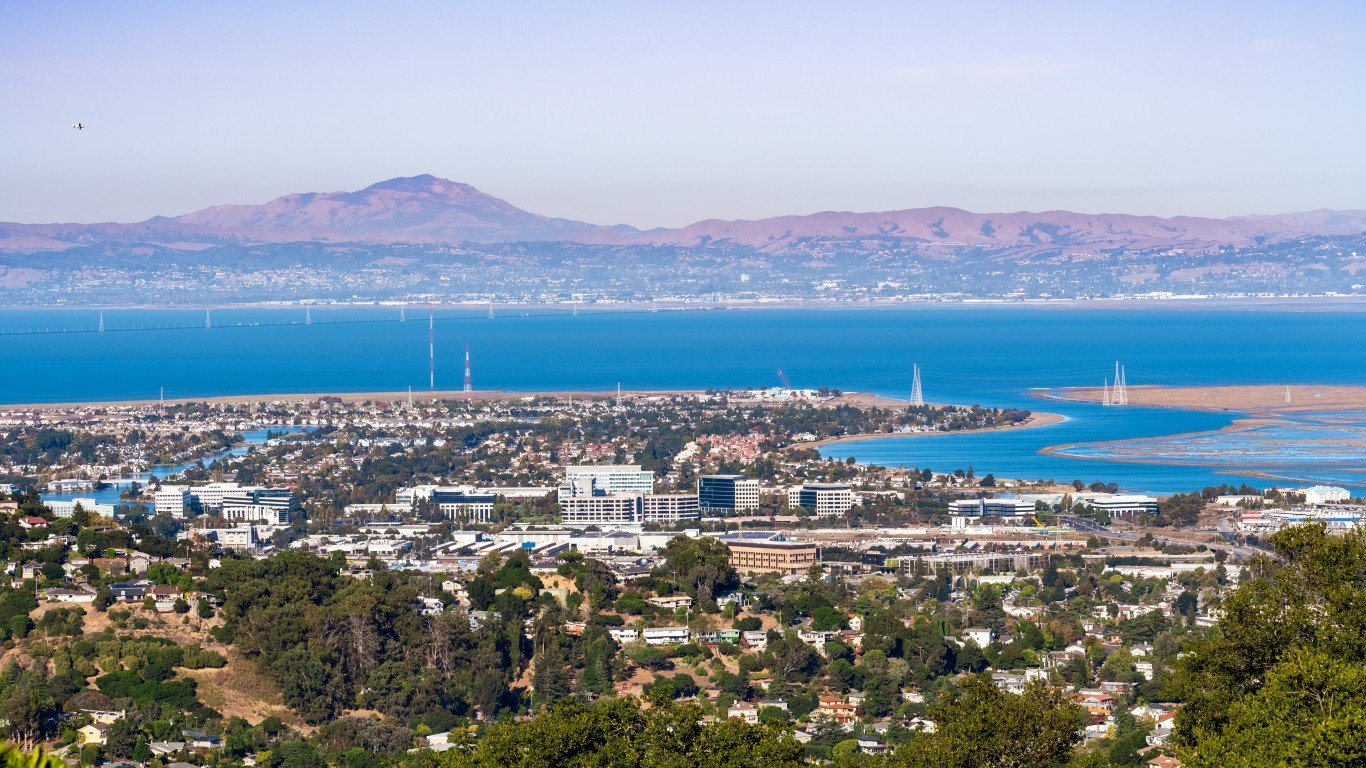
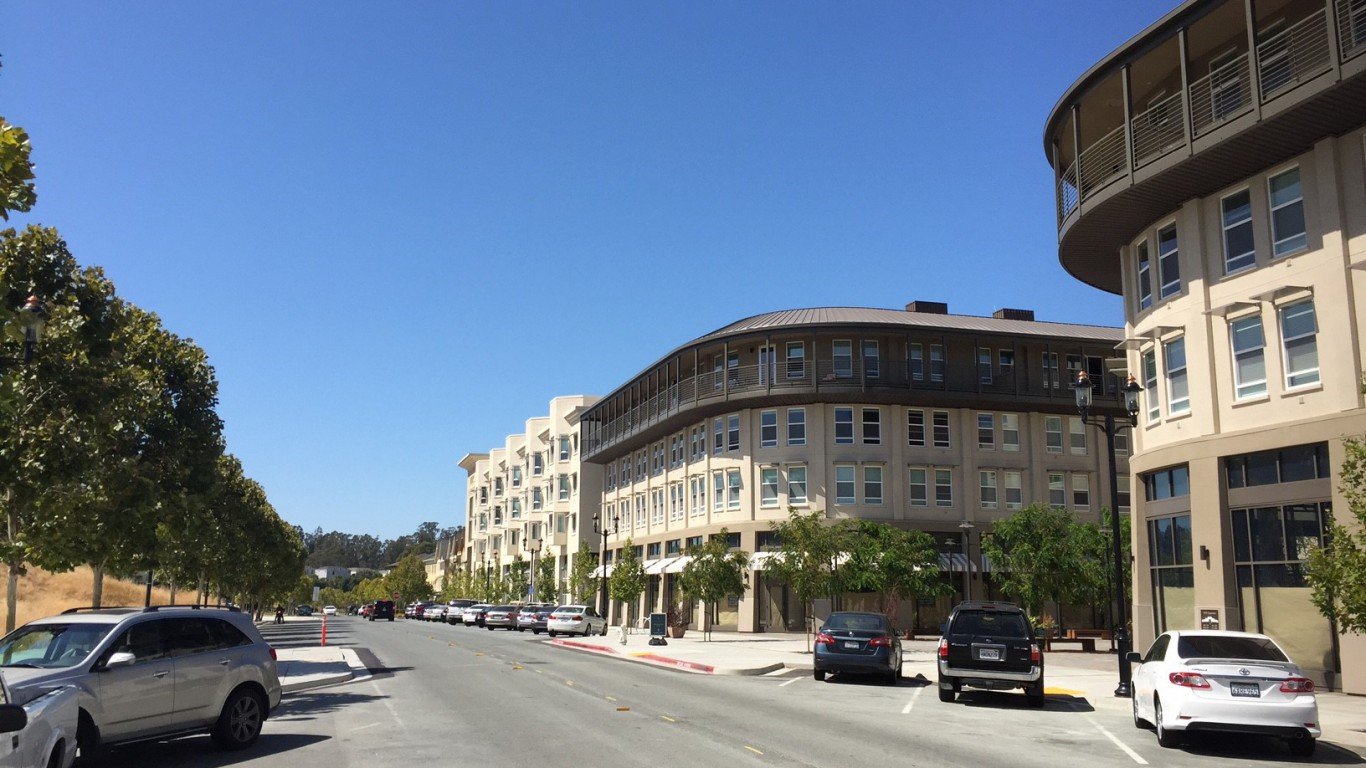
32. Redwood City, California
> Median monthly rental cost: $2,427
> Share of income typically spent on rent: 30.8% — 735th highest of 1,778 cities (tied)
> Rental occupied housing units: 52.5% — 304th highest of 1,778 cities
> Median home value: $1,424,200 — 16th highest of 1,778 cities
[in-text-ad-2]

31. Lexington, Massachusetts
> Median monthly rental cost: $2,431
> Share of income typically spent on rent: 28.5% — 564th lowest of 1,778 cities (tied)
> Rental occupied housing units: 18.3% — 138th lowest of 1,778 cities
> Median home value: $933,800 — 49th highest of 1,778 cities
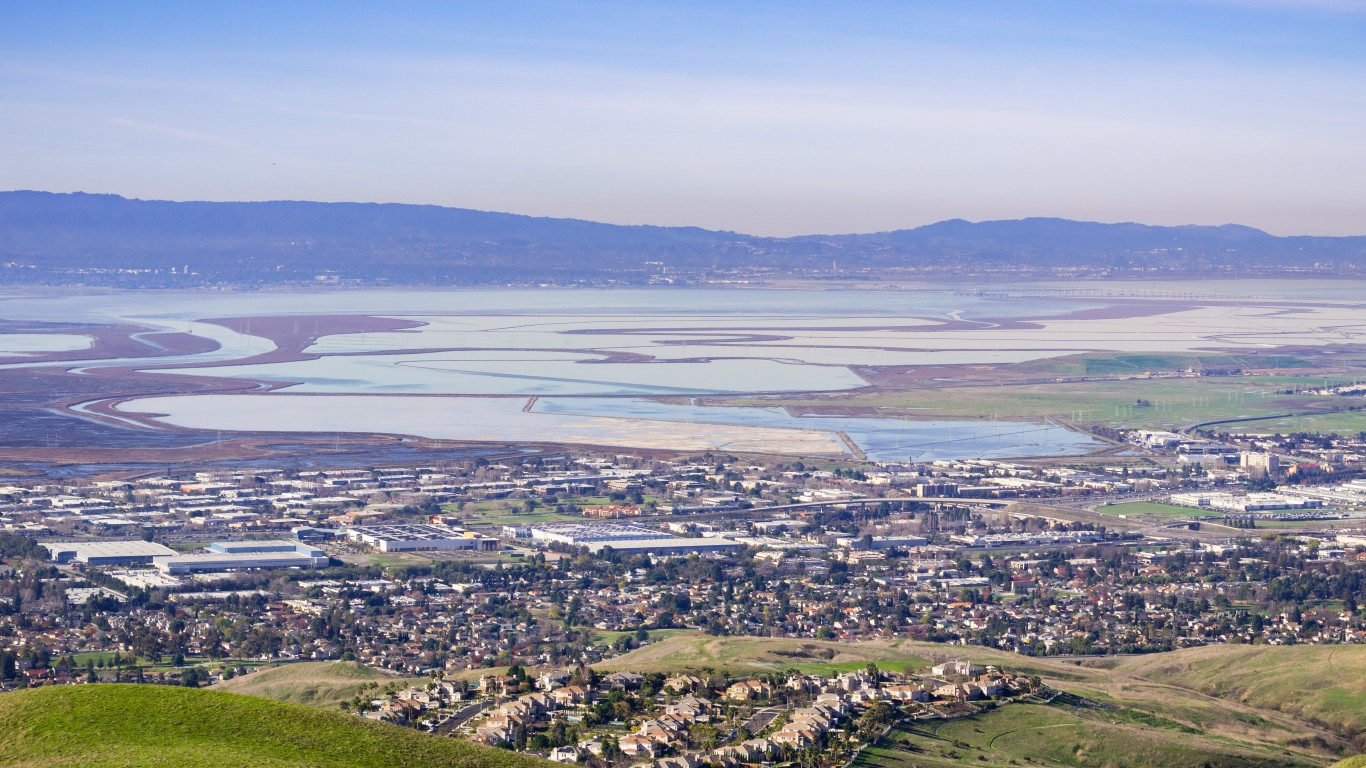
30. Fremont, California
> Median monthly rental cost: $2,453
> Share of income typically spent on rent: 26.4% — 264th lowest of 1,778 cities (tied)
> Rental occupied housing units: 38.6% — 870th lowest of 1,778 cities
> Median home value: $999,500 — 36th highest of 1,778 cities
[in-text-ad]
29. Cerritos, California
> Median monthly rental cost: $2,455
> Share of income typically spent on rent: 28.7% — 609th lowest of 1,778 cities (tied)
> Rental occupied housing units: 23.8% — 279th lowest of 1,778 cities
> Median home value: $716,000 — 110th highest of 1,778 cities
[recirclink id=1102674]
28. San Bruno, California
> Median monthly rental cost: $2,459
> Share of income typically spent on rent: 28.9% — 655th lowest of 1,778 cities (tied)
> Rental occupied housing units: 39.5% — 874th highest of 1,778 cities
> Median home value: $958,300 — 42nd highest of 1,778 cities
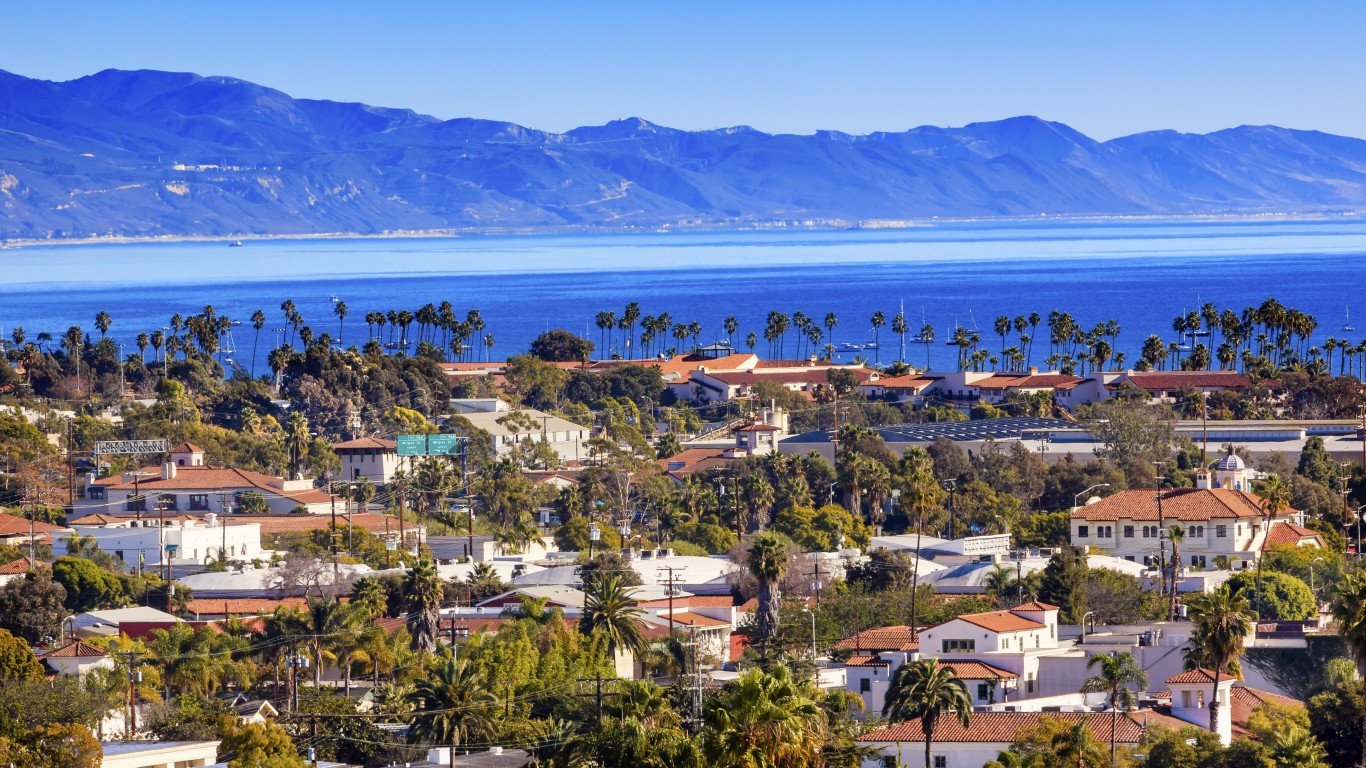
27. Eastern Goleta Valley, California
> Median monthly rental cost: $2,460
> Share of income typically spent on rent: 30.9% — 714th highest of 1,778 cities (tied)
> Rental occupied housing units: 26.4% — 361st lowest of 1,778 cities
> Median home value: $938,400 — 47th highest of 1,778 cities
[in-text-ad-2]
26. Los Gatos, California
> Median monthly rental cost: $2,482
> Share of income typically spent on rent: 25.2% — 149th lowest of 1,778 cities (tied)
> Rental occupied housing units: 34.1% — 649th lowest of 1,778 cities
> Median home value: $1,775,500 — 10th highest of 1,778 cities
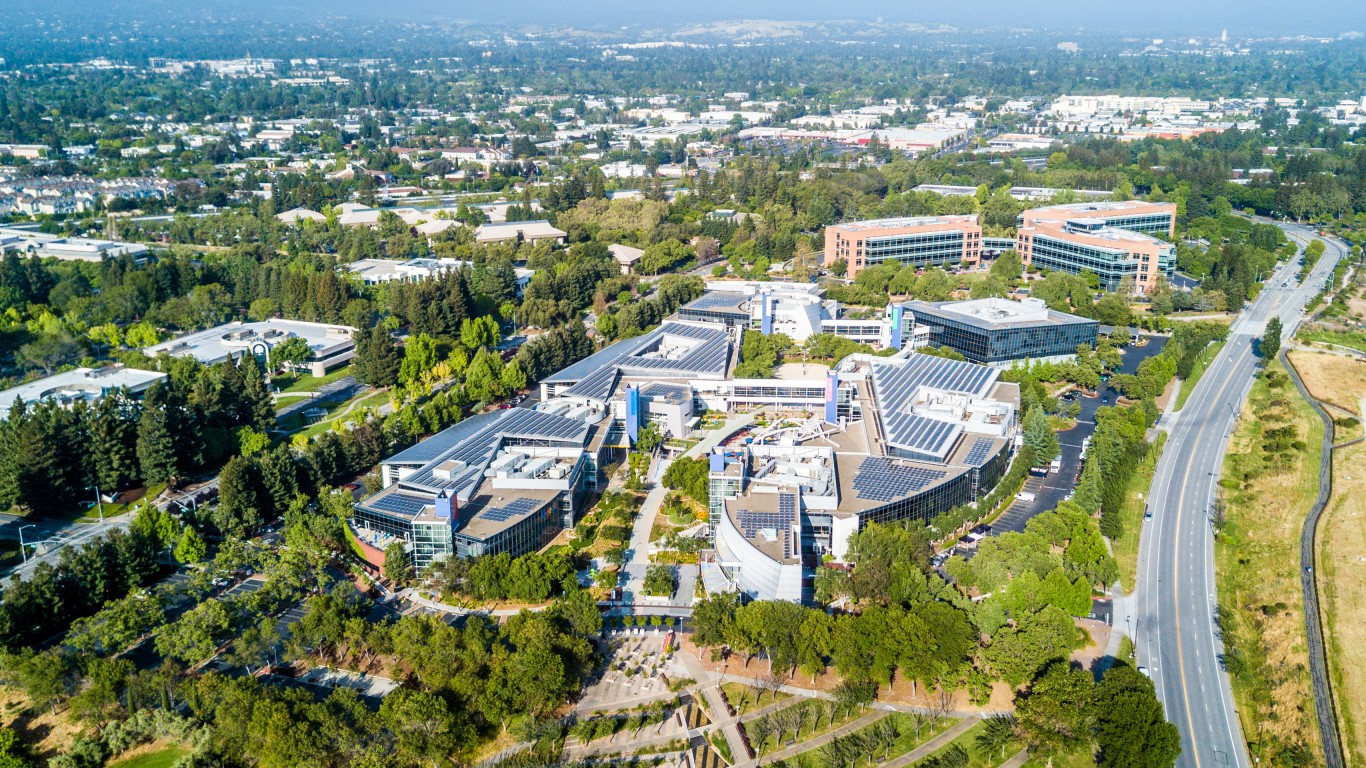
25. Mountain View, California
> Median monthly rental cost: $2,490
> Share of income typically spent on rent: 24.1% — 69th lowest of 1,778 cities (tied)
> Rental occupied housing units: 58.6% — 149th highest of 1,778 cities
> Median home value: $1,560,600 — 13th highest of 1,778 cities
[in-text-ad]
24. Paramus, New Jersey
> Median monthly rental cost: $2,503
> Share of income typically spent on rent: 36.6% — 131st highest of 1,778 cities (tied)
> Rental occupied housing units: 17.4% — 121st lowest of 1,778 cities
> Median home value: $614,900 — 162nd highest of 1,778 cities
[recirclink id=1090849]
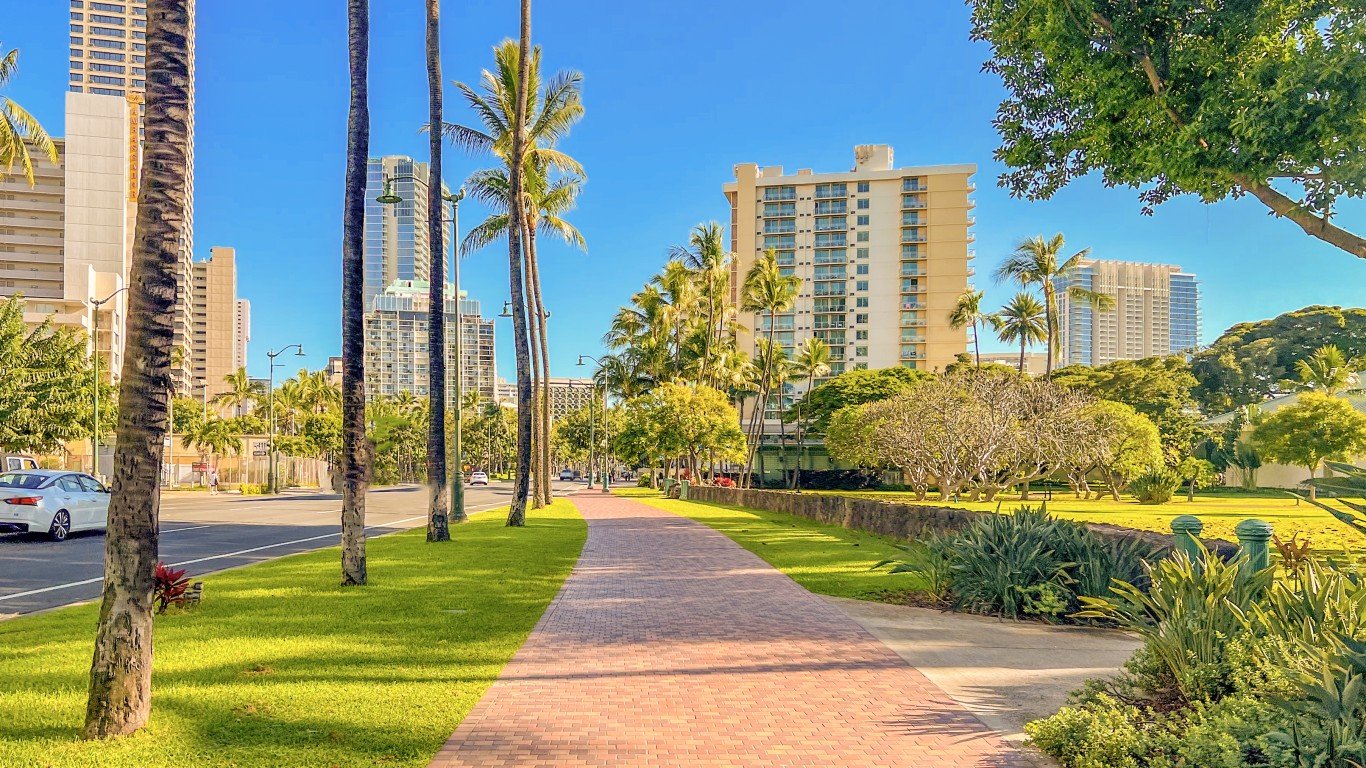
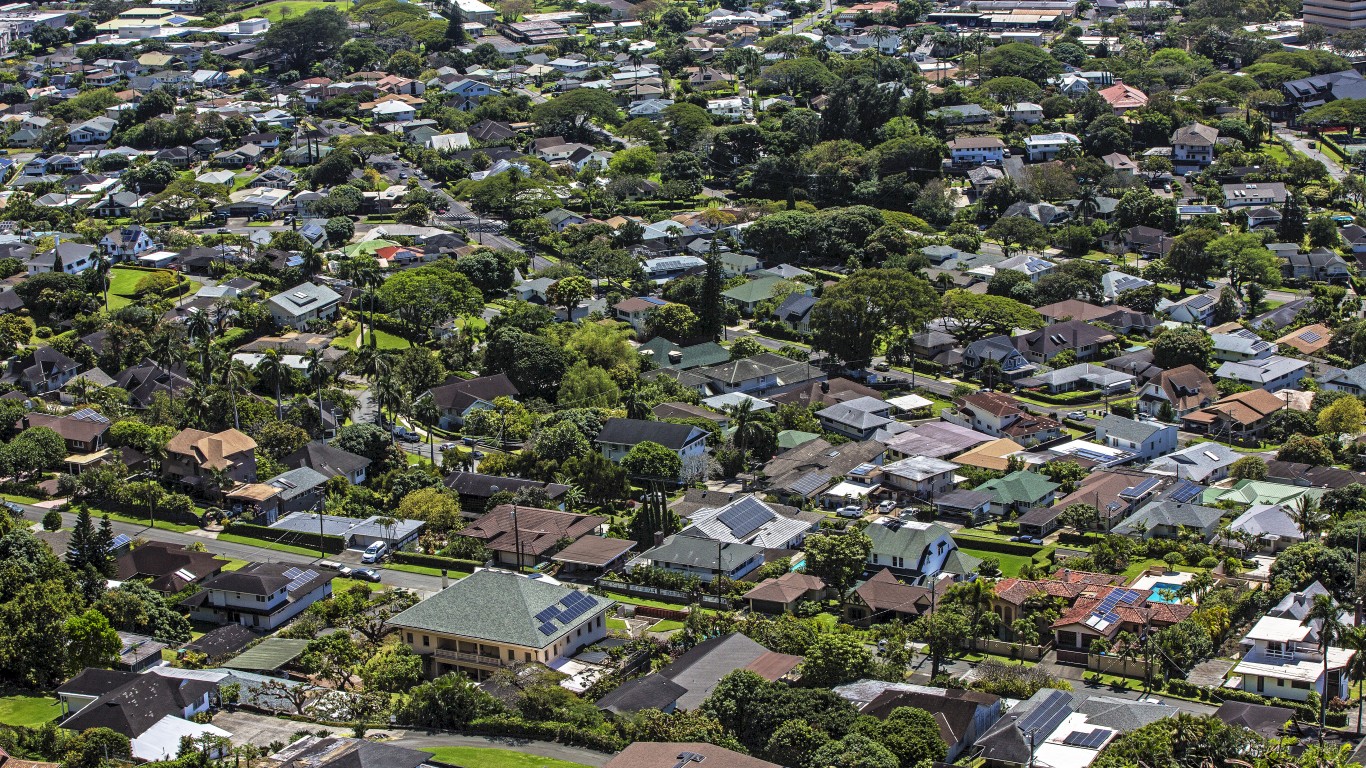
23. Kailua (Honolulu County), Hawaii
> Median monthly rental cost: $2,510
> Share of income typically spent on rent: 29.0% — 680th lowest of 1,778 cities (tied)
> Rental occupied housing units: 25.4% — 318th lowest of 1,778 cities
> Median home value: $992,100 — 37th highest of 1,778 cities (tied)
22. Walnut, California
> Median monthly rental cost: $2,518
> Share of income typically spent on rent: 33.0% — 417th highest of 1,778 cities (tied)
> Rental occupied housing units: 16.7% — 110th lowest of 1,778 cities
> Median home value: $806,900 — 84th highest of 1,778 cities
[in-text-ad-2]

21. Santa Clara, California
> Median monthly rental cost: $2,523
> Share of income typically spent on rent: 26.7% — 294th lowest of 1,778 cities (tied)
> Rental occupied housing units: 56.5% — 191st highest of 1,778 cities
> Median home value: $1,120,400 — 28th highest of 1,778 cities
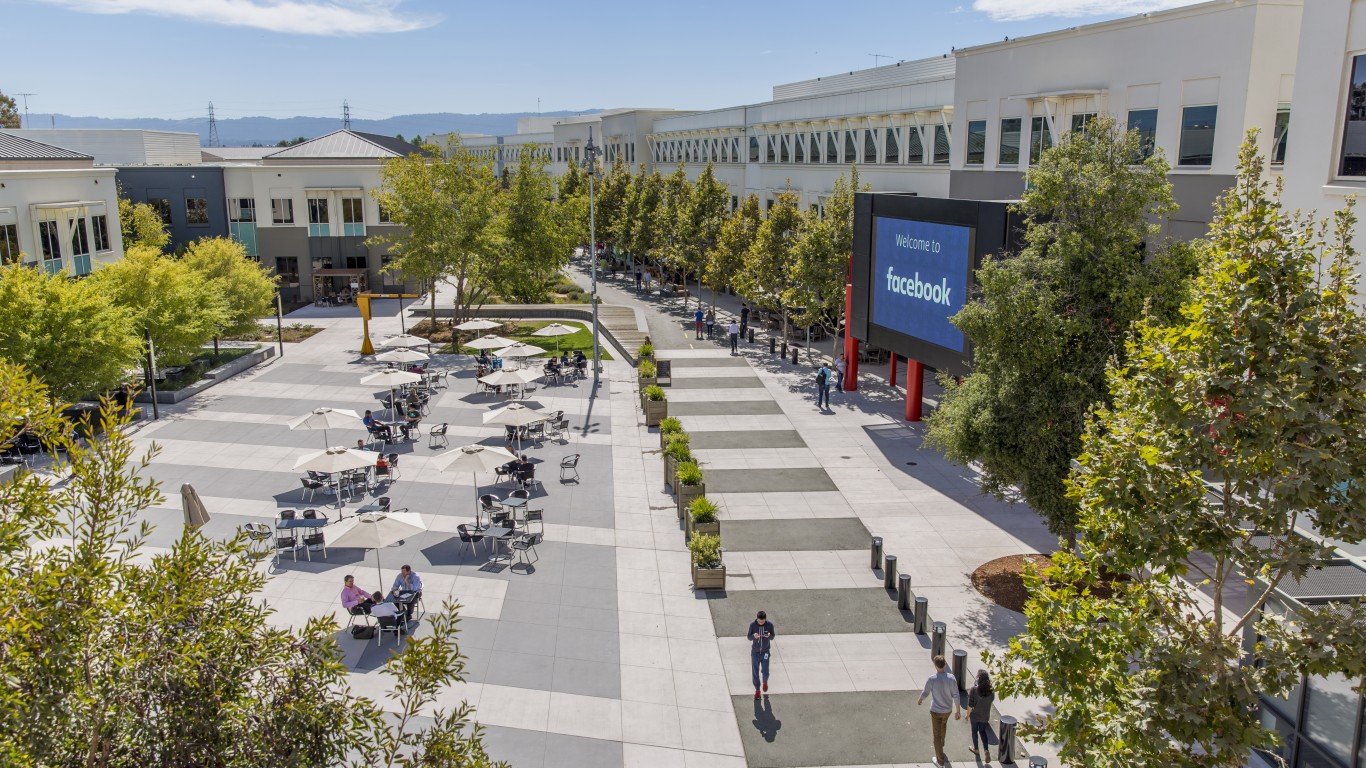
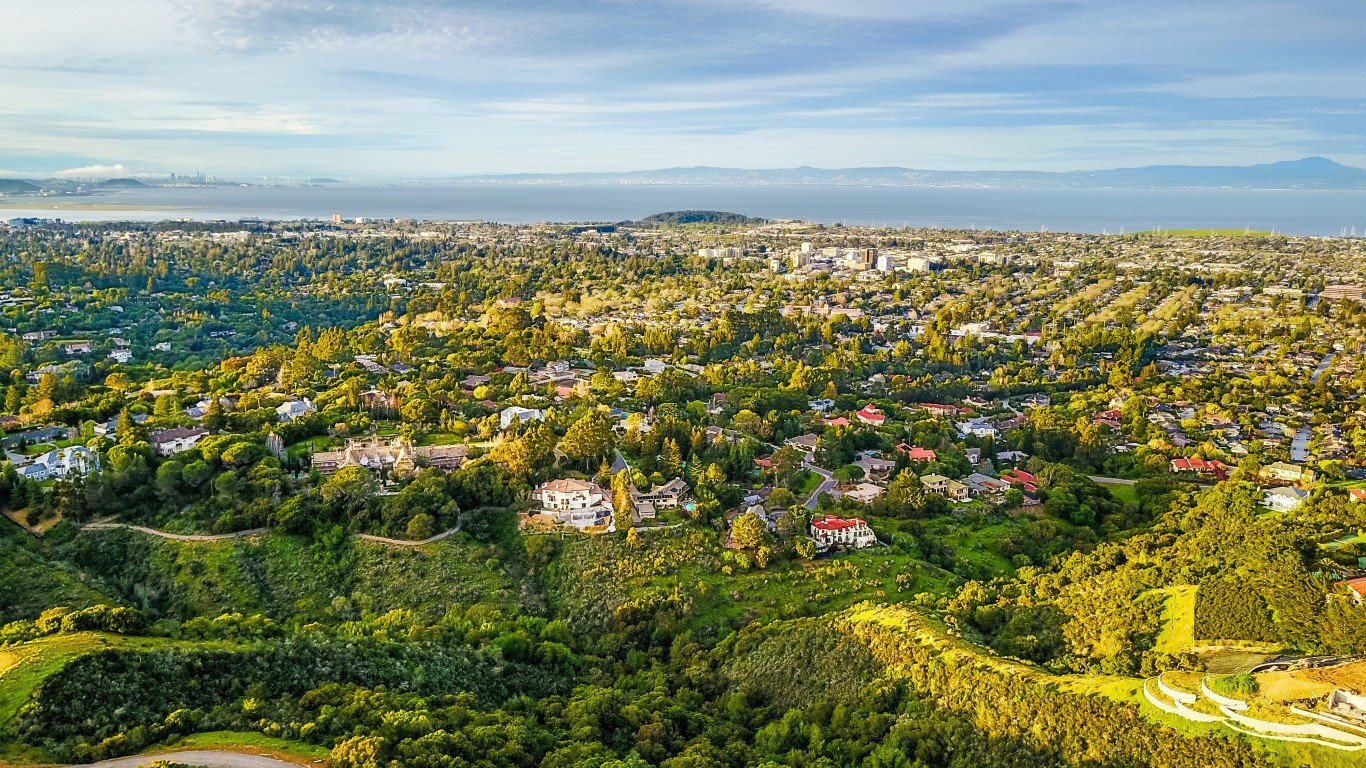
20. Menlo Park, California
> Median monthly rental cost: $2,531
> Share of income typically spent on rent: 27.0% — 326th lowest of 1,778 cities (tied)
> Rental occupied housing units: 41.8% — 759th highest of 1,778 cities
> Median home value: $2,000,000+ — the highest of 1,778 cities (tied)
[in-text-ad]
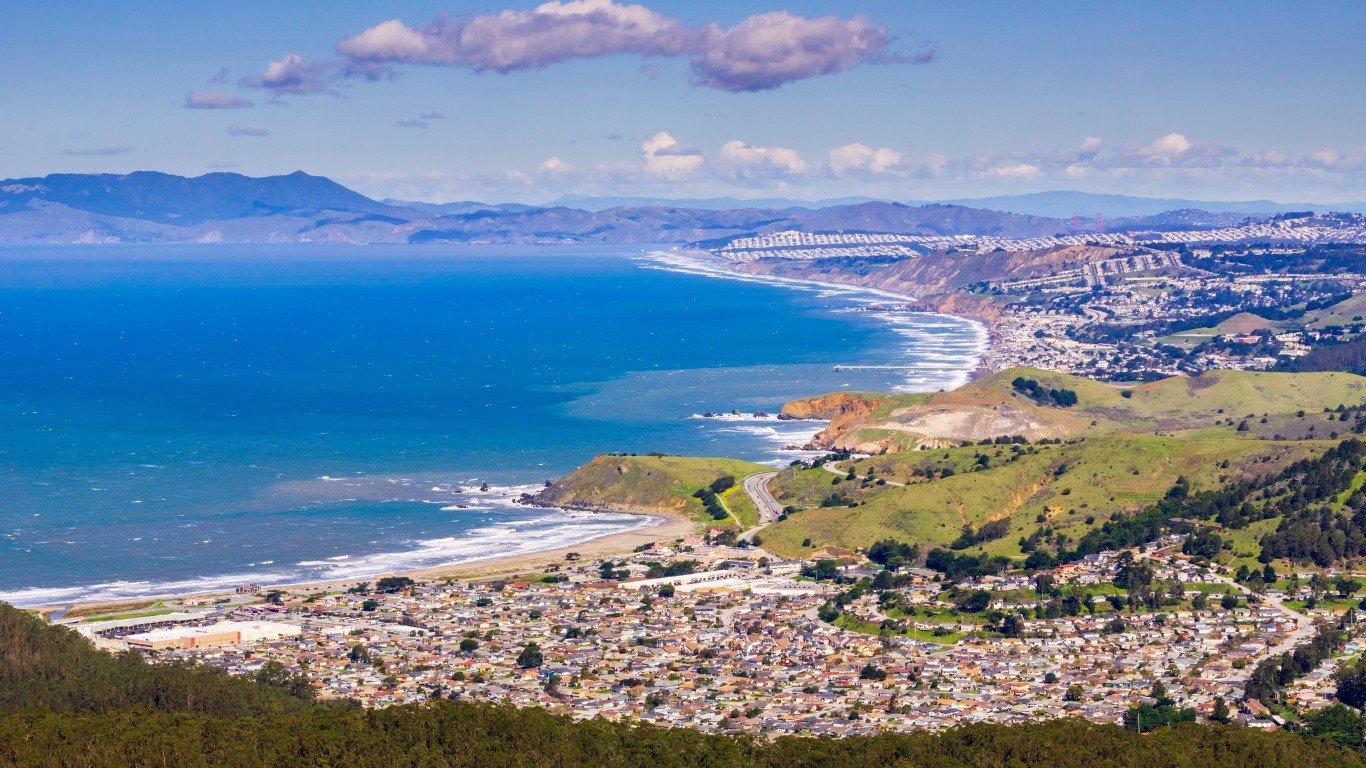
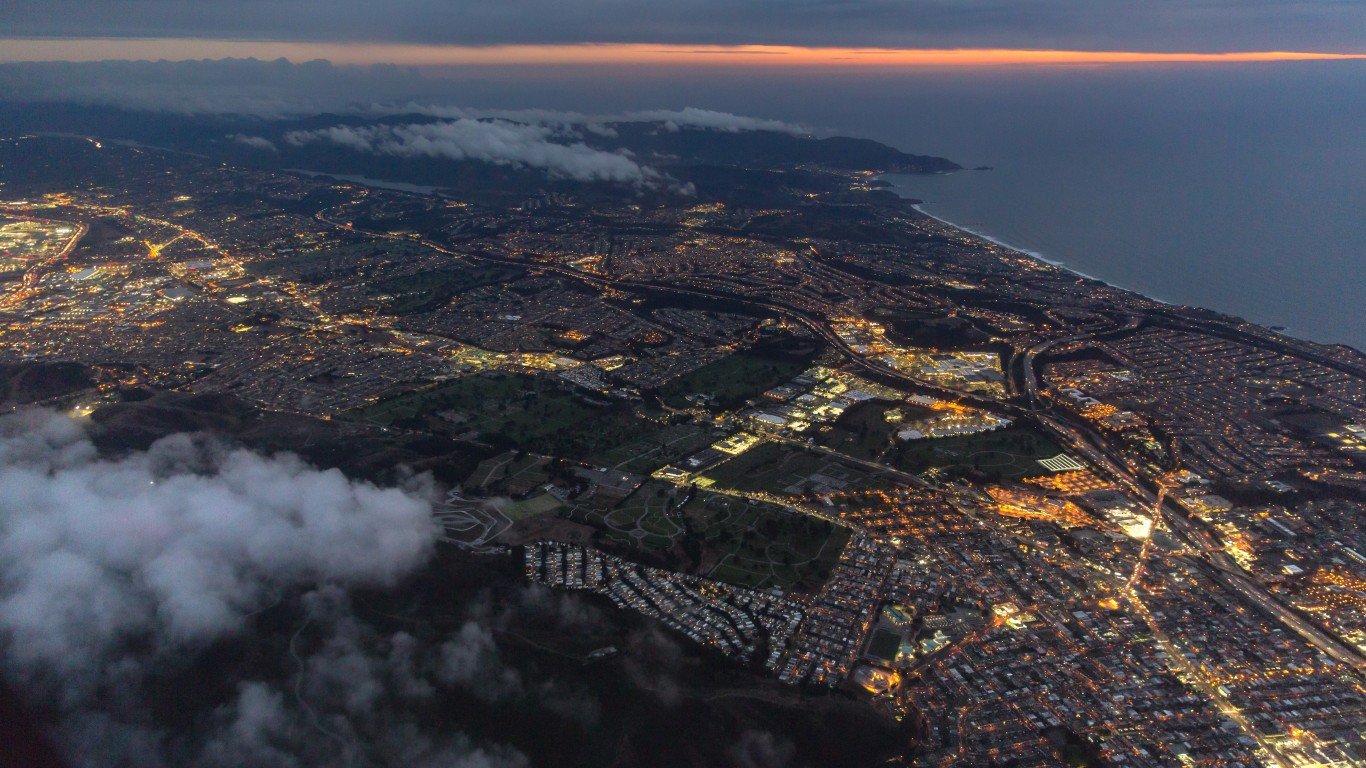
19. Pacifica, California
> Median monthly rental cost: $2,535
> Share of income typically spent on rent: 28.5% — 564th lowest of 1,778 cities (tied)
> Rental occupied housing units: 30.8% — 527th lowest of 1,778 cities
> Median home value: $943,500 — 44th highest of 1,778 cities
[recirclink id=1090988]
18. Belmont, California
> Median monthly rental cost: $2,546
> Share of income typically spent on rent: 27.7% — 428th lowest of 1,778 cities (tied)
> Rental occupied housing units: 42.5% — 726th highest of 1,778 cities
> Median home value: $1,604,700 — 12th highest of 1,778 cities
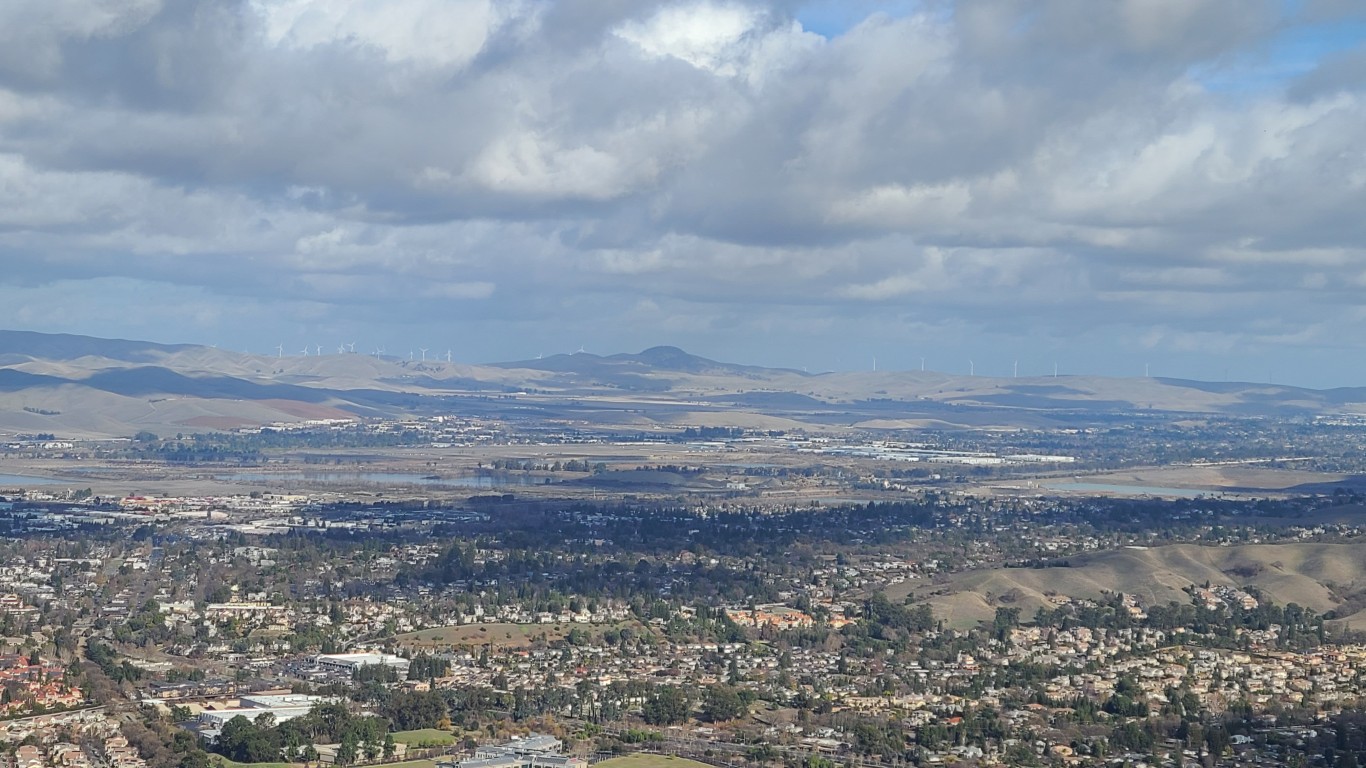
17. Pleasanton, California
> Median monthly rental cost: $2,570
> Share of income typically spent on rent: 29.6% — 795th lowest of 1,778 cities (tied)
> Rental occupied housing units: 32.1% — 574th lowest of 1,778 cities
> Median home value: $1,056,100 — 33rd highest of 1,778 cities
[in-text-ad-2]

16. Manhattan Beach, California
> Median monthly rental cost: $2,582
> Share of income typically spent on rent: 23.5% — 44th lowest of 1,778 cities (tied)
> Rental occupied housing units: 32.3% — 581st lowest of 1,778 cities
> Median home value: $2,000,000+ — the highest of 1,778 cities (tied)
15. Eastvale, California
> Median monthly rental cost: $2,584
> Share of income typically spent on rent: 28.0% — 485th lowest of 1,778 cities (tied)
> Rental occupied housing units: 21.2% — 211th lowest of 1,778 cities
> Median home value: $596,200 — 175th highest of 1,778 cities
[in-text-ad]
14. Hercules, California
> Median monthly rental cost: $2,592
> Share of income typically spent on rent: 27.8% — 452nd lowest of 1,778 cities (tied)
> Rental occupied housing units: 19.4% — 163rd lowest of 1,778 cities
> Median home value: $564,600 — 200th highest of 1,778 cities
[recirclink id=1094298]
13. Milpitas, California
> Median monthly rental cost: $2,626
> Share of income typically spent on rent: 26.6% — 283rd lowest of 1,778 cities (tied)
> Rental occupied housing units: 36.3% — 754th lowest of 1,778 cities
> Median home value: $927,200 — 52nd highest of 1,778 cities
12. San Mateo, California
> Median monthly rental cost: $2,658
> Share of income typically spent on rent: 30.0% — 866th highest of 1,778 cities (tied)
> Rental occupied housing units: 47.3% — 493rd highest of 1,778 cities
> Median home value: $1,186,400 — 23rd highest of 1,778 cities
[in-text-ad-2]

11. Parkland, Florida
> Median monthly rental cost: $2,670
> Share of income typically spent on rent: 43.0% — 22nd highest of 1,778 cities (tied)
> Rental occupied housing units: 16.7% — 109th lowest of 1,778 cities
> Median home value: $631,000 — 149th highest of 1,778 cities

10. Palo Alto, California
> Median monthly rental cost: $2,679
> Share of income typically spent on rent: 25.6% — 184th lowest of 1,778 cities (tied)
> Rental occupied housing units: 43.7% — 663rd highest of 1,778 cities
> Median home value: $2,000,000+ — the highest of 1,778 cities (tied)
[in-text-ad]
9. East Honolulu, Hawaii
> Median monthly rental cost: $2,690
> Share of income typically spent on rent: 28.4% — 550th lowest of 1,778 cities (tied)
> Rental occupied housing units: 15.7% — 94th lowest of 1,778 cities
> Median home value: $968,200 — 41st highest of 1,778 cities
[recirclink id=1101677]
8. Sunnyvale, California
> Median monthly rental cost: $2,699
> Share of income typically spent on rent: 24.1% — 69th lowest of 1,778 cities (tied)
> Rental occupied housing units: 55.1% — 232nd highest of 1,778 cities
> Median home value: $1,397,200 — 18th highest of 1,778 cities

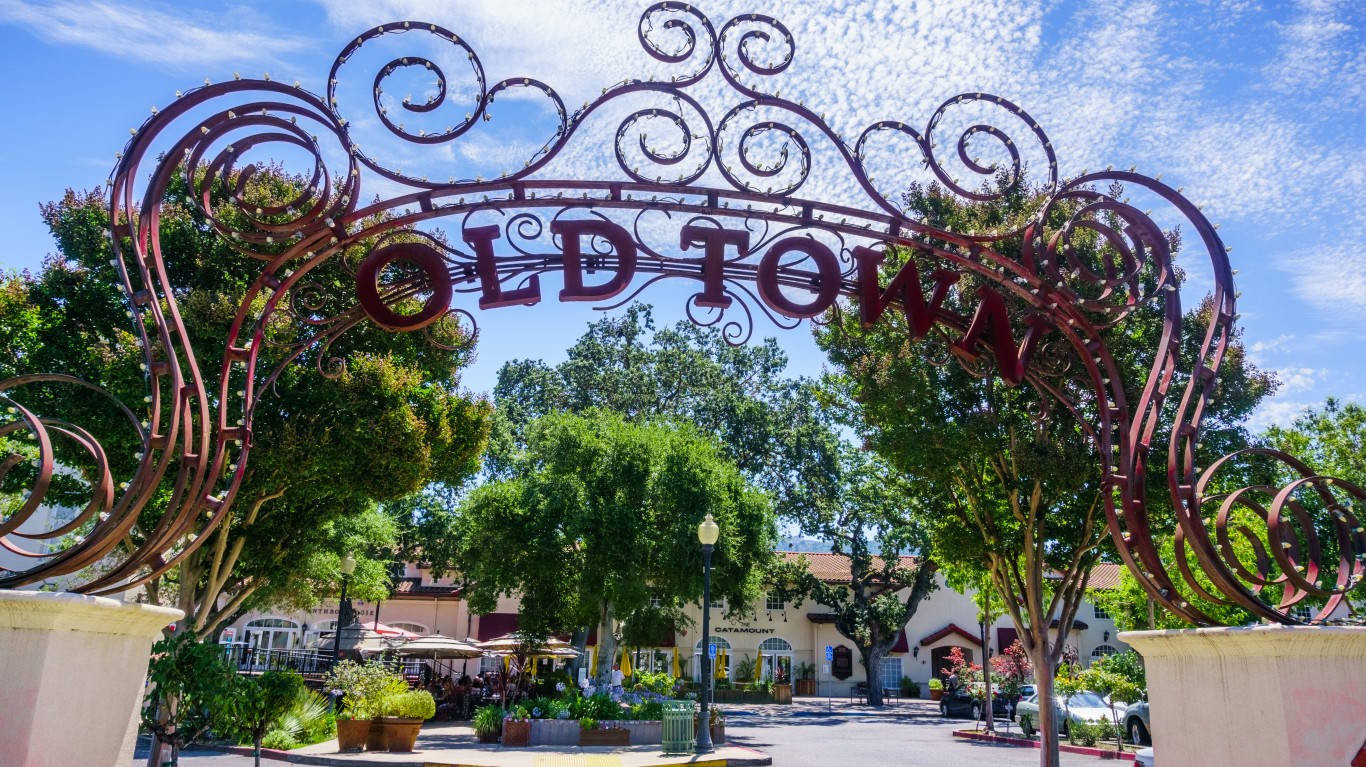
7. Dublin, California
> Median monthly rental cost: $2,775
> Share of income typically spent on rent: 27.0% — 326th lowest of 1,778 cities (tied)
> Rental occupied housing units: 36.3% — 757th lowest of 1,778 cities
> Median home value: $934,500 — 48th highest of 1,778 cities
[in-text-ad-2]
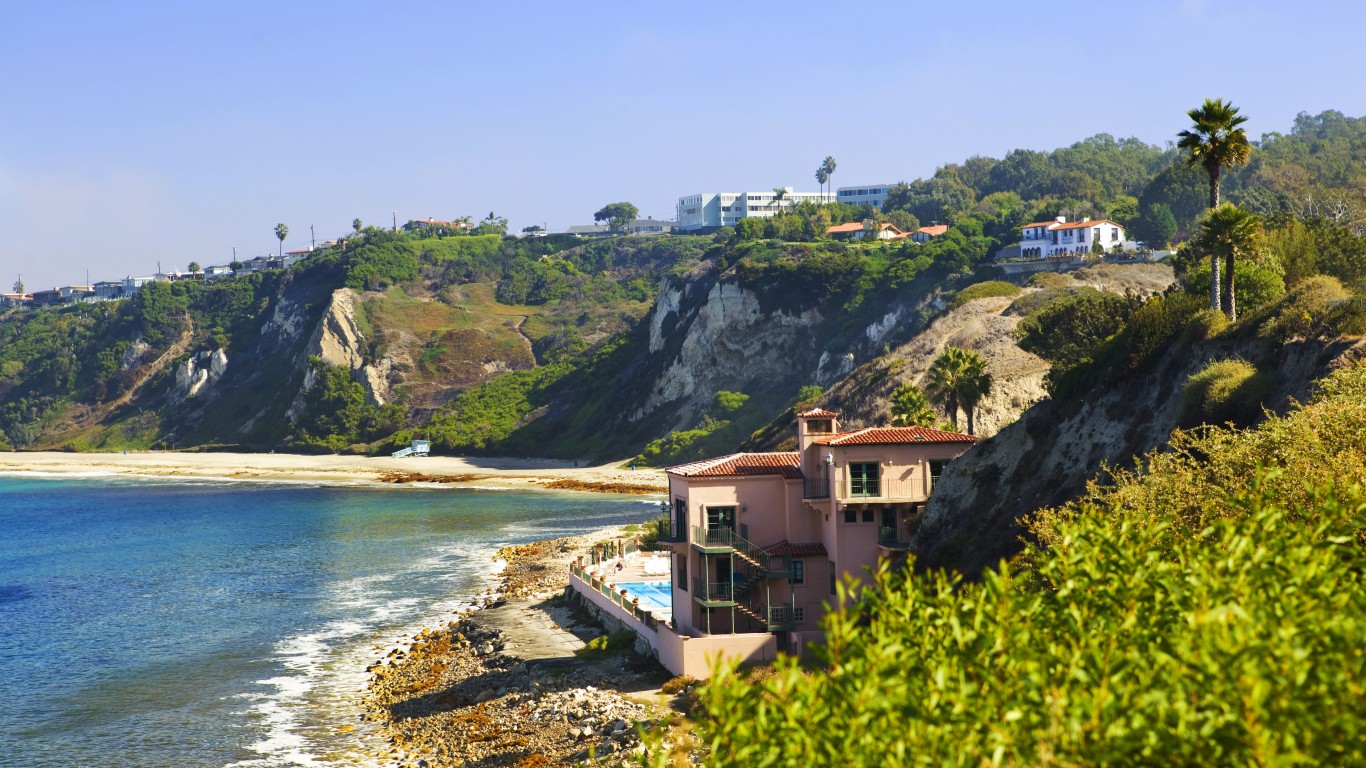
6. Rancho Palos Verdes, California
> Median monthly rental cost: $2,839
> Share of income typically spent on rent: 33.7% — 325th highest of 1,778 cities (tied)
> Rental occupied housing units: 22.4% — 243rd lowest of 1,778 cities
> Median home value: $1,209,200 — 22nd highest of 1,778 cities

5. McLean, Virginia
> Median monthly rental cost: $3,176
> Share of income typically spent on rent: 29.7% — 822nd lowest of 1,778 cities (tied)
> Rental occupied housing units: 12.6% — 43rd lowest of 1,778 cities
> Median home value: $1,061,500 — 31st highest of 1,778 cities
[in-text-ad]

4. Cupertino, California
> Median monthly rental cost: $3,299
> Share of income typically spent on rent: 23.4% — 38th lowest of 1,778 cities (tied)
> Rental occupied housing units: 39.2% — 887th highest of 1,778 cities
> Median home value: $1,866,200 — 9th highest of 1,778 cities
[recirclink id=1102674]
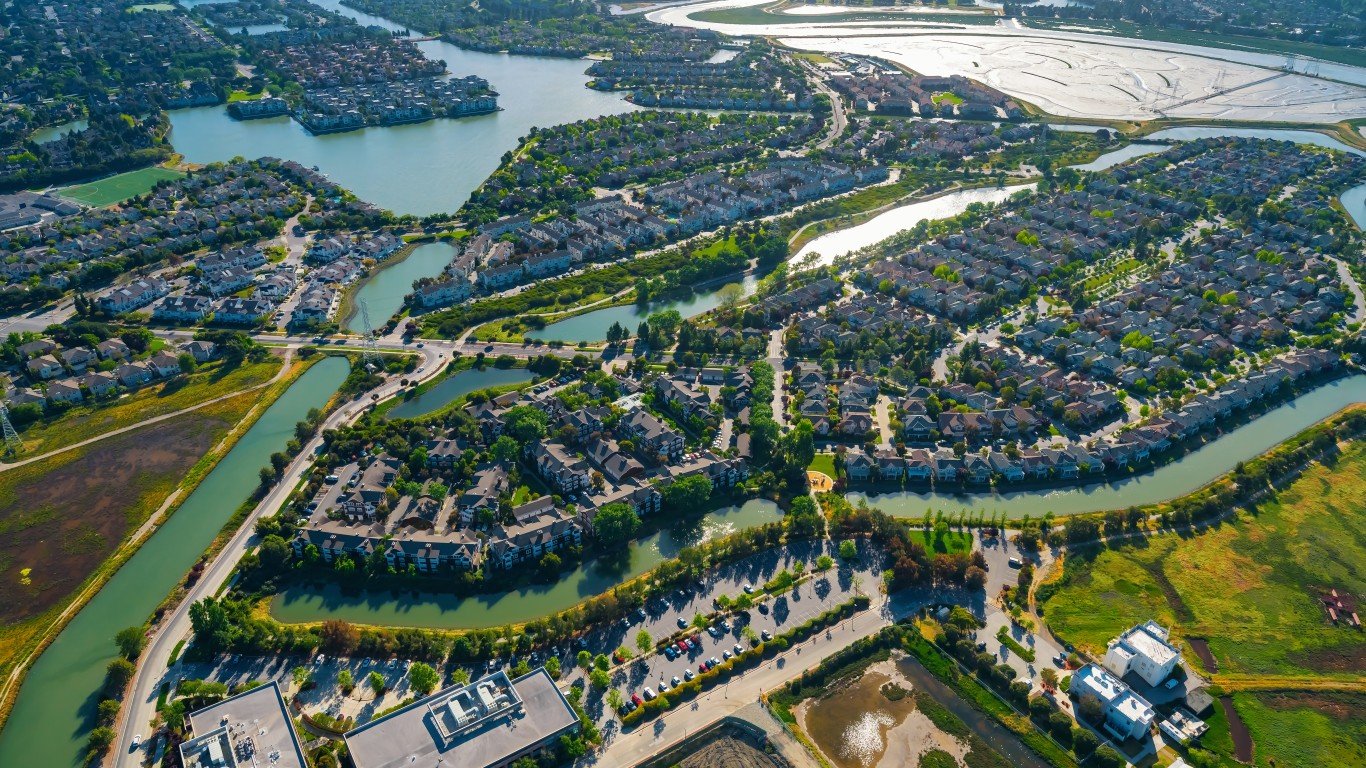
3. Foster City, California
> Median monthly rental cost: $3,303
> Share of income typically spent on rent: 25.2% — 149th lowest of 1,778 cities (tied)
> Rental occupied housing units: 46.7% — 526th highest of 1,778 cities
> Median home value: $1,399,600 — 17th highest of 1,778 cities

2. Saratoga, California
> Median monthly rental cost: $3,339
> Share of income typically spent on rent: 20.7% — 5th lowest of 1,778 cities
> Rental occupied housing units: 13.9% — 59th lowest of 1,778 cities
> Median home value: $2,000,000+ — the highest of 1,778 cities (tied)
[in-text-ad-2]
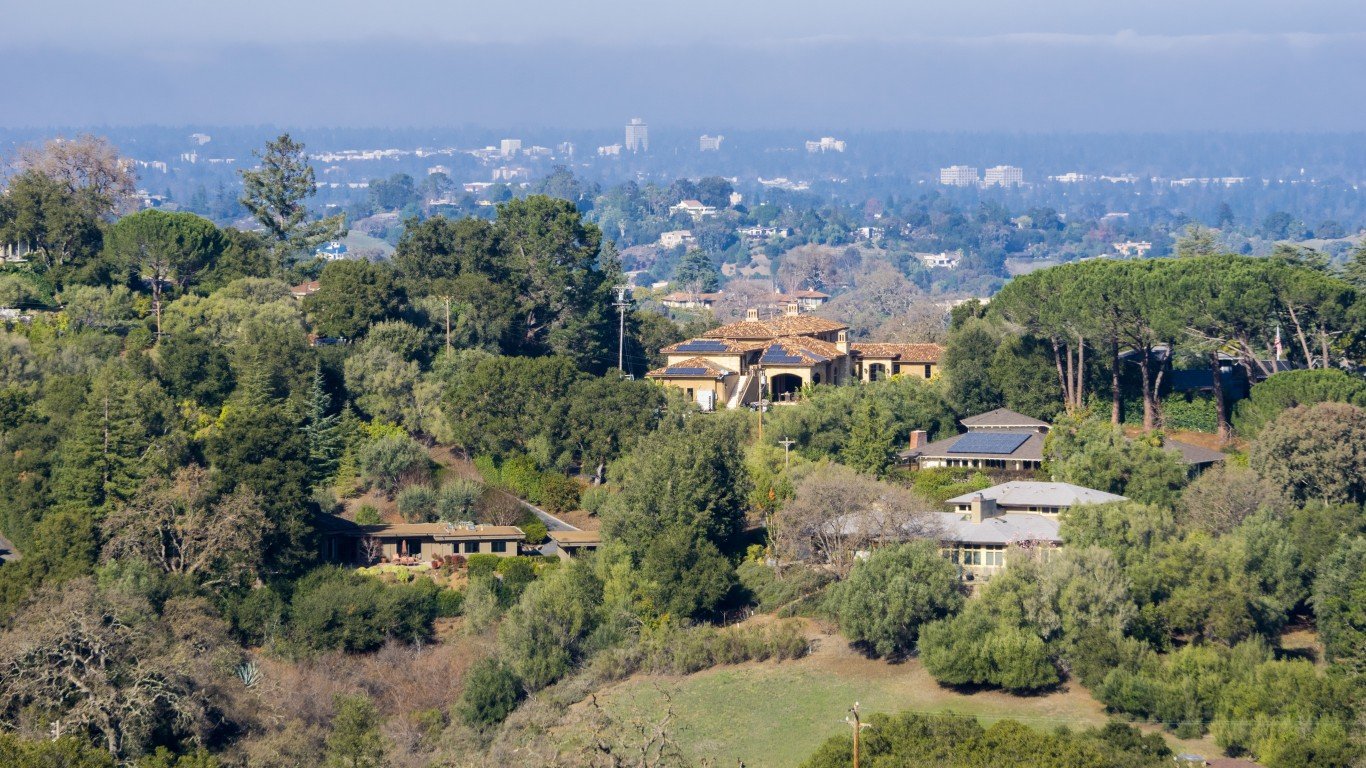
1. Los Altos, California
> Median monthly rental cost: $3,375
> Share of income typically spent on rent: 19.2% — 2nd lowest of 1,778 cities
> Rental occupied housing units: 20.2% — 182nd lowest of 1,778 cities
> Median home value: $2,000,000+ — the highest of 1,778 cities (tied)
Methodology
To determine the cities with the highest rent, 24/7 Wall St. reviewed five-year estimates of median gross rent from the U.S. Census Bureau’s 2020 American Community Survey.
We used census “place” geographies — a category that includes incorporated legal entities and census-designated statistical entities. We defined cities based on a population threshold — census places needed to have a population of at least 25,000 to be considered.
Cities were excluded if median gross rent was not available in the 2020 ACS, if there were fewer than 500 renter-occupied housing units, or if the sampling error associated with a city’s data was deemed too high.
The sampling error was defined as too high if the coefficient of variation — a statistical assessment of how reliable an estimate is — for a city’s median gross rent was above 15% and greater than two standard deviations above the mean CV for all cities’ median gross rents. We similarly excluded cities that had a sampling error too high for their population, using the same definition.
Cities were ranked based on the median gross rent. To break ties, we used the median gross rent as a share of household income.
Additional information on median gross rent as a share of household income, share of households occupied by renters, and median home value are also five-year estimates from the 2020 ACS.
Contact [email protected] for any questions or corrections.