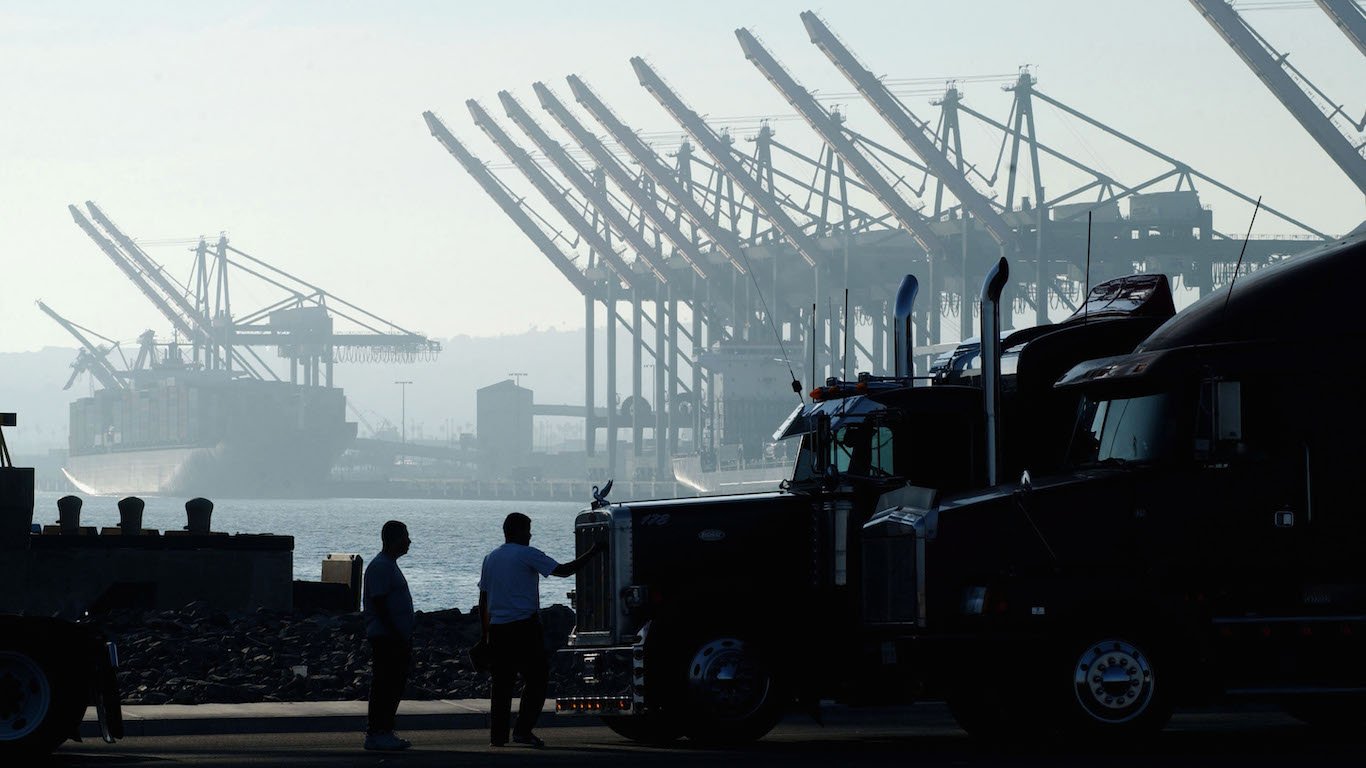
Armed with rapidly developed vaccines and with 66% of the population considered fully vaccinated against COVID-19, the U.S. economy has bounced back from the highest jobless rate since the Great Depression. The coronavirus had nearly wiped out all of the job gains since the Great Recession, when the pandemic began ravaging the U.S. and 22 million jobs were lost. The American economy has since recovered 20.8 million jobs as of April 2022.
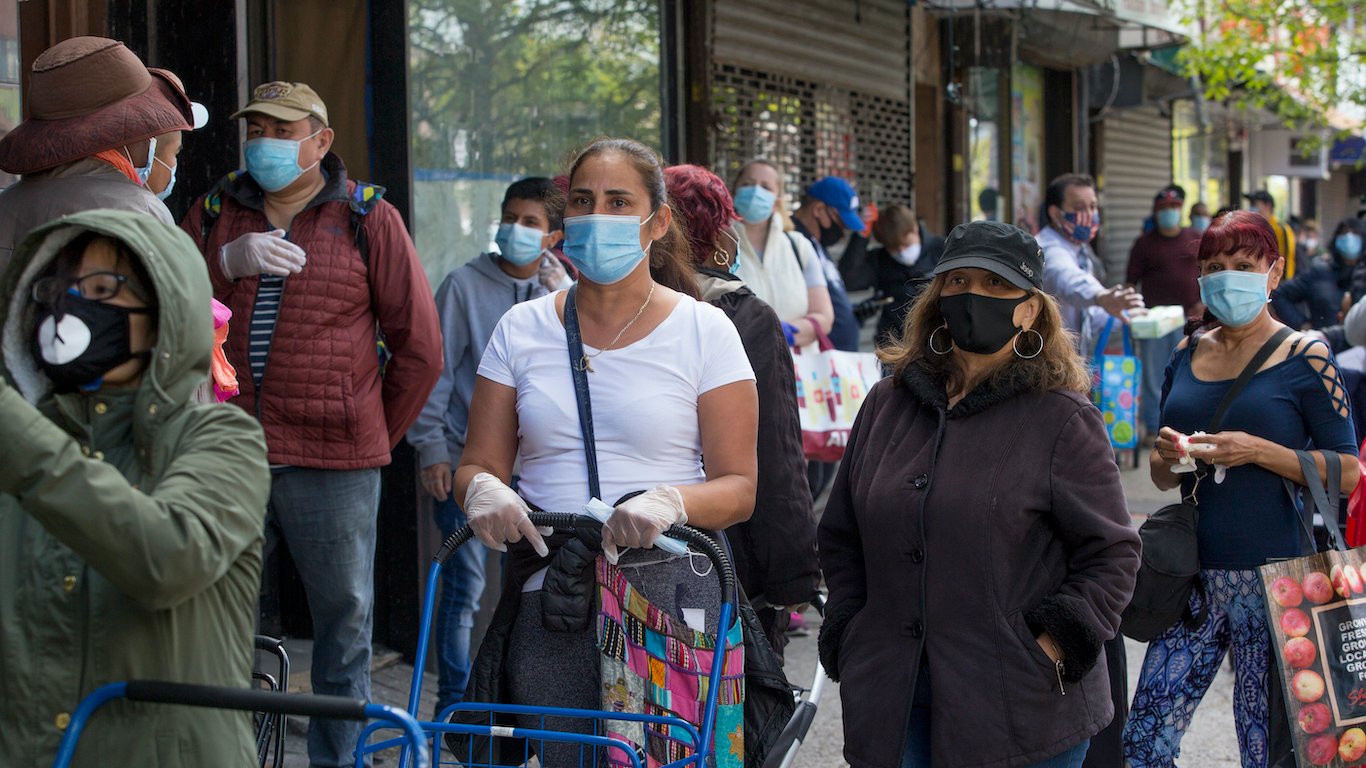
Some of the recent data indicates the job market favors workers. The jobless rate is 3.6%, close to the pre-pandemic low of 3.5%. Job openings stood at 11.5 million, the highest level since the government began keeping track in December 2000. Still, some states have had more difficulty recovering from the nadir of the pandemic, with unemployment claims significantly higher than what they were before the pandemic. (These are states with the most job openings.)
To determine the states with the biggest increases in unemployment claims since before the pandemic, 24/7 Wall St. reviewed data on weekly initial unemployment claims from the U.S. Department of Labor. States were ranked based on the percentage change in initial unemployment claims in March 20 through May 14, 2022 compared to the eight-week period of March 24 through May 11, 2019.
Despite the strong labor market, there are warning signs that the economy might be slowing. The Commerce Department revised its estimate downward on May 26, saying the economy contracted at a 1.5% annual pace in the first quarter, down from an initial estimate of a 1.4% drop. The Federal Reserve has lifted its benchmark interest rate by 75 basis points since March to try and bring down inflation, which was running at 8.3% as of April. There are concerns that the central bank’s tightening monetary policy could send the economy into a recession next year.
In fifteen states, initial unemployment claims have risen since before the pandemic, from March-May 2019 to March-May 2022. Claims increased 114% in Indiana and 90% in Ohio. In five of the 15 states where unemployment claims are now higher than before the pandemic, the unemployment rate is among the five highest. In three of them, however, the unemployment rate is among the five lowest of all states.
In the other 35 states, initial unemployment claims have declined when compared to the period before the pandemic, with claims dropping nearly 36% in Iowa and New Hampshire. New Hampshire also has the lowest poverty rate and the seventh lowest unemployment rate. (This is the industry laying off the most Americans.)
Click here to see the state with the worst spike in unemployment since the pandemic
Click here to read our detailed methodology
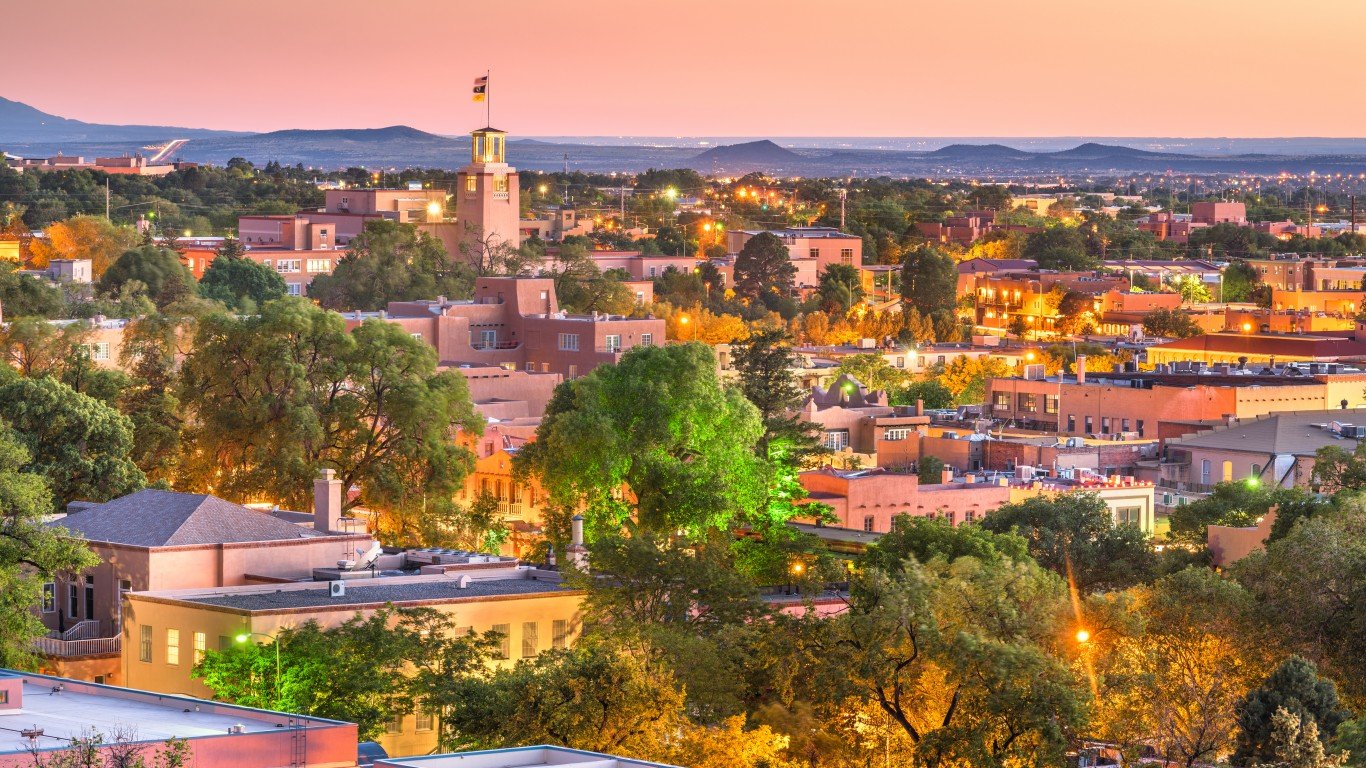
15. New Mexico
> Three-year change in unemployment claims: +0.5%
> Unemployment claims, March 24 through May 11, 2019: 6,067
> Unemployment claims, March 20 through May 14, 2022: 6,099
> Unemployment rate, April 2022: 5.3% (the highest)
> Poverty rate, 2020: 18.6% (2nd highest)
[in-text-ad]
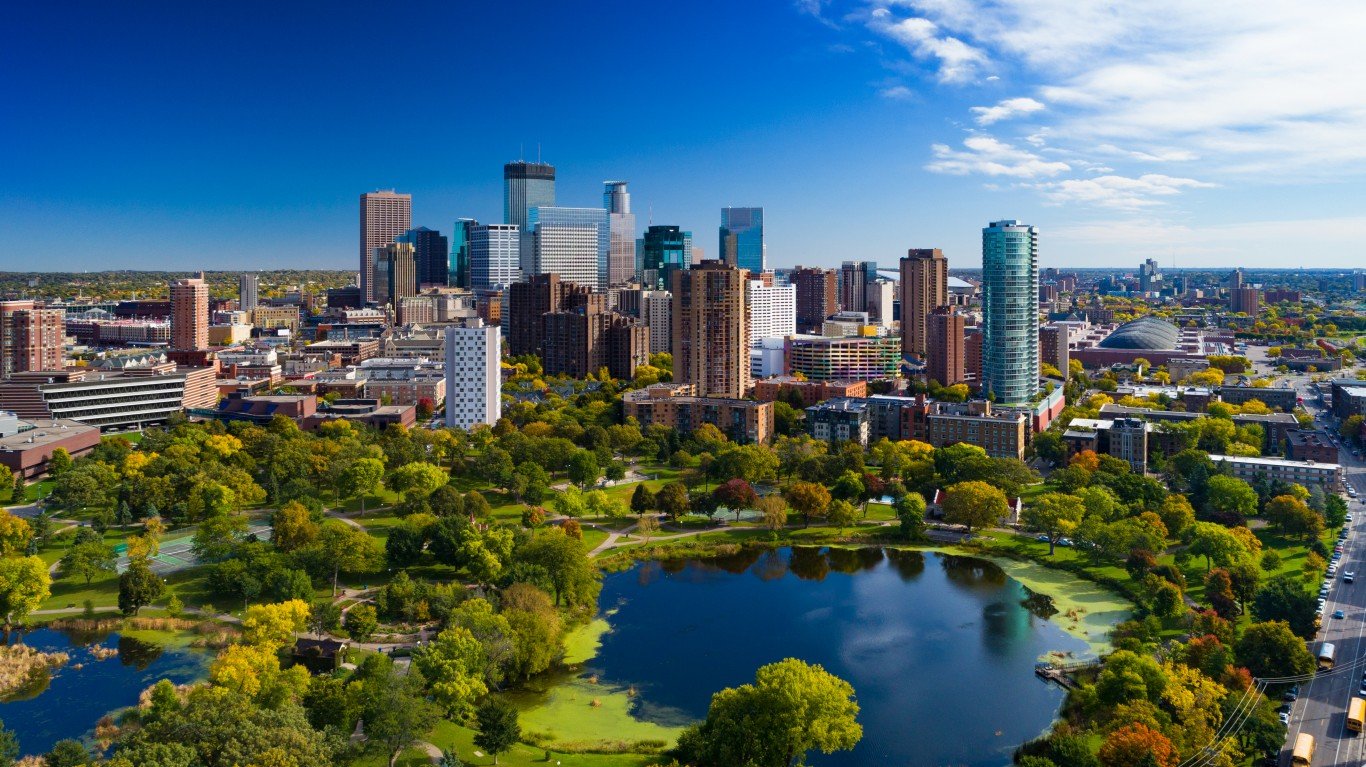
14. Minnesota
> Three-year change in unemployment claims: +1.9%
> Unemployment claims, March 24 through May 11, 2019: 23,343
> Unemployment claims, March 20 through May 14, 2022: 23,798
> Unemployment rate, April 2022: 2.2% (4th lowest)
> Poverty rate, 2020: 9.3% (5th lowest)
[recirclink id=1121400]

13. Hawaii
> Three-year change in unemployment claims: +6.4%
> Unemployment claims, March 24 through May 11, 2019: 9,329
> Unemployment claims, March 20 through May 14, 2022: 9,924
> Unemployment rate, April 2022: 4.2% (12th highest)
> Poverty rate, 2020: 9.3% (5th lowest)
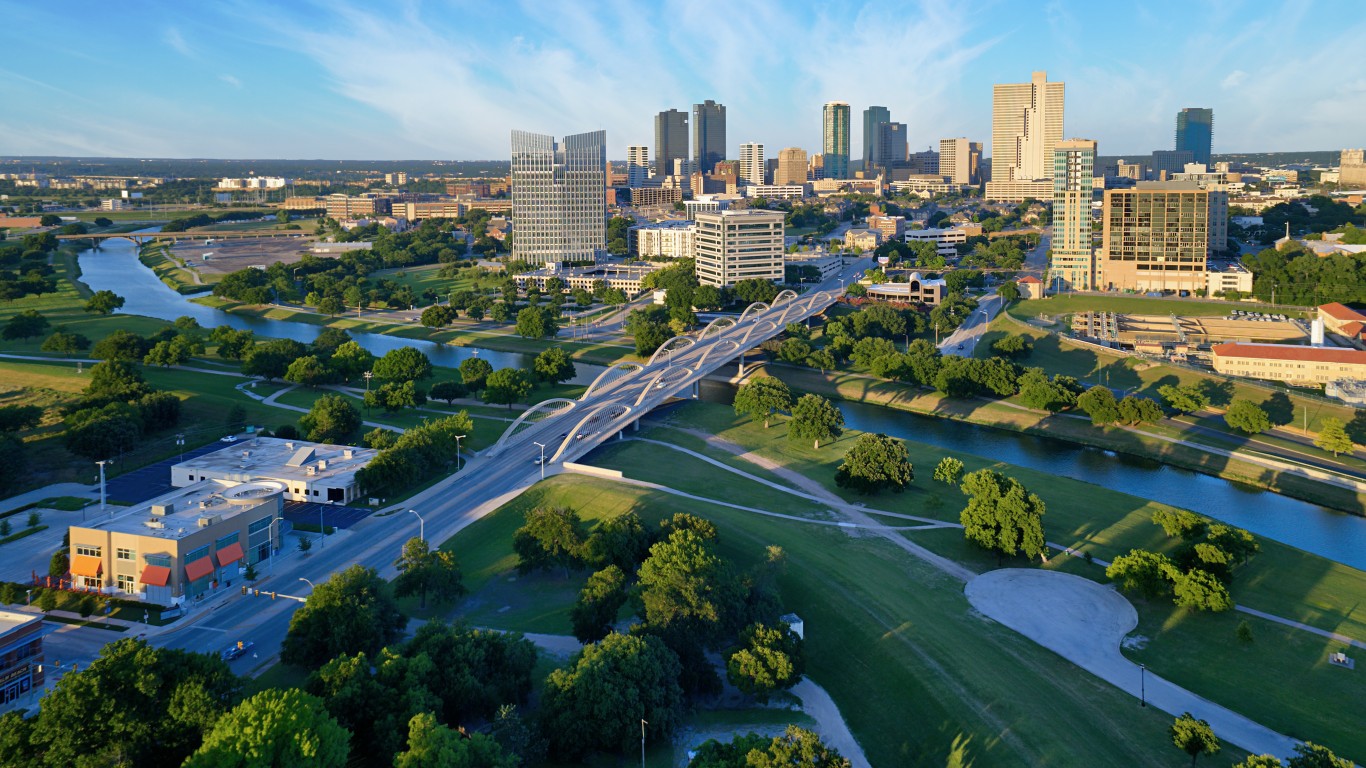
12. Texas
> Three-year change in unemployment claims: +7.4%
> Unemployment claims, March 24 through May 11, 2019: 102,900
> Unemployment claims, March 20 through May 14, 2022: 110,479
> Unemployment rate, April 2022: 4.3% (10th highest)
> Poverty rate, 2020: 14.2% (12th highest)
[in-text-ad-2]
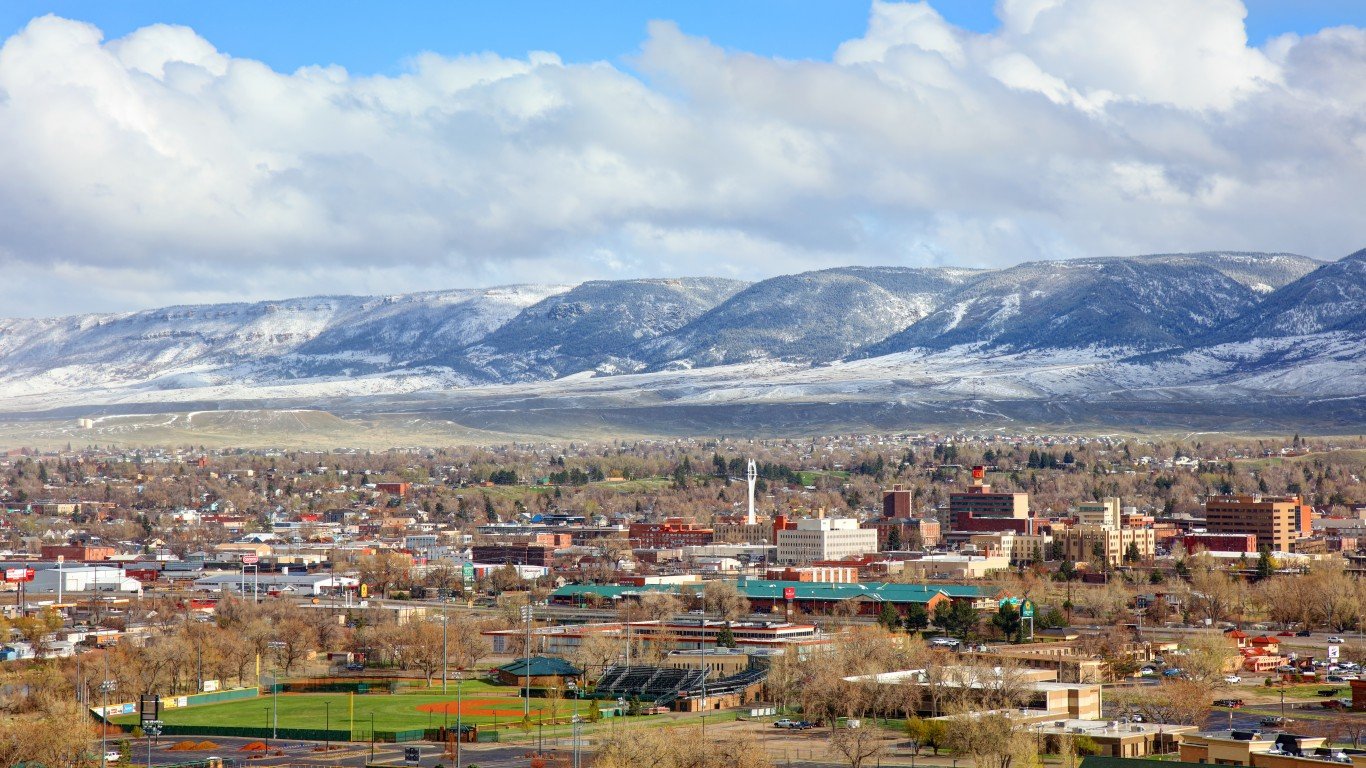
11. Wyoming
> Three-year change in unemployment claims: +8.7%
> Unemployment claims, March 24 through May 11, 2019: 2,724
> Unemployment claims, March 20 through May 14, 2022: 2,962
> Unemployment rate, April 2022: 3.3% (25th lowest)
> Poverty rate, 2020: 10.8% (16th lowest)
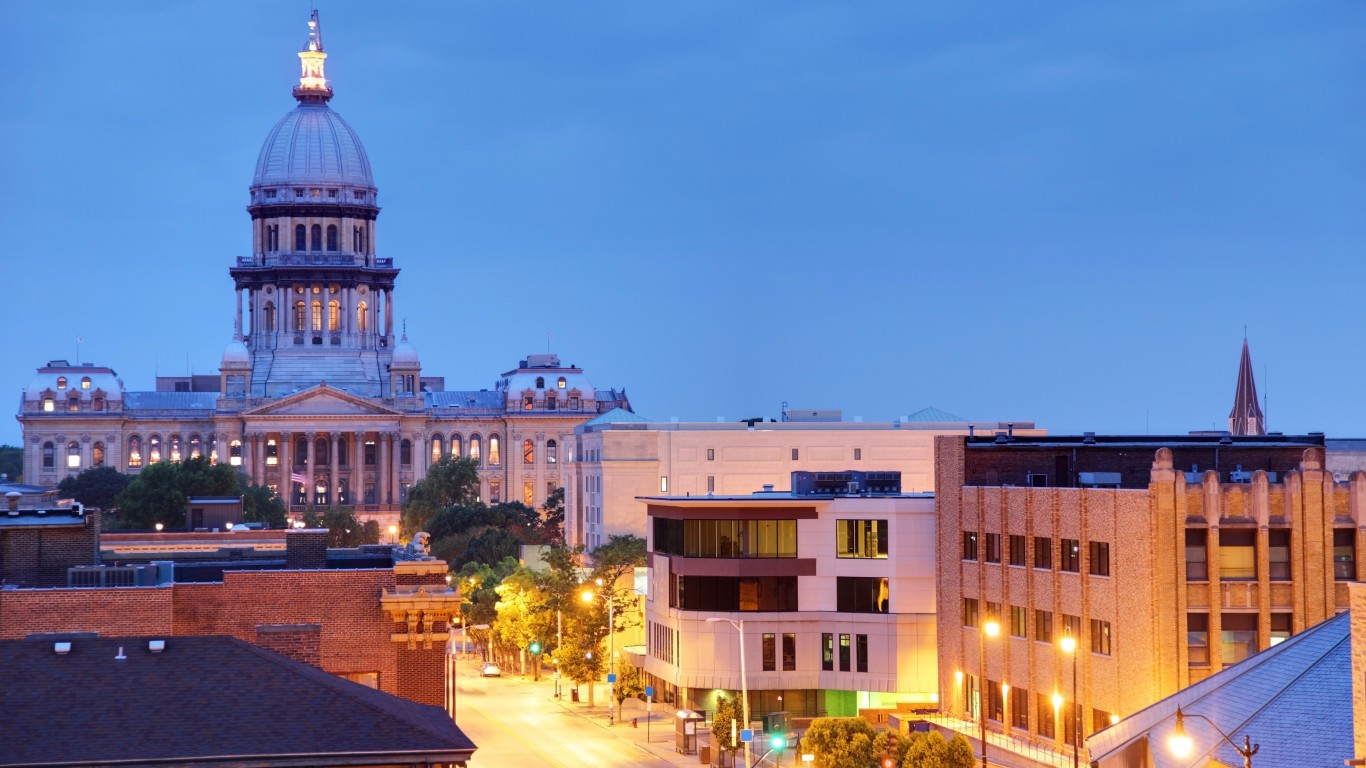
10. Illinois
> Three-year change in unemployment claims: +9.5%
> Unemployment claims, March 24 through May 11, 2019: 67,374
> Unemployment claims, March 20 through May 14, 2022: 73,784
> Unemployment rate, April 2022: 4.6% (5th highest)
> Poverty rate, 2020: 12.0% (25th lowest)
[in-text-ad]
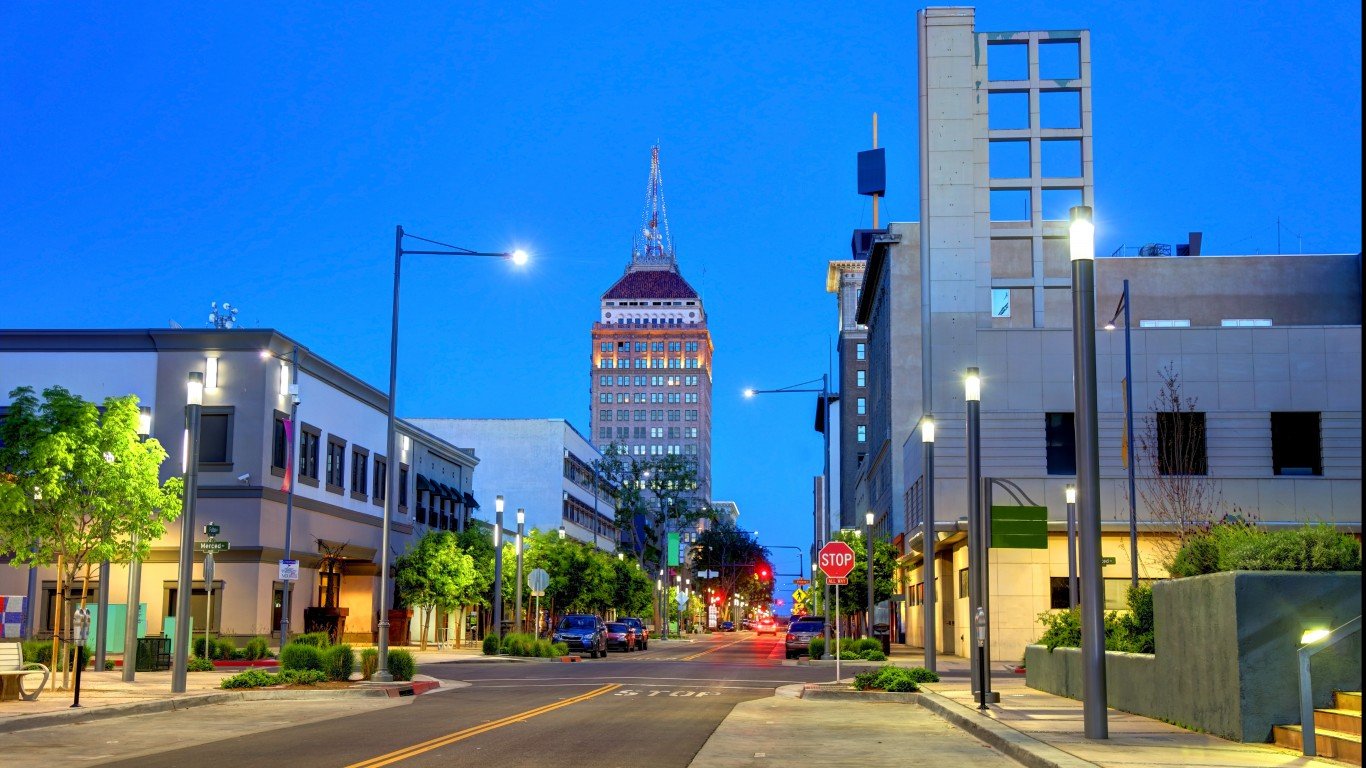
9. California
> Three-year change in unemployment claims: +11.3%
> Unemployment claims, March 24 through May 11, 2019: 316,238
> Unemployment claims, March 20 through May 14, 2022: 351,984
> Unemployment rate, April 2022: 4.6% (5th highest)
> Poverty rate, 2020: 12.6% (24th highest)
[recirclink id=1121430]

8. Oklahoma
> Three-year change in unemployment claims: +15.1%
> Unemployment claims, March 24 through May 11, 2019: 14,894
> Unemployment claims, March 20 through May 14, 2022: 17,139
> Unemployment rate, April 2022: 2.7% (11th lowest)
> Poverty rate, 2020: 15.3% (8th highest)
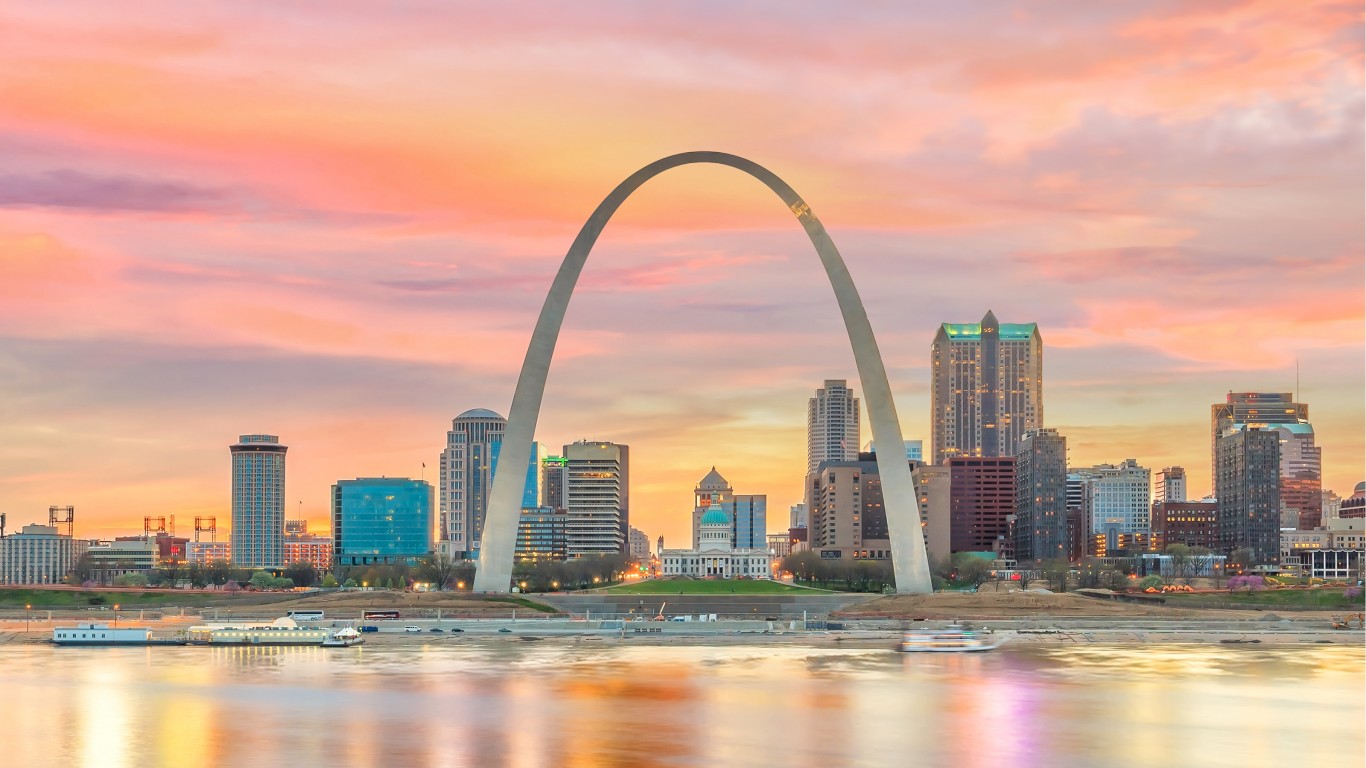
7. Missouri
> Three-year change in unemployment claims: +27.8%
> Unemployment claims, March 24 through May 11, 2019: 22,936
> Unemployment claims, March 20 through May 14, 2022: 29,314
> Unemployment rate, April 2022: 3.4% (24th highest)
> Poverty rate, 2020: 13.0% (19th highest)
[in-text-ad-2]

6. Colorado
> Three-year change in unemployment claims: +28.2%
> Unemployment claims, March 24 through May 11, 2019: 14,485
> Unemployment claims, March 20 through May 14, 2022: 18,566
> Unemployment rate, April 2022: 3.6% (22nd highest)
> Poverty rate, 2020: 9.8% (9th lowest)

5. Kentucky
> Three-year change in unemployment claims: +38.4%
> Unemployment claims, March 24 through May 11, 2019: 16,353
> Unemployment claims, March 20 through May 14, 2022: 22,629
> Unemployment rate, April 2022: 3.9% (20th highest)
> Poverty rate, 2020: 16.6% (5th highest)
[in-text-ad]
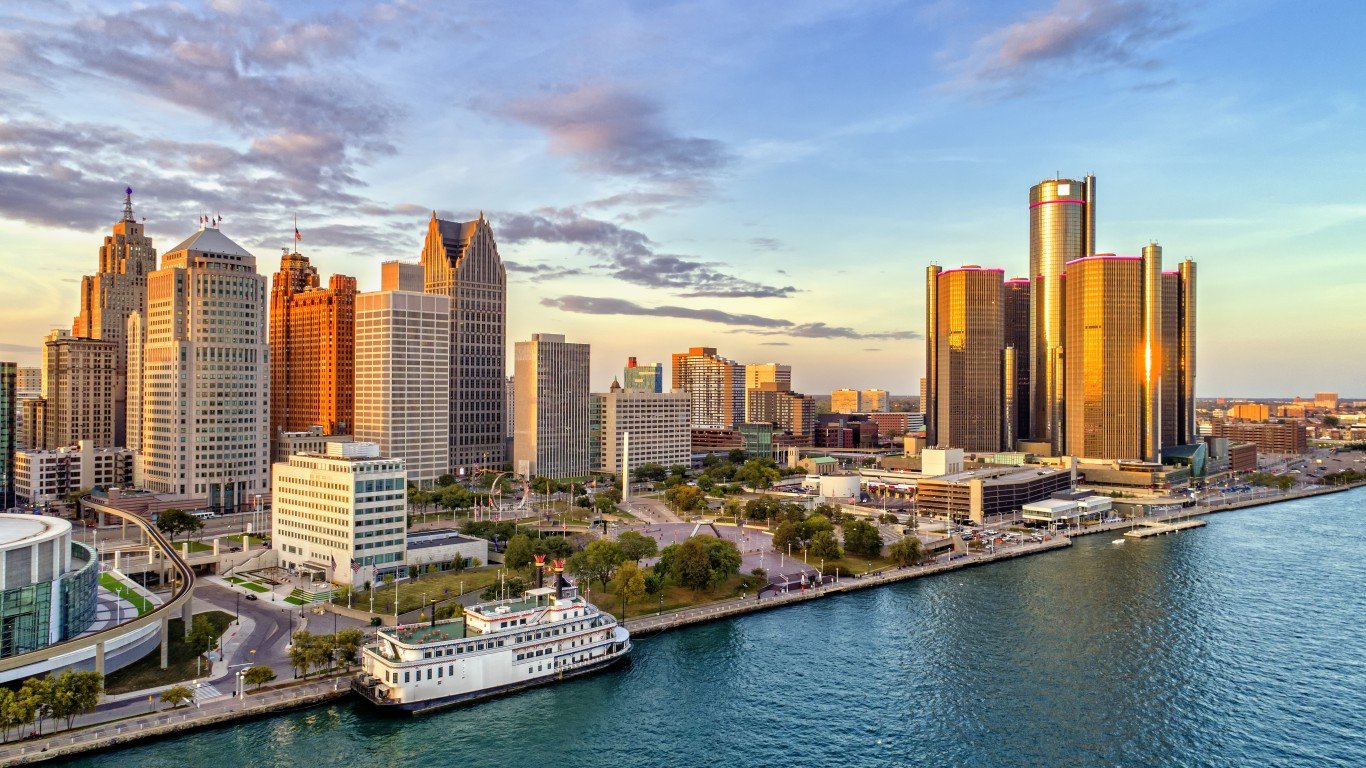
4. Michigan
> Three-year change in unemployment claims: +51.9%
> Unemployment claims, March 24 through May 11, 2019: 41,071
> Unemployment claims, March 20 through May 14, 2022: 62,400
> Unemployment rate, April 2022: 4.3% (10th highest)
> Poverty rate, 2020: 13.7% (15th highest)
[recirclink id=1121426]
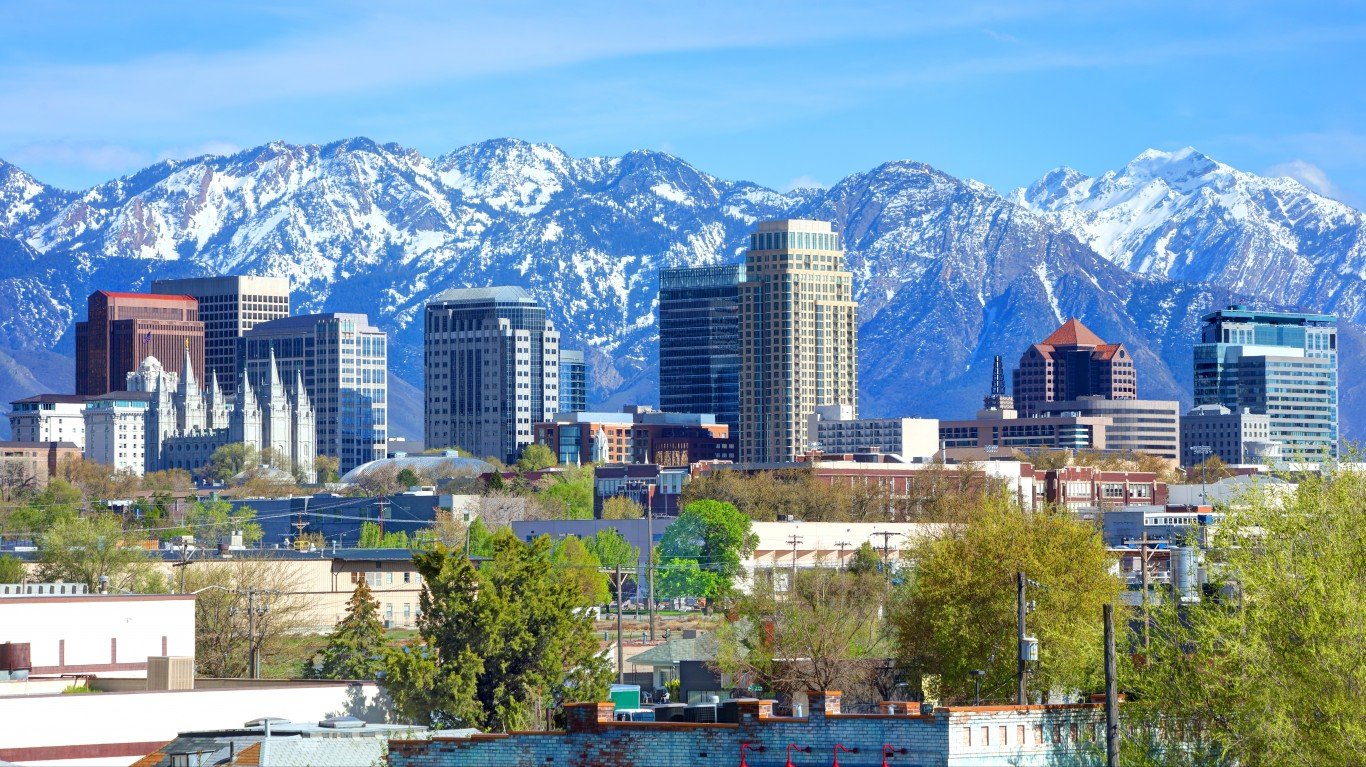
3. Utah
> Three-year change in unemployment claims: +54.0%
> Unemployment claims, March 24 through May 11, 2019: 8,077
> Unemployment claims, March 20 through May 14, 2022: 12,441
> Unemployment rate, April 2022: 1.9% (2nd lowest)
> Poverty rate, 2020: 9.1% (3rd lowest)

2. Ohio
> Three-year change in unemployment claims: +90.4%
> Unemployment claims, March 24 through May 11, 2019: 46,450
> Unemployment claims, March 20 through May 14, 2022: 88,436
> Unemployment rate, April 2022: 4.0% (19th highest)
> Poverty rate, 2020: 13.6% (16th highest)
[in-text-ad-2]

1. Indiana
> Three-year change in unemployment claims: +114.5%
> Unemployment claims, March 24 through May 11, 2019: 18,564
> Unemployment claims, March 20 through May 14, 2022: 39,816
> Unemployment rate, April 2022: 2.2% (4th lowest)
> Poverty rate, 2020: 12.9% (20th highest)
Methodology
To determine the states with the biggest increases in unemployment claims since before the pandemic, 24/7 Wall St. reviewed data on weekly initial unemployment claims from the U.S. Department of Labor. States were ranked based on the percentage change in initial unemployment claims made from the period March 24 through May 11, 2019 to the period March 20 through May 14, 2022.
Data on unemployment rate for April 2022 is from the Bureau of Labor Statistics and is not seasonally adjusted. Data on poverty rate is from the U.S.Census Bureau’s 2020 American Community Survey and figures are five-year estimates.
Contact [email protected] for any questions or corrections.