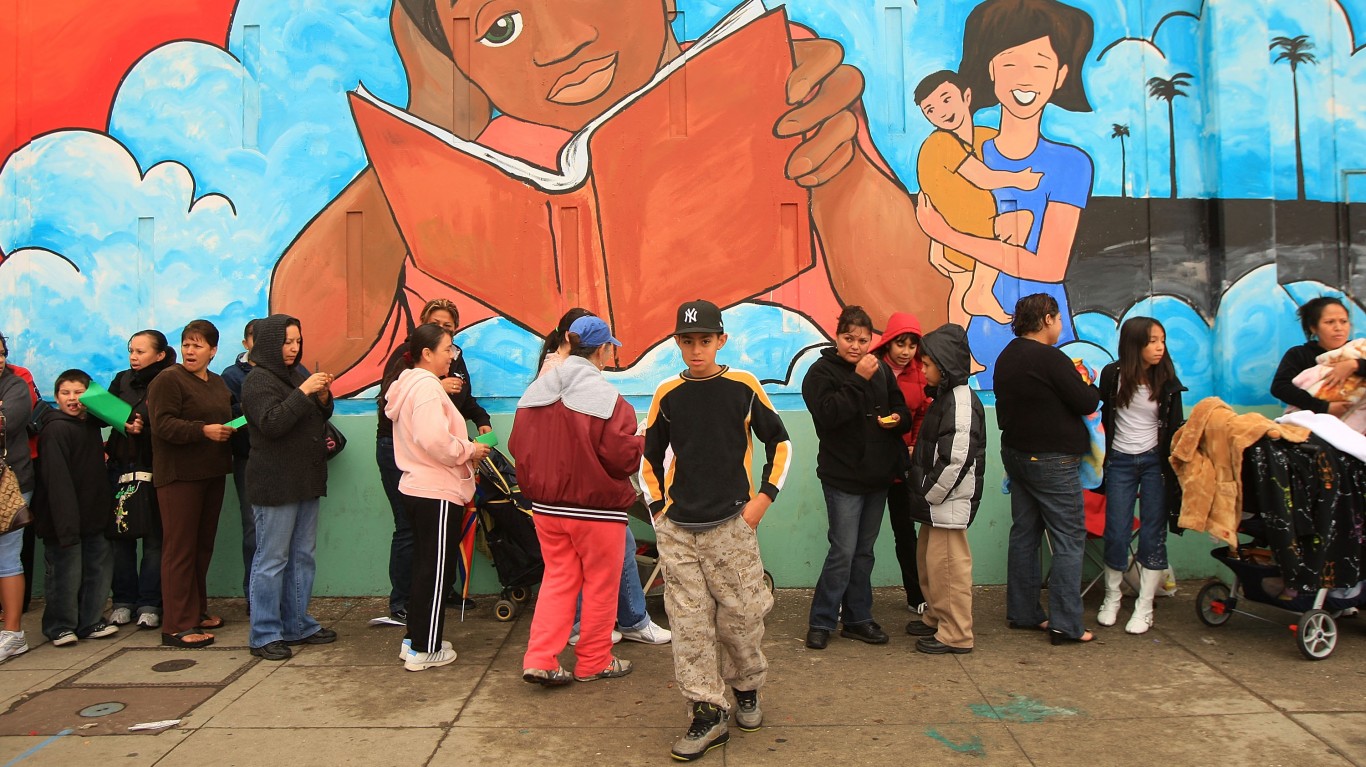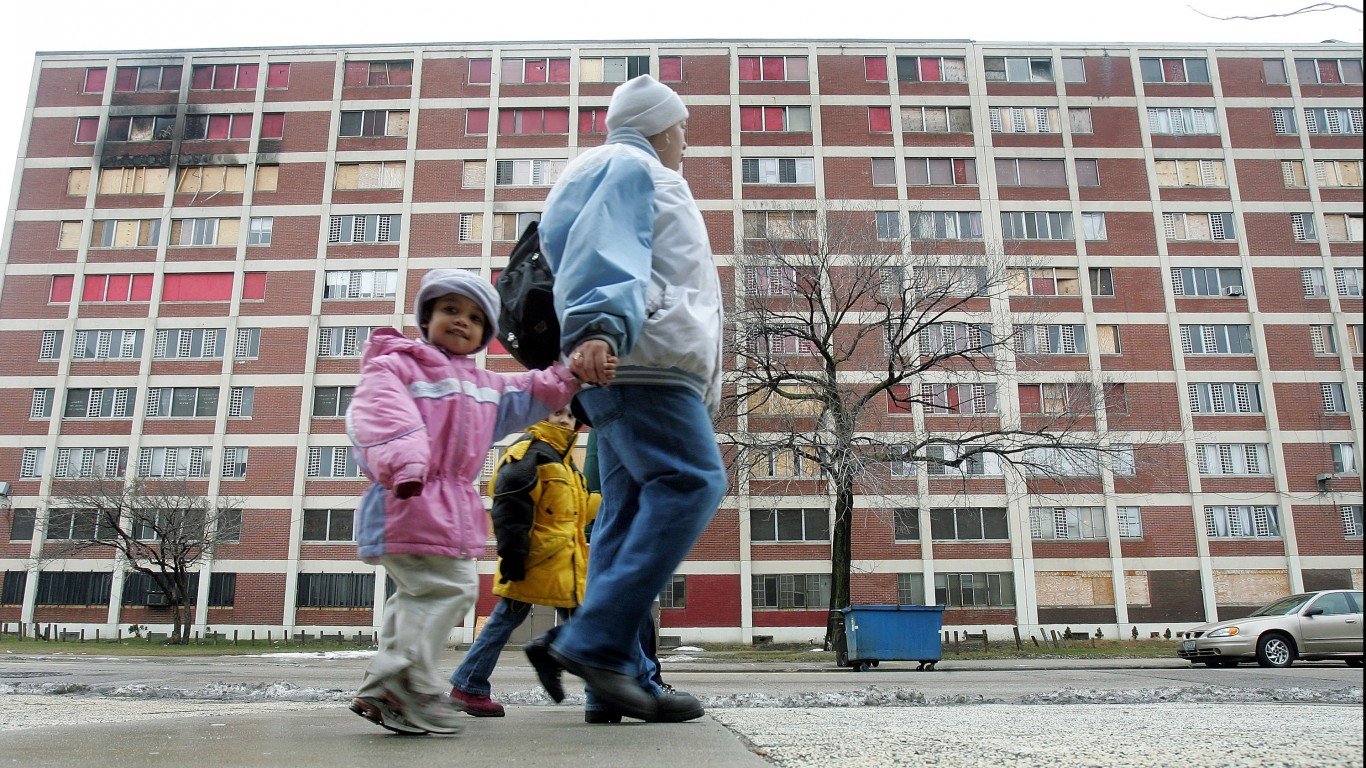
More than 40 million Americans live below the poverty line, and of those facing such financial hardship, children are disproportionately affected. Nearly 12.6 million children under age 18 live in households with poverty level income.
Not only are children at higher risk of poverty, they are also especially vulnerable to poverty’s harmful effects, both in the immediate and long-term. Childhood poverty can negatively impact brain development and has been linked with a greater likelihood of chronic illness, shorter life expectancy, and poor emotional and behavioral health. Those who spend some or all of their childhood in poverty are also less likely to succeed in school or be financially secure later in life.
Nationwide, an estimated 17.5% of children under age 18 live below the poverty line. And though the United States has one of the worst child poverty rates among wealthy, developed countries, in parts of the U.S., child poverty is far less common than average.
Using data from the U.S. Census Bureau, 24/7 Wall St. identified the 50 metropolitan areas with the lowest child poverty rates.
Among the places on this list, child poverty rates range from 11.8% to less than 7%. The metro areas on this list span the country, though five are located in California, the most of any state. Here is a look at the income a family needs to cover normal living expenses in every state.
Not only is serious financial hardship less common in these places than in much of the country, but families also tend to be relatively well off. In all but four metro areas on this list, the median income among households with children exceeds the national median of $77,445, and in over a dozen of these metro areas, the typical family earns over $100,000. Here is a look at the richest town in every state.
Households with two parents are more likely to be financially secure than those headed by a single parent. Single-mother households are especially vulnerable to financial insecurity, and in all but two metro areas on this list, the share of households with children headed by a single mother is below the 11.7% national share.
Click here to see big cities with the lowest child poverty
Click here to read our detailed methodology

50. Des Moines-West Des Moines, IA
> Child poverty rate: 11.8%
> Median family income, households with children: $90,828 — 45th highest of 378 metros
> Share of households with children receiving SNAP benefits: 15.9% — 117th lowest of 378 metros
> Households headed by single mothers: 11.7% — 189th highest of 378 metros
[in-text-ad]

49. Dubuque, IA
> Child poverty rate: 11.8%
> Median family income, households with children: $86,255 — 58th highest of 378 metros
> Share of households with children receiving SNAP benefits: 15.2% — 101st lowest of 378 metros
> Households headed by single mothers: 10.0% — 98th lowest of 378 metros
[recirclink id=1106510]

48. Lincoln, NE
> Child poverty rate: 11.8%
> Median family income, households with children: $80,561 — 103rd highest of 378 metros
> Share of households with children receiving SNAP benefits: 14.0% — 76th lowest of 378 metros
> Households headed by single mothers: 11.0% — 152nd lowest of 378 metros

47. Bloomington, IL
> Child poverty rate: 11.7%
> Median family income, households with children: $94,631 — 37th highest of 378 metros
> Share of households with children receiving SNAP benefits: 14.1% — 78th lowest of 378 metros
> Households headed by single mothers: 10.3% — 114th lowest of 378 metros
[in-text-ad-2]

46. Charlottesville, VA
> Child poverty rate: 11.7%
> Median family income, households with children: $98,085 — 27th highest of 378 metros
> Share of households with children receiving SNAP benefits: 10.0% — 18th lowest of 378 metros
> Households headed by single mothers: 9.3% — 70th lowest of 378 metros

45. Glens Falls, NY
> Child poverty rate: 11.7%
> Median family income, households with children: $69,994 — 183rd highest of 378 metros
> Share of households with children receiving SNAP benefits: 16.4% — 126th lowest of 378 metros
> Households headed by single mothers: 9.7% — 89th lowest of 378 metros
[in-text-ad]

44. Bridgeport-Stamford-Norwalk, CT
> Child poverty rate: 11.6%
> Median family income, households with children: $123,238 — 6th highest of 378 metros
> Share of households with children receiving SNAP benefits: 10.6% — 24th lowest of 378 metros
> Households headed by single mothers: 9.7% — 86th lowest of 378 metros
[recirclink id=1047662]

43. Anchorage, AK
> Child poverty rate: 11.6%
> Median family income, households with children: $93,794 — 40th highest of 378 metros
> Share of households with children receiving SNAP benefits: 13.8% — 73rd lowest of 378 metros
> Households headed by single mothers: 10.1% — 103rd lowest of 378 metros

42. Midland, MI
> Child poverty rate: 11.5%
> Median family income, households with children: $83,481 — 76th highest of 378 metros
> Share of households with children receiving SNAP benefits: 17.5% — 150th lowest of 378 metros
> Households headed by single mothers: 8.5% — 35th lowest of 378 metros
[in-text-ad-2]

41. Missoula, MT
> Child poverty rate: 11.5%
> Median family income, households with children: $80,360 — 106th highest of 378 metros
> Share of households with children receiving SNAP benefits: 17.2% — 144th lowest of 378 metros
> Households headed by single mothers: 8.6% — 41st lowest of 378 metros

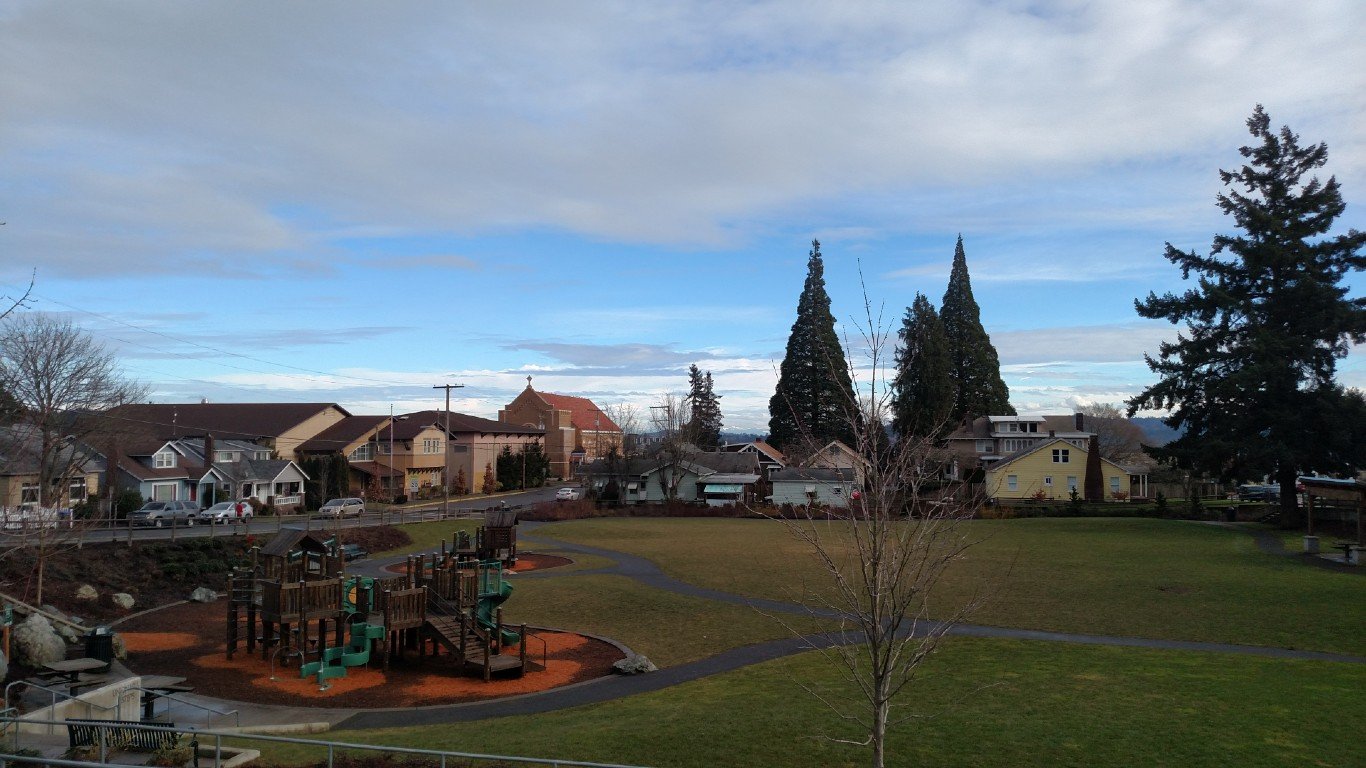
40. Walla Walla, WA
> Child poverty rate: 11.4%
> Median family income, households with children: $71,756 — 165th highest of 378 metros
> Share of households with children receiving SNAP benefits: 18.1% — 168th lowest of 378 metros
> Households headed by single mothers: 8.9% — 50th lowest of 378 metros
[in-text-ad]

39. Olympia-Lacey-Tumwater, WA
> Child poverty rate: 11.4%
> Median family income, households with children: $85,357 — 67th highest of 378 metros
> Share of households with children receiving SNAP benefits: 14.5% — 84th lowest of 378 metros
> Households headed by single mothers: 9.8% — 92nd lowest of 378 metros
[recirclink id=1092222]
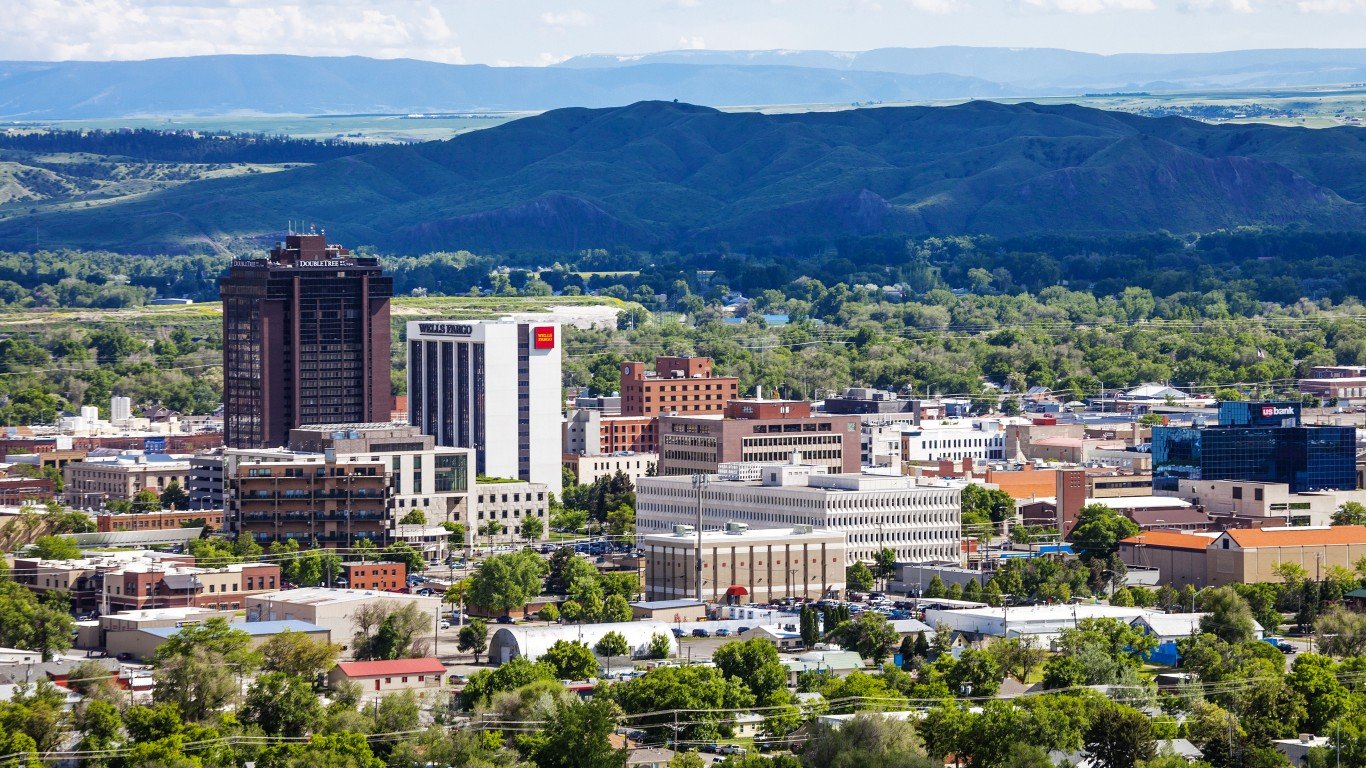
38. Billings, MT
> Child poverty rate: 11.4%
> Median family income, households with children: $80,302 — 107th highest of 378 metros
> Share of households with children receiving SNAP benefits: 12.8% — 47th lowest of 378 metros
> Households headed by single mothers: 9.3% — 71st lowest of 378 metros

37. Iowa City, IA
> Child poverty rate: 11.3%
> Median family income, households with children: $92,367 — 43rd highest of 378 metros
> Share of households with children receiving SNAP benefits: 13.7% — 72nd lowest of 378 metros
> Households headed by single mothers: 9.0% — 53rd lowest of 378 metros
[in-text-ad-2]

36. Harrisonburg, VA
> Child poverty rate: 11.3%
> Median family income, households with children: $70,086 — 181st highest of 378 metros
> Share of households with children receiving SNAP benefits: 12.9% — 50th lowest of 378 metros
> Households headed by single mothers: 10.2% — 108th lowest of 378 metros

35. Omaha-Council Bluffs, NE-IA
> Child poverty rate: 11.2%
> Median family income, households with children: $88,991 — 49th highest of 378 metros
> Share of households with children receiving SNAP benefits: 13.3% — 58th lowest of 378 metros
> Households headed by single mothers: 11.1% — 157th lowest of 378 metros
[in-text-ad]

34. Ann Arbor, MI
> Child poverty rate: 11.1%
> Median family income, households with children: $108,886 — 8th highest of 378 metros
> Share of households with children receiving SNAP benefits: 11.0% — 27th lowest of 378 metros
> Households headed by single mothers: 8.4% — 32nd lowest of 378 metros
[recirclink id=1097516]

33. Casper, WY
> Child poverty rate: 10.9%
> Median family income, households with children: $70,803 — 173rd highest of 378 metros
> Share of households with children receiving SNAP benefits: 12.4% — 44th lowest of 378 metros
> Households headed by single mothers: 13.1% — 111th highest of 378 metros

32. Urban Honolulu, HI
> Child poverty rate: 10.8%
> Median family income, households with children: $99,040 — 23rd highest of 378 metros
> Share of households with children receiving SNAP benefits: 14.3% — 79th lowest of 378 metros
> Households headed by single mothers: 9.1% — 62nd lowest of 378 metros
[in-text-ad-2]

31. Minneapolis-St. Paul-Bloomington, MN-WI
> Child poverty rate: 10.6%
> Median family income, households with children: $106,707 — 10th highest of 378 metros
> Share of households with children receiving SNAP benefits: 10.6% — 25th lowest of 378 metros
> Households headed by single mothers: 10.0% — 100th lowest of 378 metros

30. Mankato, MN
> Child poverty rate: 10.5%
> Median family income, households with children: $84,524 — 73rd highest of 378 metros
> Share of households with children receiving SNAP benefits: 13.1% — 55th lowest of 378 metros
> Households headed by single mothers: 10.1% — 105th lowest of 378 metros
[in-text-ad]

29. Santa Rosa-Petaluma, CA
> Child poverty rate: 10.5%
> Median family income, households with children: $95,288 — 35th highest of 378 metros
> Share of households with children receiving SNAP benefits: 9.9% — 17th lowest of 378 metros
> Households headed by single mothers: 8.6% — 44th lowest of 378 metros
[recirclink id=1012509]
28. Bremerton-Silverdale-Port Orchard, WA
> Child poverty rate: 10.5%
> Median family income, households with children: $87,811 — 55th highest of 378 metros
> Share of households with children receiving SNAP benefits: 13.6% — 67th lowest of 378 metros
> Households headed by single mothers: 8.8% — 49th lowest of 378 metros

27. Boston-Cambridge-Newton, MA-NH
> Child poverty rate: 10.5%
> Median family income, households with children: $123,745 — 5th highest of 378 metros
> Share of households with children receiving SNAP benefits: 13.0% — 54th lowest of 378 metros
> Households headed by single mothers: 10.1% — 102nd lowest of 378 metros
[in-text-ad-2]

26. Denver-Aurora-Lakewood, CO
> Child poverty rate: 10.3%
> Median family income, households with children: $103,320 — 13th highest of 378 metros
> Share of households with children receiving SNAP benefits: 9.5% — 15th lowest of 378 metros
> Households headed by single mothers: 9.2% — 68th lowest of 378 metros

25. Kahului-Wailuku-Lahaina, HI
> Child poverty rate: 10.1%
> Median family income, households with children: $85,527 — 66th highest of 378 metros
> Share of households with children receiving SNAP benefits: 14.3% — 82nd lowest of 378 metros
> Households headed by single mothers: 10.8% — 141st lowest of 378 metros
[in-text-ad]

24. Daphne-Fairhope-Foley, AL
> Child poverty rate: 10.0%
> Median family income, households with children: $88,176 — 53rd highest of 378 metros
> Share of households with children receiving SNAP benefits: 12.1% — 40th lowest of 378 metros
> Households headed by single mothers: 7.4% — 16th lowest of 378 metros
[recirclink id=1106510]

23. Manchester-Nashua, NH
> Child poverty rate: 9.9%
> Median family income, households with children: $103,297 — 14th highest of 378 metros
> Share of households with children receiving SNAP benefits: 12.1% — 38th lowest of 378 metros
> Households headed by single mothers: 9.1% — 63rd lowest of 378 metros

22. Seattle-Tacoma-Bellevue, WA
> Child poverty rate: 9.9%
> Median family income, households with children: $110,397 — 7th highest of 378 metros
> Share of households with children receiving SNAP benefits: 12.3% — 43rd lowest of 378 metros
> Households headed by single mothers: 8.7% — 47th lowest of 378 metros
[in-text-ad-2]

21. State College, PA
> Child poverty rate: 9.7%
> Median family income, households with children: $101,178 — 17th highest of 378 metros
> Share of households with children receiving SNAP benefits: 8.6% — 4th lowest of 378 metros
> Households headed by single mothers: 4.9% — 2nd lowest of 378 metros

20. Salt Lake City, UT
> Child poverty rate: 9.7%
> Median family income, households with children: $88,507 — 51st highest of 378 metros
> Share of households with children receiving SNAP benefits: 8.7% — 6th lowest of 378 metros
> Households headed by single mothers: 8.7% — 46th lowest of 378 metros
[in-text-ad]

19. Washington-Arlington-Alexandria, DC-VA-MD-WV
> Child poverty rate: 9.6%
> Median family income, households with children: $124,589 — 3rd highest of 378 metros
> Share of households with children receiving SNAP benefits: 10.3% — 23rd lowest of 378 metros
> Households headed by single mothers: 10.3% — 116th lowest of 378 metros
[recirclink id=1047662]

18. Burlington-South Burlington, VT
> Child poverty rate: 9.6%
> Median family income, households with children: $98,361 — 26th highest of 378 metros
> Share of households with children receiving SNAP benefits: 10.1% — 20th lowest of 378 metros
> Households headed by single mothers: 8.6% — 40th lowest of 378 metros

17. Rochester, MN
> Child poverty rate: 9.4%
> Median family income, households with children: $97,704 — 30th highest of 378 metros
> Share of households with children receiving SNAP benefits: 9.4% — 14th lowest of 378 metros
> Households headed by single mothers: 8.6% — 42nd lowest of 378 metros
[in-text-ad-2]

16. San Francisco-Oakland-Berkeley, CA
> Child poverty rate: 9.3%
> Median family income, households with children: $140,677 — 2nd highest of 378 metros
> Share of households with children receiving SNAP benefits: 8.7% — 7th lowest of 378 metros
> Households headed by single mothers: 8.5% — 36th lowest of 378 metros

15. Madison, WI
> Child poverty rate: 9.0%
> Median family income, households with children: $99,490 — 21st highest of 378 metros
> Share of households with children receiving SNAP benefits: 11.4% — 29th lowest of 378 metros
> Households headed by single mothers: 9.5% — 76th lowest of 378 metros
[in-text-ad]

14. Portland-South Portland, ME
> Child poverty rate: 9.0%
> Median family income, households with children: $96,171 — 32nd highest of 378 metros
> Share of households with children receiving SNAP benefits: 13.6% — 70th lowest of 378 metros
> Households headed by single mothers: 8.3% — 30th lowest of 378 metros
[recirclink id=1092222]

13. Appleton, WI
> Child poverty rate: 9.0%
> Median family income, households with children: $91,225 — 44th highest of 378 metros
> Share of households with children receiving SNAP benefits: 9.2% — 10th lowest of 378 metros
> Households headed by single mothers: 7.3% — 15th lowest of 378 metros

12. Barnstable Town, MA
> Child poverty rate: 9.0%
> Median family income, households with children: $100,000 — 20th highest of 378 metros
> Share of households with children receiving SNAP benefits: 12.9% — 51st lowest of 378 metros
> Households headed by single mothers: 6.3% — 5th lowest of 378 metros
[in-text-ad-2]

11. Provo-Orem, UT
> Child poverty rate: 8.7%
> Median family income, households with children: $87,989 — 54th highest of 378 metros
> Share of households with children receiving SNAP benefits: 7.9% — 3rd lowest of 378 metros
> Households headed by single mothers: 5.5% — 4th lowest of 378 metros

10. Ames, IA
> Child poverty rate: 8.6%
> Median family income, households with children: $96,831 — 31st highest of 378 metros
> Share of households with children receiving SNAP benefits: 9.3% — 12th lowest of 378 metros
> Households headed by single mothers: 6.5% — 7th lowest of 378 metros
[in-text-ad]

9. Sioux Falls, SD
> Child poverty rate: 8.6%
> Median family income, households with children: $84,784 — 72nd highest of 378 metros
> Share of households with children receiving SNAP benefits: 12.5% — 45th lowest of 378 metros
> Households headed by single mothers: 11.3% — 164th lowest of 378 metros
[recirclink id=1097516]

8. Fort Collins, CO
> Child poverty rate: 8.6%
> Median family income, households with children: $98,416 — 25th highest of 378 metros
> Share of households with children receiving SNAP benefits: 10.1% — 19th lowest of 378 metros
> Households headed by single mothers: 7.1% — 10th lowest of 378 metros
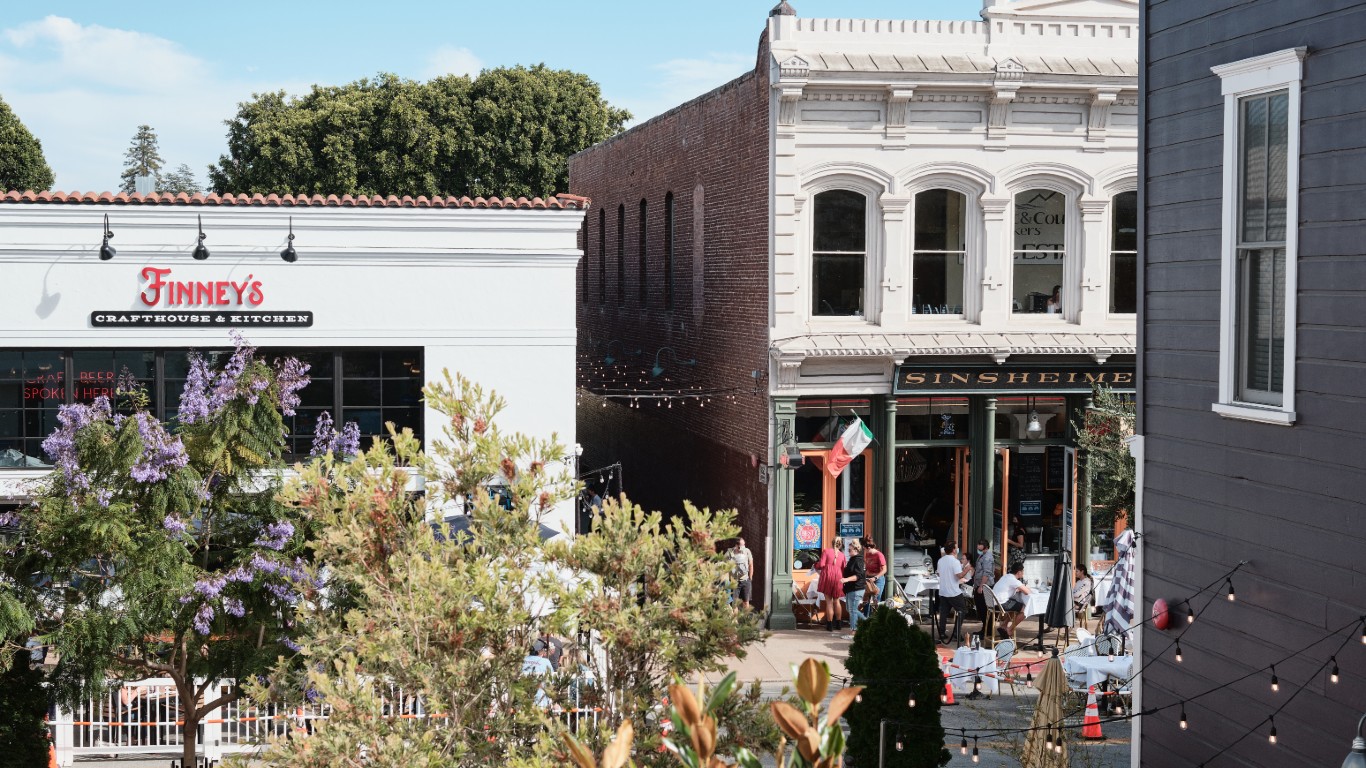
7. San Luis Obispo-Paso Robles, CA
> Child poverty rate: 8.5%
> Median family income, households with children: $92,627 — 42nd highest of 378 metros
> Share of households with children receiving SNAP benefits: 8.7% — 5th lowest of 378 metros
> Households headed by single mothers: 7.8% — 22nd lowest of 378 metros
[in-text-ad-2]

6. Napa, CA
> Child poverty rate: 8.0%
> Median family income, households with children: $101,922 — 15th highest of 378 metros
> Share of households with children receiving SNAP benefits: 9.2% — 11th lowest of 378 metros
> Households headed by single mothers: 8.2% — 28th lowest of 378 metros

5. Ogden-Clearfield, UT
> Child poverty rate: 7.9%
> Median family income, households with children: $85,016 — 71st highest of 378 metros
> Share of households with children receiving SNAP benefits: 8.7% — 8th lowest of 378 metros
> Households headed by single mothers: 8.1% — 27th lowest of 378 metros
[in-text-ad]

4. San Jose-Sunnyvale-Santa Clara, CA
> Child poverty rate: 7.5%
> Median family income, households with children: $160,683 — the highest of 378 metros
> Share of households with children receiving SNAP benefits: 7.1% — 2nd lowest of 378 metros
> Households headed by single mothers: 7.1% — 12th lowest of 378 metros
[recirclink id=1012509]
3. La Crosse-Onalaska, WI-MN
> Child poverty rate: 7.0%
> Median family income, households with children: $82,768 — 80th highest of 378 metros
> Share of households with children receiving SNAP benefits: 13.5% — 65th lowest of 378 metros
> Households headed by single mothers: 9.0% — 55th lowest of 378 metros

2. Bismarck, ND
> Child poverty rate: 6.9%
> Median family income, households with children: $96,078 — 33rd highest of 378 metros
> Share of households with children receiving SNAP benefits: 9.1% — 9th lowest of 378 metros
> Households headed by single mothers: 9.9% — 96th lowest of 378 metros
[in-text-ad-2]

1. Boulder, CO
> Child poverty rate: 6.4%
> Median family income, households with children: $124,209 — 4th highest of 378 metros
> Share of households with children receiving SNAP benefits: 6.6% — the lowest of 378 metros
> Households headed by single mothers: 7.8% — 21st lowest of 378 metros
Methodology
To determine the metro areas where the fewest children live in poverty, 24/7 Wall St. reviewed five-year estimates of child poverty rates from the U.S. Census Bureau’s 2020 American Community Survey.
We used the 384 metropolitan statistical areas as delineated by the United States Office of Management and Budget and used by the Census Bureau as our definition of metros.
Metro areas were ranked based on the share of children living in poverty. To break ties, we used the number of children living in poverty.
Additional information on median income for families with children, the share of households with children receiving benefits from the Supplemental Nutrition Assistance Program, and the share of households headed by single mothers are also five-year estimates from the 2020 ACS. Because the Census Bureau didn’t release one-year estimates for 2020 due to data collection issues caused by the COVID-19 pandemic, all ACS data are five-year estimates.
Contact [email protected] for any questions or corrections.