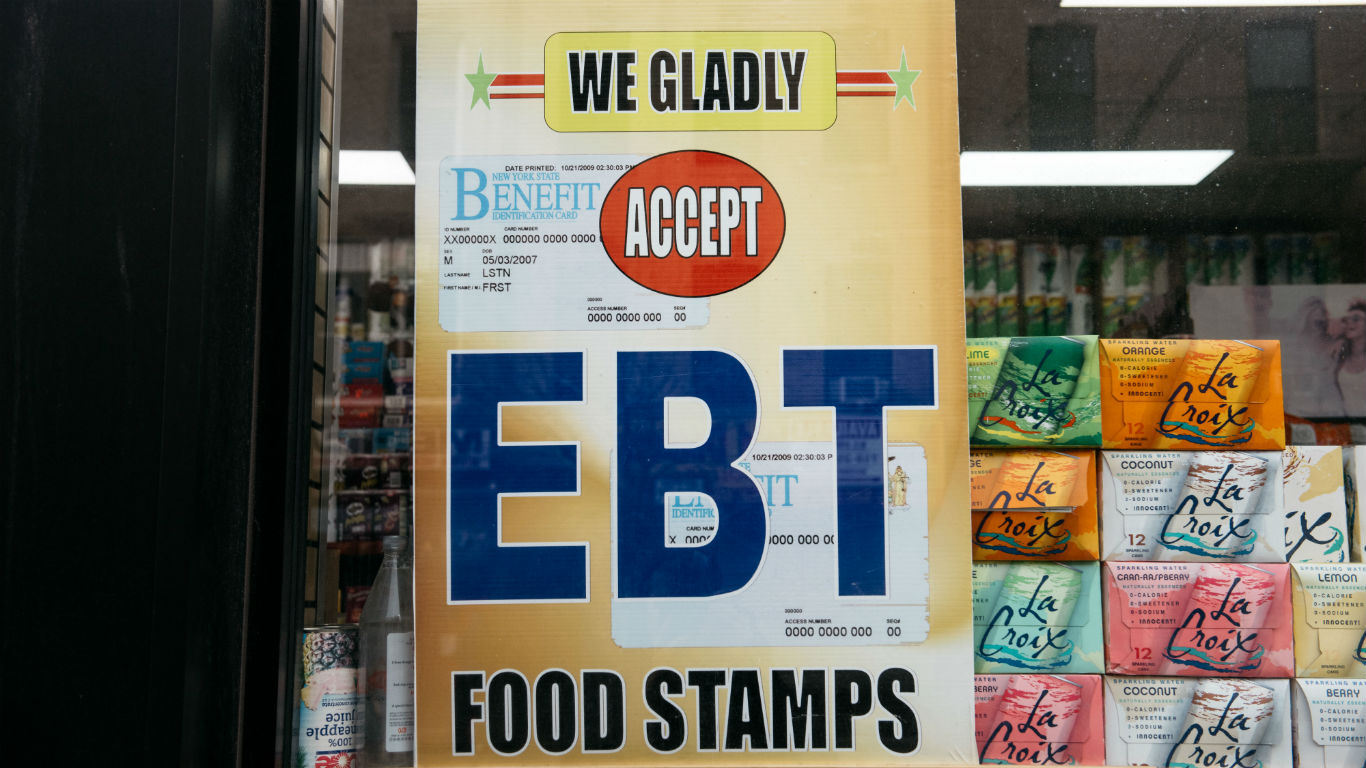
Inflation has driven up the prices of nearly all goods and services, including necessary items such as groceries. The cost of a carton of eggs was 32% higher in May compared to a year ago. According to a report by Moody’s Analytics, American families pay $311 more each month, on average, for essential goods compared to one year ago. To survive the price hikes, millions of Americans may have to rely on the government’s food assistance benefits, the Supplemental Nutrition Assistance Program.
As of 2020, roughly 13.8 million U.S. households, about one in 10, received SNAP benefits, formerly known as food stamps. At the more local level, there are highly impoverished places where SNAP assistance is more common.
To find the 50 metropolitan areas with the highest SNAP recipiency rates, 24/7 Wall St. reviewed five-year estimates of the share of households that received SNAP benefits in the past 12 months from the U.S. Census Bureau’s 2020 American Community Survey. As of 2020, 11.4% of U.S. households received SNAP benefits. Among the 50 metro areas on this list, that share ranges from 16.5% to 28.4% of households.
While factors such as assets and household composition impact whether a household qualifies for the benefit, SNAP recipiency is primarily determined by income. So, as might be expected, metros with lower incomes and higher poverty rates tend to have more households receiving benefits.
In 2020, 13.1% of Americans lived below the poverty line. In 48 of the 50 metro areas on this list, the poverty rate is higher. In the McAllen-Edinburg-Mission, Texas, metropolitan area, which has the highest SNAP recipiency among metros, 28.4% of the population lives on poverty-level incomes. These are the states where the most children live in Poverty.
Because income is the primary determinant for SNAP recipiency, unemployment is a major determinant in how many people receive benefits, as those workers who are out of a job are likely to have little to no income. All but five of the metros on this list have five-year average unemployment rates at least as high as the national five-year unemployment rate of 5.3%. The El Centro, California, metropolitan area, which has the fourth highest SNAP recipiency rate among metro areas, has a five-year unemployment rate of 13.6%, the highest such figure among U.S. metros. These are the states with the worst spikes in unemployment since the pandemic began.
Click here to see metros with the highest SNAP recipiency rates
Click here to read our detailed methodology

50. Jackson, TN
> Households receiving SNAP benefits: 16.5%
> Poverty rate: 17.6% — 61st highest of 384 metros
> Median household income: $48,146 — 38th lowest of 384 metros
> Unemployment rate: 6.3% — 78th highest of 384 metros
[in-text-ad]

49. Altoona, PA
> Households receiving SNAP benefits: 16.6%
> Poverty rate: 13.8% — 173rd highest of 384 metros
> Median household income: $50,856 — 71st lowest of 384 metros
> Unemployment rate: 4.7% — 131st lowest of 384 metros
[recirclink id=1112369]

48. Corpus Christi, TX
> Households receiving SNAP benefits: 16.7%
> Poverty rate: 16.0% — 96th highest of 384 metros
> Median household income: $56,714 — 162nd lowest of 384 metros
> Unemployment rate: 5.6% — 141st highest of 384 metros

47. Miami-Fort Lauderdale-Pompano Beach, FL
> Households receiving SNAP benefits: 16.7%
> Poverty rate: 13.9% — 164th highest of 384 metros
> Median household income: $59,030 — 189th highest of 384 metros
> Unemployment rate: 5.6% — 149th highest of 384 metros
[in-text-ad-2]

46. Pine Bluff, AR
> Households receiving SNAP benefits: 16.9%
> Poverty rate: 20.0% — 25th highest of 384 metros
> Median household income: $41,856 — 3rd lowest of 384 metros
> Unemployment rate: 7.4% — 31st highest of 384 metros

45. Huntington-Ashland, WV-KY-OH
> Households receiving SNAP benefits: 17.0%
> Poverty rate: 18.6% — 40th highest of 384 metros
> Median household income: $48,085 — 37th lowest of 384 metros
> Unemployment rate: 5.4% — 175th highest of 384 metros
[in-text-ad]

44. Rockford, IL
> Households receiving SNAP benefits: 17.0%
> Poverty rate: 14.6% — 135th highest of 384 metros
> Median household income: $56,899 — 164th lowest of 384 metros
> Unemployment rate: 7.7% — 24th highest of 384 metros
[recirclink id=1111559]

43. Bakersfield, CA
> Households receiving SNAP benefits: 17.0%
> Poverty rate: 20.4% — 22nd highest of 384 metros
> Median household income: $54,851 — 129th lowest of 384 metros
> Unemployment rate: 9.1% — 5th highest of 384 metros

42. Scranton-Wilkes-Barre, PA
> Households receiving SNAP benefits: 17.1%
> Poverty rate: 14.1% — 150th highest of 384 metros
> Median household income: $53,853 — 118th lowest of 384 metros
> Unemployment rate: 5.3% — 181st highest of 384 metros
[in-text-ad-2]

41. Florence, SC
> Households receiving SNAP benefits: 17.1%
> Poverty rate: 18.7% — 37th highest of 384 metros
> Median household income: $45,037 — 10th lowest of 384 metros
> Unemployment rate: 5.9% — 108th highest of 384 metros

40. Medford, OR
> Households receiving SNAP benefits: 17.1%
> Poverty rate: 13.7% — 176th highest of 384 metros
> Median household income: $56,327 — 156th lowest of 384 metros
> Unemployment rate: 5.1% — 189th lowest of 384 metros
[in-text-ad]

39. Macon-Bibb County, GA
> Households receiving SNAP benefits: 17.2%
> Poverty rate: 21.4% — 16th highest of 384 metros
> Median household income: $46,083 — 15th lowest of 384 metros
> Unemployment rate: 6.5% — 66th highest of 384 metros
[recirclink id=1047662]
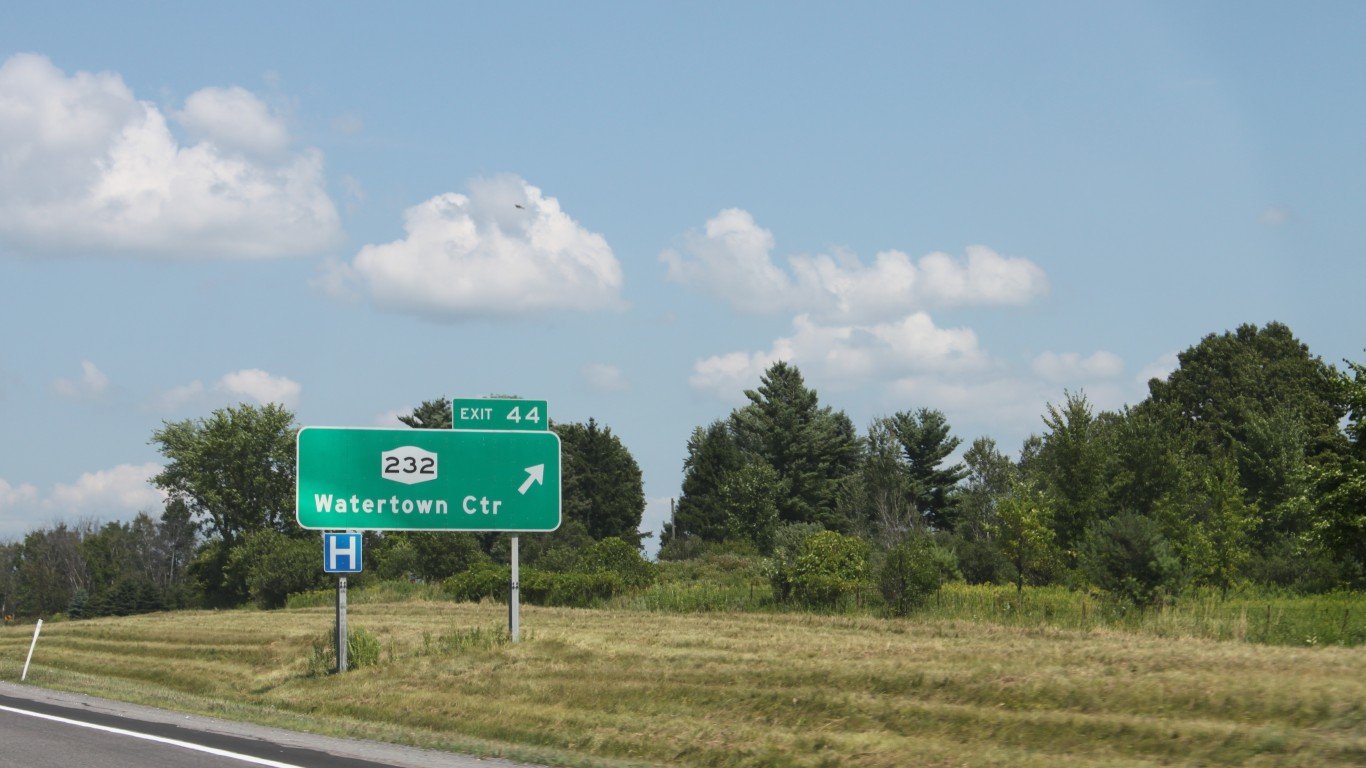
38. Watertown-Fort Drum, NY
> Households receiving SNAP benefits: 17.2%
> Poverty rate: 14.4% — 145th highest of 384 metros
> Median household income: $54,726 — 128th lowest of 384 metros
> Unemployment rate: 4.7% — 135th lowest of 384 metros

37. Decatur, IL
> Households receiving SNAP benefits: 17.2%
> Poverty rate: 15.2% — 126th highest of 384 metros
> Median household income: $53,725 — 115th lowest of 384 metros
> Unemployment rate: 7.7% — 25th highest of 384 metros
[in-text-ad-2]

36. Charleston, WV
> Households receiving SNAP benefits: 17.2%
> Poverty rate: 18.1% — 51st highest of 384 metros
> Median household income: $46,099 — 16th lowest of 384 metros
> Unemployment rate: 6.1% — 93rd highest of 384 metros

35. Yuma, AZ
> Households receiving SNAP benefits: 17.3%
> Poverty rate: 18.2% — 46th highest of 384 metros
> Median household income: $48,790 — 47th lowest of 384 metros
> Unemployment rate: 8.3% — 14th highest of 384 metros
[in-text-ad]

34. Lewiston-Auburn, ME
> Households receiving SNAP benefits: 17.3%
> Poverty rate: 11.3% — 113th lowest of 384 metros
> Median household income: $55,002 — 141st lowest of 384 metros
> Unemployment rate: 4.5% — 102nd lowest of 384 metros
[recirclink id=1104870]
33. Valdosta, GA
> Households receiving SNAP benefits: 17.3%
> Poverty rate: 23.1% — 7th highest of 384 metros
> Median household income: $43,859 — 7th lowest of 384 metros
> Unemployment rate: 5.4% — 169th highest of 384 metros
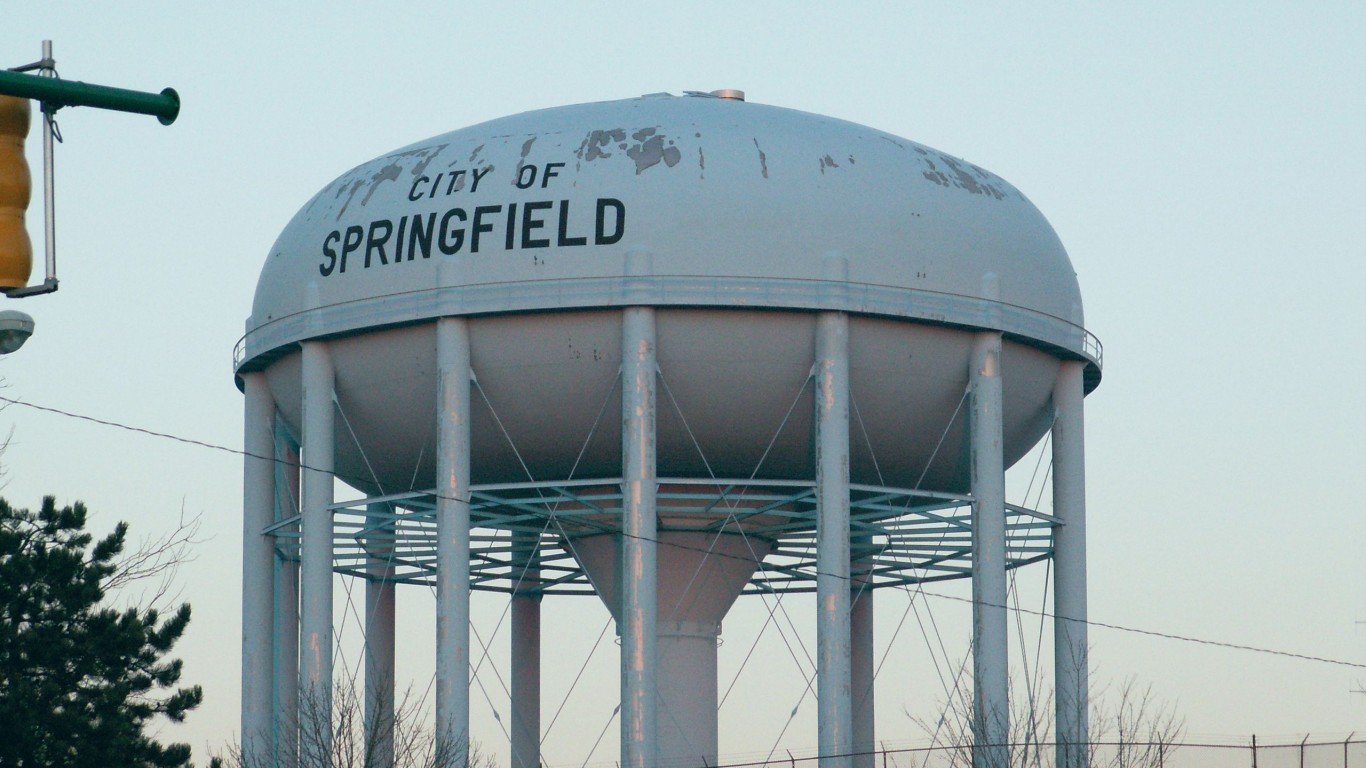
32. Springfield, OH
> Households receiving SNAP benefits: 17.5%
> Poverty rate: 15.3% — 122nd highest of 384 metros
> Median household income: $51,504 — 78th lowest of 384 metros
> Unemployment rate: 6.8% — 53rd highest of 384 metros
[in-text-ad-2]

31. Johnstown, PA
> Households receiving SNAP benefits: 17.5%
> Poverty rate: 14.5% — 136th highest of 384 metros
> Median household income: $47,644 — 32nd lowest of 384 metros
> Unemployment rate: 5.2% — 191st lowest of 384 metros

30. Erie, PA
> Households receiving SNAP benefits: 17.5%
> Poverty rate: 15.5% — 113th highest of 384 metros
> Median household income: $52,863 — 99th lowest of 384 metros
> Unemployment rate: 5.4% — 167th highest of 384 metros
[in-text-ad]

29. Alexandria, LA
> Households receiving SNAP benefits: 17.6%
> Poverty rate: 18.4% — 44th highest of 384 metros
> Median household income: $48,294 — 44th lowest of 384 metros
> Unemployment rate: 5.6% — 146th highest of 384 metros
[recirclink id=1100321]

28. Salem, OR
> Households receiving SNAP benefits: 17.7%
> Poverty rate: 13.1% — 178th lowest of 384 metros
> Median household income: $62,539 — 131st highest of 384 metros
> Unemployment rate: 5.4% — 172nd highest of 384 metros

27. Monroe, LA
> Households receiving SNAP benefits: 17.7%
> Poverty rate: 23.5% — 5th highest of 384 metros
> Median household income: $43,212 — 4th lowest of 384 metros
> Unemployment rate: 5.3% — 179th highest of 384 metros
[in-text-ad-2]

26. Springfield, MA
> Households receiving SNAP benefits: 17.8%
> Poverty rate: 14.1% — 151st highest of 384 metros
> Median household income: $61,360 — 154th highest of 384 metros
> Unemployment rate: 6.0% — 103rd highest of 384 metros

25. Sumter, SC
> Households receiving SNAP benefits: 18.0%
> Poverty rate: 19.0% — 31st highest of 384 metros
> Median household income: $45,854 — 12th lowest of 384 metros
> Unemployment rate: 8.7% — 9th highest of 384 metros
[in-text-ad]

24. Madera, CA
> Households receiving SNAP benefits: 18.1%
> Poverty rate: 19.0% — 29th highest of 384 metros
> Median household income: $61,924 — 140th highest of 384 metros
> Unemployment rate: 9.6% — 4th highest of 384 metros
[recirclink id=1112369]

23. Saginaw, MI
> Households receiving SNAP benefits: 18.3%
> Poverty rate: 17.6% — 62nd highest of 384 metros
> Median household income: $49,565 — 55th lowest of 384 metros
> Unemployment rate: 6.5% — 63rd highest of 384 metros

22. Pueblo, CO
> Households receiving SNAP benefits: 18.5%
> Poverty rate: 17.6% — 60th highest of 384 metros
> Median household income: $49,979 — 58th lowest of 384 metros
> Unemployment rate: 6.9% — 49th highest of 384 metros
[in-text-ad-2]

21. Cumberland, MD-WV
> Households receiving SNAP benefits: 18.6%
> Poverty rate: 14.9% — 132nd highest of 384 metros
> Median household income: $50,188 — 61st lowest of 384 metros
> Unemployment rate: 7.4% — 29th highest of 384 metros

20. Hammond, LA
> Households receiving SNAP benefits: 18.6%
> Poverty rate: 20.2% — 23rd highest of 384 metros
> Median household income: $48,745 — 46th lowest of 384 metros
> Unemployment rate: 7.1% — 42nd highest of 384 metros
[in-text-ad]

19. Albany-Lebanon, OR
> Households receiving SNAP benefits: 18.6%
> Poverty rate: 12.3% — 141st lowest of 384 metros
> Median household income: $59,547 — 179th highest of 384 metros
> Unemployment rate: 6.8% — 52nd highest of 384 metros
[recirclink id=1111559]

18. Fresno, CA
> Households receiving SNAP benefits: 18.8%
> Poverty rate: 20.8% — 20th highest of 384 metros
> Median household income: $57,109 — 168th lowest of 384 metros
> Unemployment rate: 8.8% — 7th highest of 384 metros
17. Eugene-Springfield, OR
> Households receiving SNAP benefits: 19.0%
> Poverty rate: 17.2% — 67th highest of 384 metros
> Median household income: $54,942 — 137th lowest of 384 metros
> Unemployment rate: 7.1% — 41st highest of 384 metros
[in-text-ad-2]

16. Merced, CA
> Households receiving SNAP benefits: 19.0%
> Poverty rate: 18.8% — 34th highest of 384 metros
> Median household income: $56,330 — 157th lowest of 384 metros
> Unemployment rate: 10.7% — 2nd highest of 384 metros

15. Farmington, NM
> Households receiving SNAP benefits: 19.5%
> Poverty rate: 21.7% — 12th highest of 384 metros
> Median household income: $47,643 — 31st lowest of 384 metros
> Unemployment rate: 8.2% — 15th highest of 384 metros
[in-text-ad]
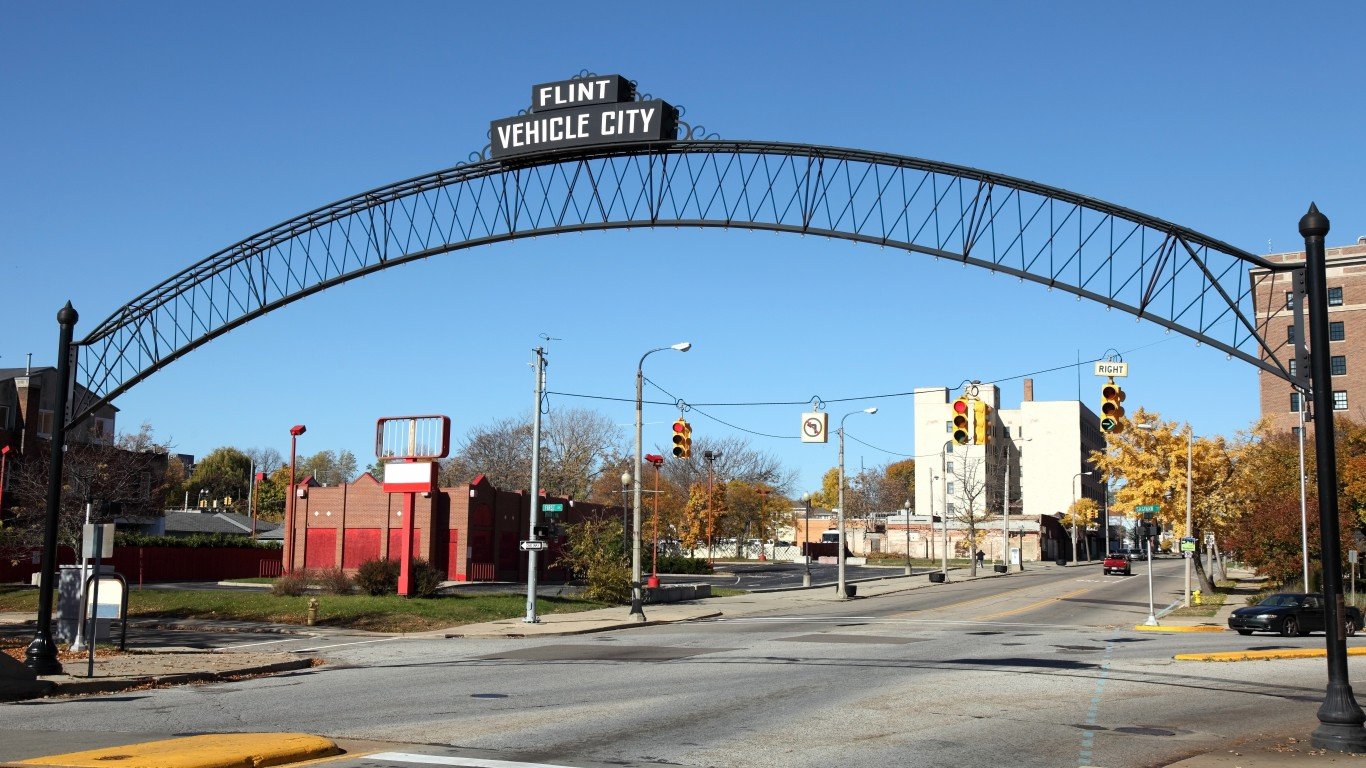
14. Flint, MI
> Households receiving SNAP benefits: 19.6%
> Poverty rate: 18.0% — 54th highest of 384 metros
> Median household income: $50,269 — 64th lowest of 384 metros
> Unemployment rate: 8.9% — 6th highest of 384 metros
[recirclink id=1047662]

13. Rocky Mount, NC
> Households receiving SNAP benefits: 19.8%
> Poverty rate: 18.1% — 50th highest of 384 metros
> Median household income: $46,482 — 20th lowest of 384 metros
> Unemployment rate: 7.8% — 22nd highest of 384 metros

12. Longview, WA
> Households receiving SNAP benefits: 19.9%
> Poverty rate: 13.3% — 186th lowest of 384 metros
> Median household income: $58,791 — 191st lowest of 384 metros
> Unemployment rate: 6.5% — 67th highest of 384 metros
[in-text-ad-2]

11. Beckley, WV
> Households receiving SNAP benefits: 20.1%
> Poverty rate: 21.0% — 17th highest of 384 metros
> Median household income: $43,444 — 5th lowest of 384 metros
> Unemployment rate: 7.0% — 44th highest of 384 metros

10. El Paso, TX
> Households receiving SNAP benefits: 20.1%
> Poverty rate: 19.5% — 26th highest of 384 metros
> Median household income: $48,193 — 40th lowest of 384 metros
> Unemployment rate: 6.0% — 105th highest of 384 metros
[in-text-ad]

9. Albany, GA
> Households receiving SNAP benefits: 21.3%
> Poverty rate: 23.3% — 6th highest of 384 metros
> Median household income: $46,323 — 18th lowest of 384 metros
> Unemployment rate: 8.4% — 12th highest of 384 metros
[recirclink id=1104870]

8. Yakima, WA
> Households receiving SNAP benefits: 21.5%
> Poverty rate: 16.5% — 84th highest of 384 metros
> Median household income: $54,917 — 136th lowest of 384 metros
> Unemployment rate: 6.4% — 69th highest of 384 metros
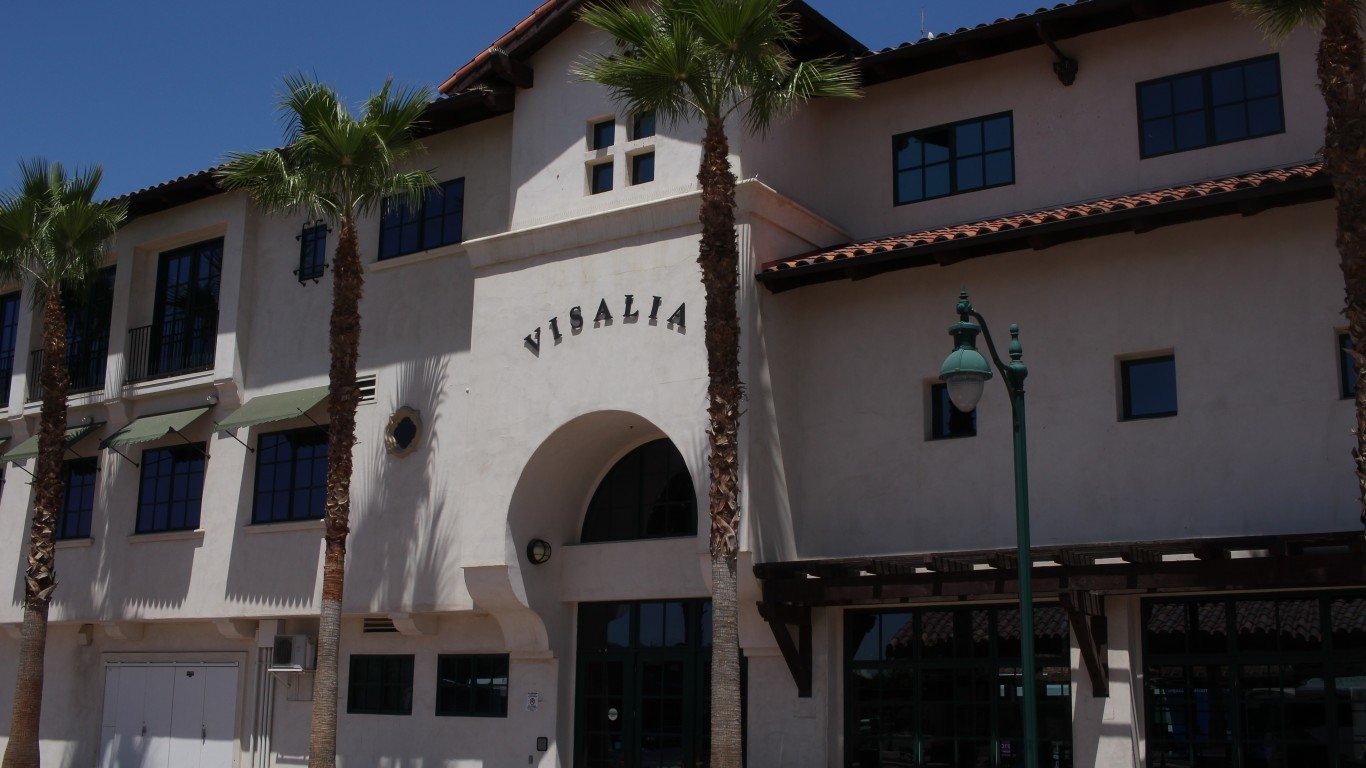
7. Visalia, CA
> Households receiving SNAP benefits: 22.1%
> Poverty rate: 21.8% — 11th highest of 384 metros
> Median household income: $52,534 — 94th lowest of 384 metros
> Unemployment rate: 9.9% — 3rd highest of 384 metros
[in-text-ad-2]
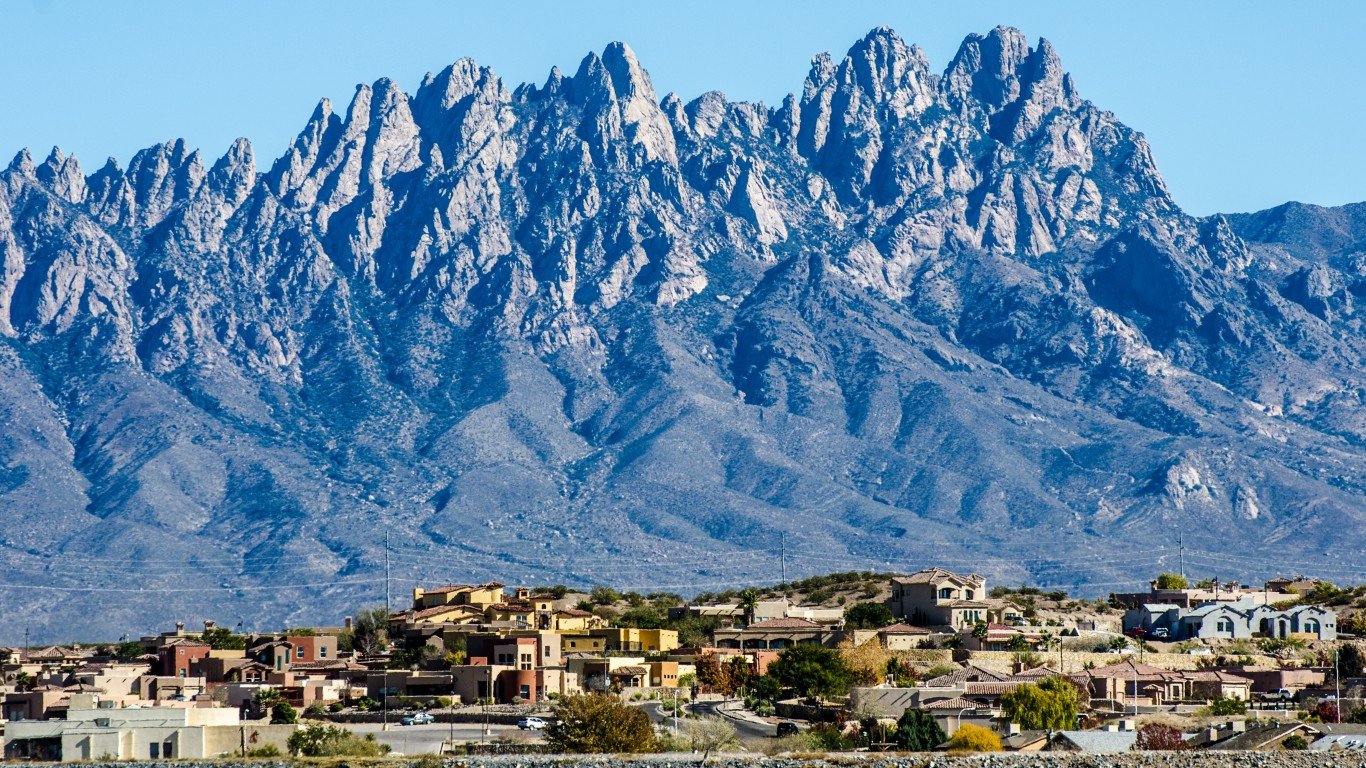
6. Las Cruces, NM
> Households receiving SNAP benefits: 23.0%
> Poverty rate: 24.8% — 3rd highest of 384 metros
> Median household income: $44,024 — 8th lowest of 384 metros
> Unemployment rate: 7.6% — 26th highest of 384 metros

5. Grants Pass, OR
> Households receiving SNAP benefits: 23.4%
> Poverty rate: 16.0% — 100th highest of 384 metros
> Median household income: $47,733 — 34th lowest of 384 metros
> Unemployment rate: 7.4% — 28th highest of 384 metros
[in-text-ad]

4. El Centro, CA
> Households receiving SNAP benefits: 23.6%
> Poverty rate: 22.5% — 8th highest of 384 metros
> Median household income: $46,222 — 17th lowest of 384 metros
> Unemployment rate: 13.6% — the highest of 384 metros
[recirclink id=1100321]
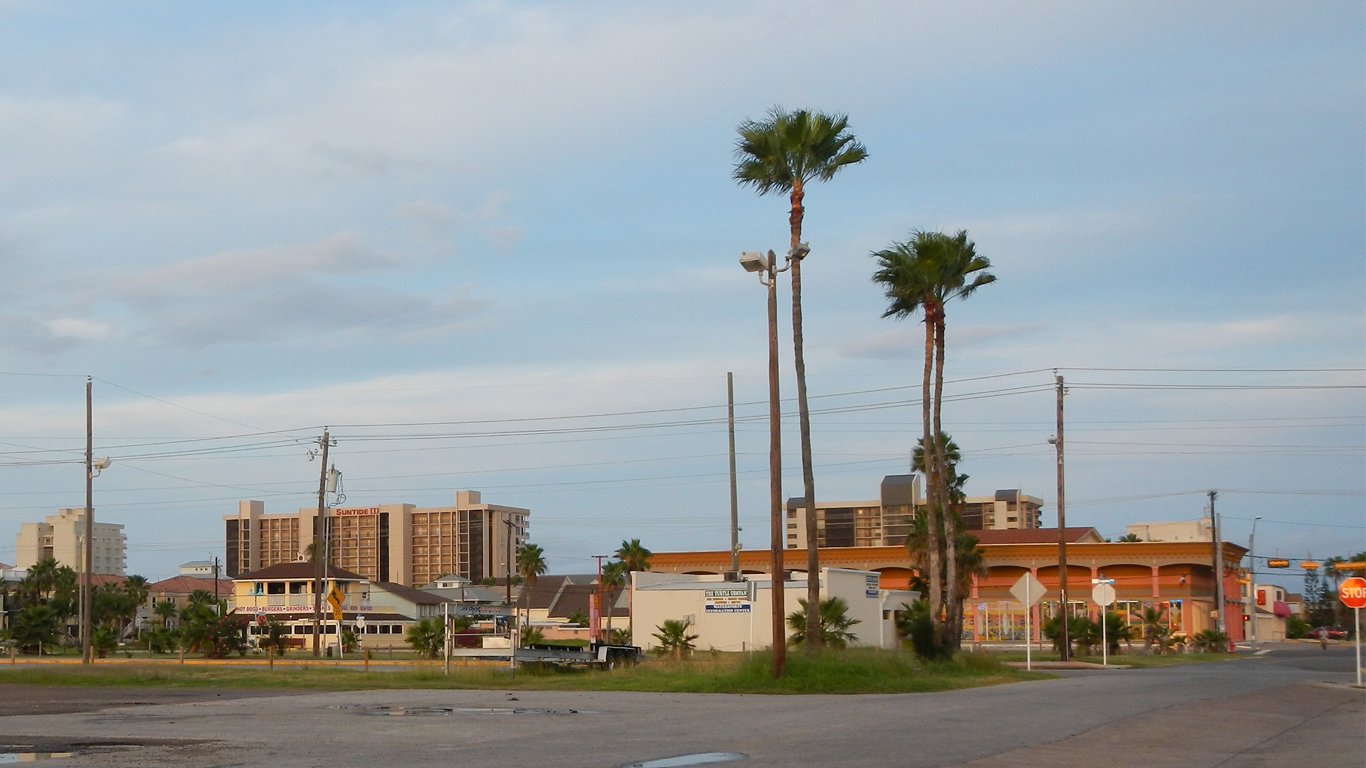
3. Brownsville-Harlingen, TX
> Households receiving SNAP benefits: 23.6%
> Poverty rate: 26.7% — 2nd highest of 384 metros
> Median household income: $41,200 — the lowest of 384 metros
> Unemployment rate: 5.6% — 140th highest of 384 metros

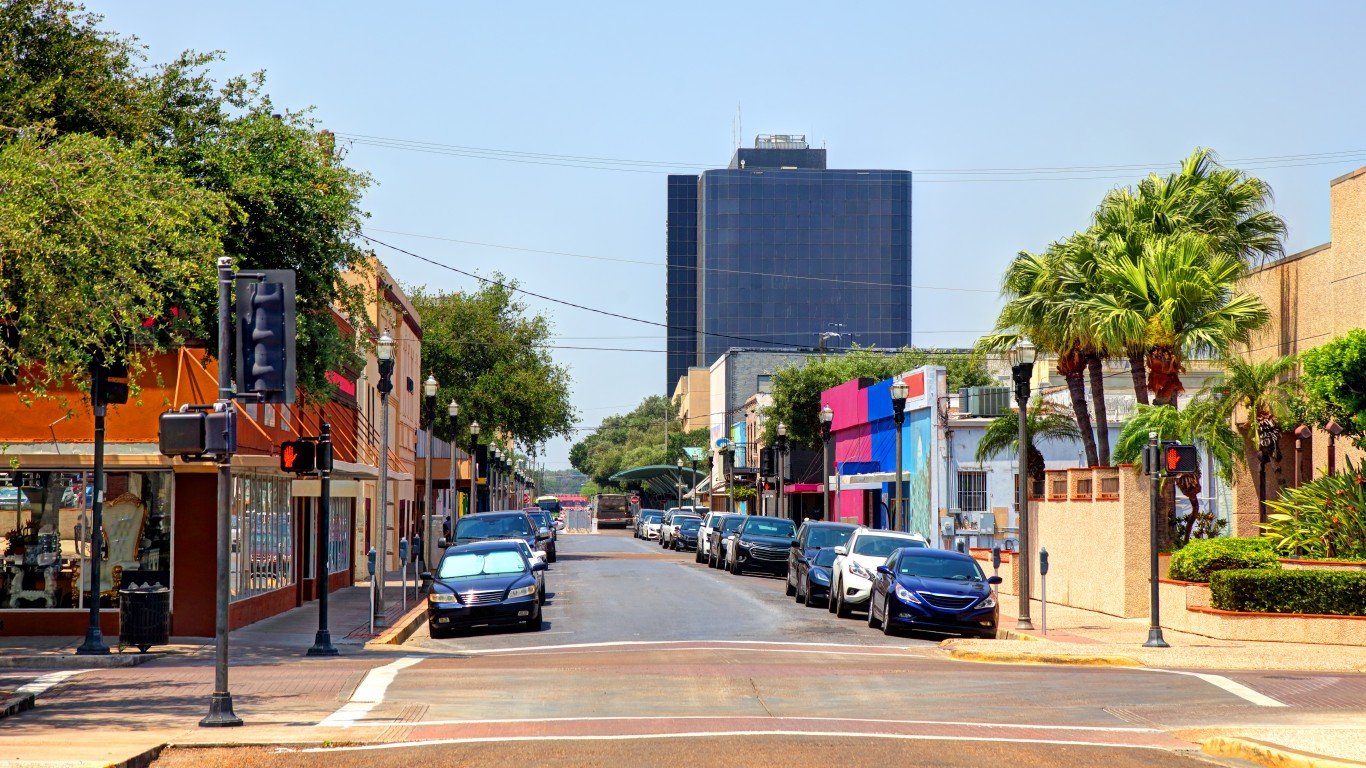
2. Laredo, TX
> Households receiving SNAP benefits: 24.6%
> Poverty rate: 24.6% — 4th highest of 384 metros
> Median household income: $50,296 — 65th lowest of 384 metros
> Unemployment rate: 5.7% — 135th highest of 384 metros
[in-text-ad-2]
1. McAllen-Edinburg-Mission, TX
> Households receiving SNAP benefits: 28.4%
> Poverty rate: 28.4% — the highest of 384 metros
> Median household income: $41,846 — 2nd lowest of 384 metros
> Unemployment rate: 7.3% — 32nd highest of 384 metros
Methodology
To determine the metros with the highest SNAP recipiency rates, 24/7 Wall St. reviewed five-year estimates of the share of households that received SNAP benefits in the past 12 months from the U.S. Census Bureau’s 2020 American Community Survey.
We used the 384 metropolitan statistical areas as delineated by the United States Office of Management and Budget and used by the Census Bureau as our definition of metros.
Metros were ranked based on the share of households that received SNAP benefits in the past 12 months as of 2020. To break ties, we used the number of households that received SNAP benefits in the past 12 months.
Additional information on poverty rate, median household income, and unemployment rate are also five-year estimates from the 2020 ACS. Because the Census Bureau didn’t release one-year estimates for 2020 due to data collection issues caused by the COVID-19 pandemic, all ACS data are five-year estimates.
Contact [email protected] for any questions or corrections.