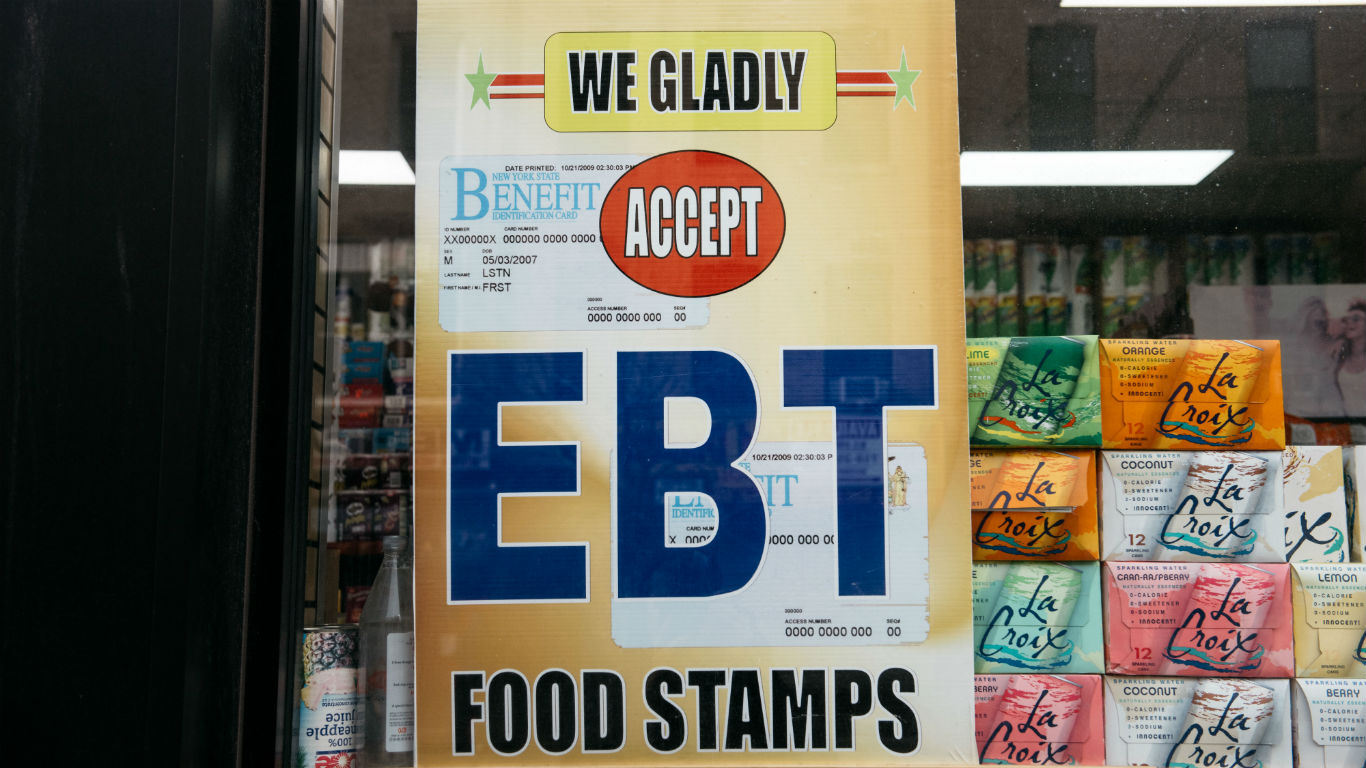
In June, California announced it would be sending $1,050 checks to approximately 23 million residents to combat the devastating effects inflation has had on state residents. Even if other U.S. states were to follow suit and issue their own so-called inflation relief checks, the checks likely would not be enough on their own for needy families. One long-standing program that millions of Americans rely on is the government’s food assistance benefits, the Supplemental Nutrition Assistance Program.
As of 2020, roughly 13.8 million U.S. households received SNAP benefits, formerly known as food stamps. To find the metro with the highest SNAP recipiency rate in every state, 24/7 Wall St. reviewed five-year estimates of the share of households that received SNAP benefits in the 12 months prior to the survey from the U.S. Census Bureau’s 2020 American Community Survey.
As of 2020, 11.4% of U.S. households received SNAP benefits. In most states, there is at least one major metro area where a higher share of households receive nutrition assistance. Among the metro areas in each state with the highest SNAP recipiency rate, that figure ranges from 6.7% to 28.4%.
In 13 states, the metropolitan area listed here has a SNAP recipiency rate below the U.S. rate. Many of these states have relatively few metro areas. This includes Alaska, Hawaii, South Dakota, and Wyoming, which have only two metropolitan areas each, and New Hampshire and Vermont, which have only one metro each, and the one listed here is by default only.
While factors such as assets and household composition impact whether a household qualifies for the benefit, SNAP recipiency is primarily determined by income. The majority of the metros with the highest SNAP recipiency rate in each state also have the highest poverty rate in their respective states. The McAllen, Texas, metropolitan area has a SNAP recipiency rate and a poverty rate of 28.4%, each the highest such figure of any metropolitan area in both Texas and the United States. These are the states where the most children live in Poverty.
Because income is the primary determinant for SNAP recipiency, unemployment is strongly linked to how many people receive benefits, as those workers who are out of a job are likely to have little to no income. Just over half of the metropolitan areas with the highest SNAP recipiency rate in their state also have the highest five-year unemployment rate in their state. This includes the El Centro, California, metro area, which has an unemployment rate of 13.6% and a SNAP recipiency rate of 23.6%. These are the states with the worst spikes in unemployment since the pandemic began.
Click here to see the city where the most people rely on food stamps in every state
Click here to see our detailed methodology

Alabama: Montgomery
> Households receiving SNAP benefits: 16.0% (Alabama: 13.4%)
> Poverty rate: 16.6% (Alabama: 16.0%)
> Median household income: $54,250 (Alabama: $52,035)
> Unemployment rate: 5.4% (Alabama: 5.5%)
> No. of metros considered in ranking: 12
[in-text-ad]

Alaska: Anchorage
> Households receiving SNAP benefits: 9.2% (Alaska: 10.3%)
> Poverty rate: 9.2% (Alaska: 10.3%)
> Median household income: $82,890 (Alaska: $77,790)
> Unemployment rate: 6.1% (Alaska: 6.8%)
> No. of metros considered in ranking: 2
[recirclink id=1112369]

Arizona: Yuma
> Households receiving SNAP benefits: 17.3% (Arizona: 10.5%)
> Poverty rate: 18.2% (Arizona: 14.1%)
> Median household income: $48,790 (Arizona: $61,529)
> Unemployment rate: 8.3% (Arizona: 5.8%)
> No. of metros considered in ranking: 7

Arkansas: Pine Bluff
> Households receiving SNAP benefits: 16.9% (Arkansas: 11.7%)
> Poverty rate: 20.0% (Arkansas: 16.1%)
> Median household income: $41,856 (Arkansas: $49,475)
> Unemployment rate: 7.4% (Arkansas: 5.2%)
> No. of metros considered in ranking: 6
[in-text-ad-2]

California: El Centro
> Households receiving SNAP benefits: 23.6% (California: 9.0%)
> Poverty rate: 22.5% (California: 12.6%)
> Median household income: $46,222 (California: $78,672)
> Unemployment rate: 13.6% (California: 6.1%)
> No. of metros considered in ranking: 26

Colorado: Pueblo
> Households receiving SNAP benefits: 18.5% (Colorado: 7.2%)
> Poverty rate: 17.6% (Colorado: 9.8%)
> Median household income: $49,979 (Colorado: $75,231)
> Unemployment rate: 6.9% (Colorado: 4.6%)
> No. of metros considered in ranking: 7
[in-text-ad]

Connecticut: New Haven-Milford
> Households receiving SNAP benefits: 14.2% (Connecticut: 11.6%)
> Poverty rate: 11.2% (Connecticut: 9.8%)
> Median household income: $71,370 (Connecticut: $79,855)
> Unemployment rate: 6.4% (Connecticut: 6.0%)
> No. of metros considered in ranking: 4
[recirclink id=1111559]

Delaware: Dover
> Households receiving SNAP benefits: 14.8% (Delaware: 10.6%)
> Poverty rate: 13.2% (Delaware: 11.4%)
> Median household income: $60,117 (Delaware: $69,110)
> Unemployment rate: 6.0% (Delaware: 5.8%)
> No. of metros considered in ranking: 1
*Because Dover is the only eligible metro in Delaware, it is the metro with the highest SNAP recipiency rate by default.

Florida: Miami-Fort Lauderdale-Pompano Beach
> Households receiving SNAP benefits: 16.7% (Florida: 13.2%)
> Poverty rate: 13.9% (Florida: 13.3%)
> Median household income: $59,030 (Florida: $57,703)
> Unemployment rate: 5.6% (Florida: 5.4%)
> No. of metros considered in ranking: 22
[in-text-ad-2]

Georgia: Albany
> Households receiving SNAP benefits: 21.3% (Georgia: 12.2%)
> Poverty rate: 23.3% (Georgia: 14.3%)
> Median household income: $46,323 (Georgia: $61,224)
> Unemployment rate: 8.4% (Georgia: 5.5%)
> No. of metros considered in ranking: 14

Hawaii: Urban Honolulu
> Households receiving SNAP benefits: 9.1% (Hawaii: 10.7%)
> Poverty rate: 8.4% (Hawaii: 9.3%)
> Median household income: $87,722 (Hawaii: $83,173)
> Unemployment rate: 3.8% (Hawaii: 4.3%)
> No. of metros considered in ranking: 2
[in-text-ad]

Idaho: Pocatello
> Households receiving SNAP benefits: 13.1% (Idaho: 9.0%)
> Poverty rate: 13.8% (Idaho: 11.9%)
> Median household income: $51,914 (Idaho: $58,915)
> Unemployment rate: 5.4% (Idaho: 4.2%)
> No. of metros considered in ranking: 6
[recirclink id=1047662]

Illinois: Decatur
> Households receiving SNAP benefits: 17.2% (Illinois: 12.4%)
> Poverty rate: 15.2% (Illinois: 12.0%)
> Median household income: $53,725 (Illinois: $68,428)
> Unemployment rate: 7.7% (Illinois: 5.9%)
> No. of metros considered in ranking: 10

Indiana: Muncie
> Households receiving SNAP benefits: 13.9% (Indiana: 9.3%)
> Poverty rate: 21.4% (Indiana: 12.9%)
> Median household income: $45,910 (Indiana: $58,235)
> Unemployment rate: 6.3% (Indiana: 4.7%)
> No. of metros considered in ranking: 12
[in-text-ad-2]

Iowa: Davenport-Moline-Rock Island
> Households receiving SNAP benefits: 11.6% (Iowa: 9.8%)
> Poverty rate: 12.6% (Iowa: 11.1%)
> Median household income: $59,876 (Iowa: $61,836)
> Unemployment rate: 4.7% (Iowa: 3.9%)
> No. of metros considered in ranking: 8

Kansas: Wichita
> Households receiving SNAP benefits: 9.4% (Kansas: 7.2%)
> Poverty rate: 12.7% (Kansas: 11.4%)
> Median household income: $58,333 (Kansas: $61,091)
> Unemployment rate: 5.0% (Kansas: 4.0%)
> No. of metros considered in ranking: 4
[in-text-ad]

Kentucky: Bowling Green
> Households receiving SNAP benefits: 12.1% (Kentucky: 13.0%)
> Poverty rate: 17.5% (Kentucky: 16.6%)
> Median household income: $51,591 (Kentucky: $52,238)
> Unemployment rate: 5.3% (Kentucky: 5.3%)
> No. of metros considered in ranking: 5
[recirclink id=1104870]

Louisiana: Hammond
> Households receiving SNAP benefits: 18.6% (Louisiana: 15.3%)
> Poverty rate: 20.2% (Louisiana: 18.6%)
> Median household income: $48,745 (Louisiana: $50,800)
> Unemployment rate: 7.1% (Louisiana: 6.5%)
> No. of metros considered in ranking: 9

Maine: Lewiston-Auburn
> Households receiving SNAP benefits: 17.3% (Maine: 12.6%)
> Poverty rate: 11.3% (Maine: 11.1%)
> Median household income: $55,002 (Maine: $59,489)
> Unemployment rate: 4.5% (Maine: 4.0%)
> No. of metros considered in ranking: 3
[in-text-ad-2]

Maryland: Cumberland
> Households receiving SNAP benefits: 18.6% (Maryland: 10.1%)
> Poverty rate: 14.9% (Maryland: 9.0%)
> Median household income: $50,188 (Maryland: $87,063)
> Unemployment rate: 7.4% (Maryland: 5.1%)
> No. of metros considered in ranking: 5

Massachusetts: Springfield
> Households receiving SNAP benefits: 17.8% (Massachusetts: 11.6%)
> Poverty rate: 14.1% (Massachusetts: 9.8%)
> Median household income: $61,360 (Massachusetts: $84,385)
> Unemployment rate: 6.0% (Massachusetts: 5.1%)
> No. of metros considered in ranking: 5
[in-text-ad]

Michigan: Flint
> Households receiving SNAP benefits: 19.6% (Michigan: 12.7%)
> Poverty rate: 18.0% (Michigan: 13.7%)
> Median household income: $50,269 (Michigan: $59,234)
> Unemployment rate: 8.9% (Michigan: 6.0%)
> No. of metros considered in ranking: 14
[recirclink id=1100321]

Minnesota: Duluth
> Households receiving SNAP benefits: 9.9% (Minnesota: 7.5%)
> Poverty rate: 12.9% (Minnesota: 9.3%)
> Median household income: $58,729 (Minnesota: $73,382)
> Unemployment rate: 4.7% (Minnesota: 3.8%)
> No. of metros considered in ranking: 5

Mississippi: Hattiesburg
> Households receiving SNAP benefits: 15.6% (Mississippi: 14.6%)
> Poverty rate: 22.1% (Mississippi: 19.6%)
> Median household income: $48,231 (Mississippi: $46,511)
> Unemployment rate: 7.8% (Mississippi: 7.1%)
> No. of metros considered in ranking: 3
[in-text-ad-2]

Missouri: Joplin
> Households receiving SNAP benefits: 13.6% (Missouri: 10.5%)
> Poverty rate: 16.4% (Missouri: 13.0%)
> Median household income: $50,244 (Missouri: $57,290)
> Unemployment rate: 4.9% (Missouri: 4.5%)
> No. of metros considered in ranking: 8

Montana: Great Falls
> Households receiving SNAP benefits: 11.2% (Montana: 9.3%)
> Poverty rate: 13.5% (Montana: 12.8%)
> Median household income: $52,049 (Montana: $56,539)
> Unemployment rate: 3.5% (Montana: 4.1%)
> No. of metros considered in ranking: 3
[in-text-ad]

Nebraska: Grand Island
> Households receiving SNAP benefits: 10.0% (Nebraska: 8.1%)
> Poverty rate: 10.9% (Nebraska: 10.4%)
> Median household income: $57,938 (Nebraska: $63,015)
> Unemployment rate: 3.7% (Nebraska: 3.4%)
> No. of metros considered in ranking: 3
[recirclink id=1112369]

Nevada: Las Vegas-Henderson-Paradise
> Households receiving SNAP benefits: 12.3% (Nevada: 11.6%)
> Poverty rate: 13.4% (Nevada: 12.8%)
> Median household income: $61,048 (Nevada: $62,043)
> Unemployment rate: 6.9% (Nevada: 6.5%)
> No. of metros considered in ranking: 3

New Hampshire: Manchester-Nashua
> Households receiving SNAP benefits: 6.8% (New Hampshire: 6.4%)
> Poverty rate: 7.4% (New Hampshire: 7.4%)
> Median household income: $82,099 (New Hampshire: $77,923)
> Unemployment rate: 4.0% (New Hampshire: 3.7%)
> No. of metros considered in ranking: 1
*Because Manchester-Nashua is the only eligible metro in New Hampshire, it is the metro with the highest SNAP recipiency rate by default.
[in-text-ad-2]

New Jersey: Vineland-Bridgeton
> Households receiving SNAP benefits: 15.6% (New Jersey: 8.4%)
> Poverty rate: 16.0% (New Jersey: 9.7%)
> Median household income: $55,709 (New Jersey: $85,245)
> Unemployment rate: 8.0% (New Jersey: 5.8%)
> No. of metros considered in ranking: 4

New Mexico: Las Cruces
> Households receiving SNAP benefits: 23.0% (New Mexico: 17.0%)
> Poverty rate: 24.8% (New Mexico: 18.6%)
> Median household income: $44,024 (New Mexico: $51,243)
> Unemployment rate: 7.6% (New Mexico: 6.5%)
> No. of metros considered in ranking: 4
[in-text-ad]

New York: Watertown-Fort Drum
> Households receiving SNAP benefits: 17.2% (New York: 14.3%)
> Poverty rate: 14.4% (New York: 13.6%)
> Median household income: $54,726 (New York: $71,117)
> Unemployment rate: 4.7% (New York: 5.7%)
> No. of metros considered in ranking: 13
[recirclink id=1111559]

North Carolina: Rocky Mount
> Households receiving SNAP benefits: 19.8% (North Carolina: 12.0%)
> Poverty rate: 18.1% (North Carolina: 14.0%)
> Median household income: $46,482 (North Carolina: $56,642)
> Unemployment rate: 7.8% (North Carolina: 5.3%)
> No. of metros considered in ranking: 15

North Dakota: Grand Forks
> Households receiving SNAP benefits: 8.4% (North Dakota: 6.6%)
> Poverty rate: 14.3% (North Dakota: 10.5%)
> Median household income: $55,122 (North Dakota: $65,315)
> Unemployment rate: 3.6% (North Dakota: 3.0%)
> No. of metros considered in ranking: 3
[in-text-ad-2]
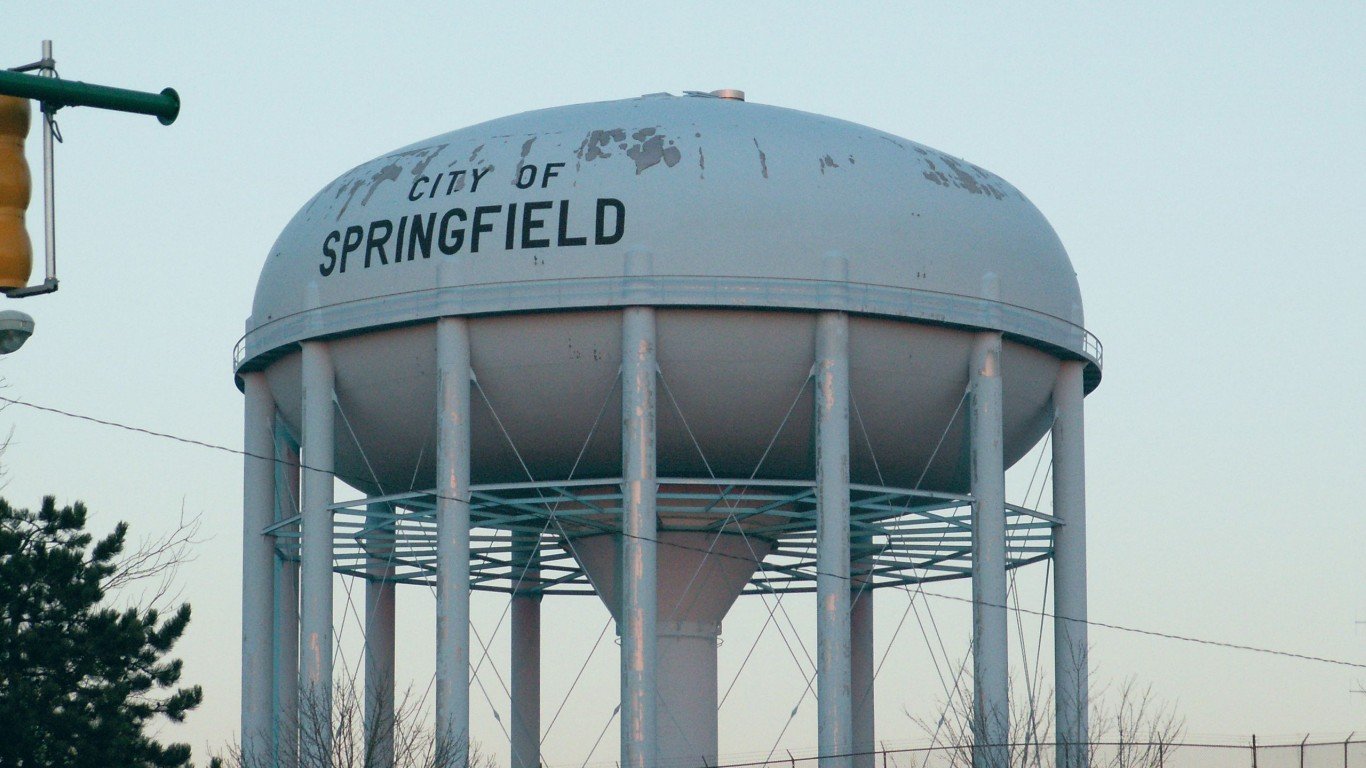
Ohio: Springfield
> Households receiving SNAP benefits: 17.5% (Ohio: 12.6%)
> Poverty rate: 15.3% (Ohio: 13.6%)
> Median household income: $51,504 (Ohio: $58,116)
> Unemployment rate: 6.8% (Ohio: 5.3%)
> No. of metros considered in ranking: 11

Oklahoma: Lawton
> Households receiving SNAP benefits: 15.3% (Oklahoma: 12.6%)
> Poverty rate: 16.0% (Oklahoma: 15.3%)
> Median household income: $52,219 (Oklahoma: $53,840)
> Unemployment rate: 5.8% (Oklahoma: 5.0%)
> No. of metros considered in ranking: 4
[in-text-ad]

Oregon: Grants Pass
> Households receiving SNAP benefits: 23.4% (Oregon: 15.0%)
> Poverty rate: 16.0% (Oregon: 12.4%)
> Median household income: $47,733 (Oregon: $65,667)
> Unemployment rate: 7.4% (Oregon: 5.4%)
> No. of metros considered in ranking: 8
[recirclink id=1047662]

Pennsylvania: Erie
> Households receiving SNAP benefits: 17.5% (Pennsylvania: 13.1%)
> Poverty rate: 15.5% (Pennsylvania: 12.0%)
> Median household income: $52,863 (Pennsylvania: $63,627)
> Unemployment rate: 5.4% (Pennsylvania: 5.3%)
> No. of metros considered in ranking: 18

Rhode Island: Providence-Warwick
> Households receiving SNAP benefits: 15.2% (Rhode Island: 14.8%)
> Poverty rate: 11.3% (Rhode Island: 11.6%)
> Median household income: $70,676 (Rhode Island: $70,305)
> Unemployment rate: 5.5% (Rhode Island: 5.5%)
> No. of metros considered in ranking: 1
*Because Providence-Warwick is the only eligible metro in Rhode Island, it is the metro with the highest SNAP recipiency rate by default.
[in-text-ad-2]

South Carolina: Sumter
> Households receiving SNAP benefits: 18.0% (South Carolina: 11.2%)
> Poverty rate: 19.0% (South Carolina: 14.7%)
> Median household income: $45,854 (South Carolina: $54,864)
> Unemployment rate: 8.7% (South Carolina: 5.5%)
> No. of metros considered in ranking: 8

South Dakota: Rapid City
> Households receiving SNAP benefits: 9.7% (South Dakota: 8.7%)
> Poverty rate: 12.5% (South Dakota: 12.8%)
> Median household income: $59,076 (South Dakota: $59,896)
> Unemployment rate: 3.6% (South Dakota: 3.5%)
> No. of metros considered in ranking: 2
[in-text-ad]

Tennessee: Jackson
> Households receiving SNAP benefits: 16.5% (Tennessee: 12.6%)
> Poverty rate: 17.6% (Tennessee: 14.6%)
> Median household income: $48,146 (Tennessee: $54,833)
> Unemployment rate: 6.3% (Tennessee: 5.3%)
> No. of metros considered in ranking: 10
[recirclink id=1104870]

Texas: McAllen-Edinburg-Mission
> Households receiving SNAP benefits: 28.4% (Texas: 11.5%)
> Poverty rate: 28.4% (Texas: 14.2%)
> Median household income: $41,846 (Texas: $63,826)
> Unemployment rate: 7.3% (Texas: 5.3%)
> No. of metros considered in ranking: 25

Utah: St. George
> Households receiving SNAP benefits: 6.7% (Utah: 6.2%)
> Poverty rate: 10.0% (Utah: 9.1%)
> Median household income: $61,747 (Utah: $74,197)
> Unemployment rate: 3.4% (Utah: 3.6%)
> No. of metros considered in ranking: 5
[in-text-ad-2]

Vermont: Burlington-South Burlington
> Households receiving SNAP benefits: 8.2% (Vermont: 10.6%)
> Poverty rate: 10.7% (Vermont: 10.8%)
> Median household income: $73,447 (Vermont: $63,477)
> Unemployment rate: 3.8% (Vermont: 3.8%)
> No. of metros considered in ranking: 1
*Because Burlington-South Burlington is the only eligible metro in Vermont, it is the metro with the highest SNAP recipiency rate by default.

Virginia: Roanoke
> Households receiving SNAP benefits: 10.2% (Virginia: 7.9%)
> Poverty rate: 12.5% (Virginia: 10.0%)
> Median household income: $57,642 (Virginia: $76,398)
> Unemployment rate: 4.6% (Virginia: 4.5%)
> No. of metros considered in ranking: 9
[in-text-ad]

Washington: Yakima
> Households receiving SNAP benefits: 21.5% (Washington: 11.1%)
> Poverty rate: 16.5% (Washington: 10.2%)
> Median household income: $54,917 (Washington: $77,006)
> Unemployment rate: 6.4% (Washington: 4.8%)
> No. of metros considered in ranking: 11
[recirclink id=1100321]

West Virginia: Beckley
> Households receiving SNAP benefits: 20.1% (West Virginia: 16.5%)
> Poverty rate: 21.0% (West Virginia: 17.1%)
> Median household income: $43,444 (West Virginia: $48,037)
> Unemployment rate: 7.0% (West Virginia: 6.5%)
> No. of metros considered in ranking: 7

Wisconsin: Racine
> Households receiving SNAP benefits: 14.2% (Wisconsin: 10.2%)
> Poverty rate: 12.3% (Wisconsin: 11.0%)
> Median household income: $62,556 (Wisconsin: $63,293)
> Unemployment rate: 4.0% (Wisconsin: 3.5%)
> No. of metros considered in ranking: 12
[in-text-ad-2]

Wyoming: Casper
> Households receiving SNAP benefits: 6.7% (Wyoming: 5.3%)
> Poverty rate: 9.6% (Wyoming: 10.8%)
> Median household income: $62,168 (Wyoming: $65,304)
> Unemployment rate: 4.3% (Wyoming: 4.3%)
> No. of metros considered in ranking: 2
Methodology
To determine the metro with the highest SNAP recipiency rate in every state, 24/7 Wall St. reviewed five-year estimates of the share of households that received SNAP benefits in the 12 months prior to the survey from the U.S. Census Bureau’s 2020 American Community Survey.
We used the 384 metropolitan statistical areas as delineated by the United States Office of Management and Budget and used by the Census Bureau as our definition of metros.
Metros were excluded if the SNAP recipiency rate was not available in the 2020 ACS, if there were fewer than 500 households, or if the sampling error associated with a metro’s data was deemed too high.
The sampling error was defined as too high if the coefficient of variation — a statistical assessment of how reliable an estimate is — for a metro’s SNAP recipiency rate was above 15% and greater than two standard deviations above the mean CV for all metros’ SNAP recipiency rates. We similarly excluded metros that had a sampling error too high for their population, using the same definition.
Metros were ranked based on the share of households that received SNAP benefits in the previous 12 months. To break ties, we used the number of households that received SNAP benefits in the previous 12 months.
Additional information on poverty rate, median household income, and unemployment rate are also five-year estimates from the 2020 ACS. Because the Census Bureau didn’t release one-year estimates for 2020 due to data collection issues caused by the COVID-19 pandemic, all ACS data are five-year estimates.
Contact [email protected] for any questions or corrections.