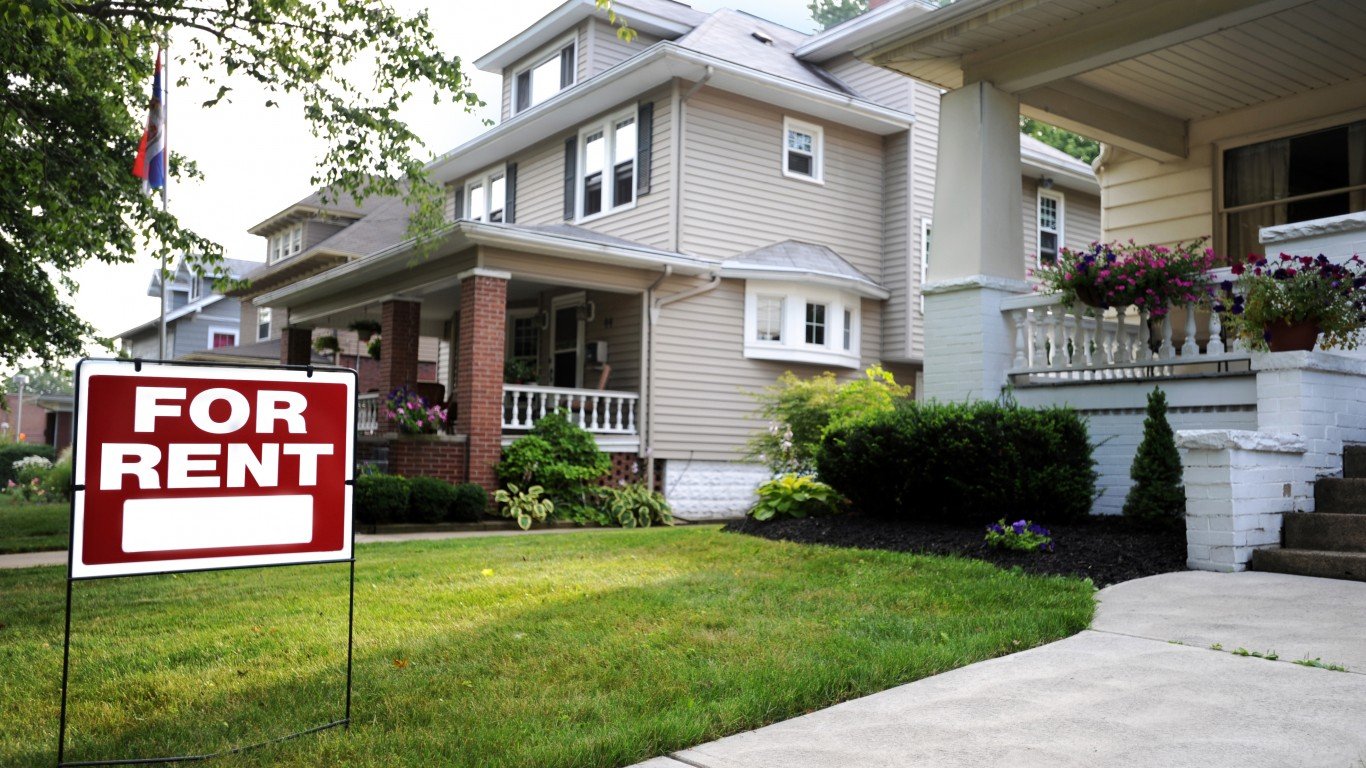
Median rents have hit record highs across the country, thanks to inflation and pandemic-related shortages of housing and building supplies. In many parts of the country, people who choose to rent may find it difficult to meet conventional wisdom’s rule that monthly rent should not exceed 30% of one’s monthly income. While rent prices are much more affordable in some parts of the country, in every state there is at least one ZIP code where rents are especially high.
To find the ZIP code with the highest rent in every state, 24/7 Wall St. reviewed five-year estimates of median gross rent of ZIP codes from the U.S. Census Bureau’s 2020 American Community Survey. It is important to note that the figures reflected here are for 2020, the most recent data available through the census. While prices today are much higher across much of the country, the most expensive rental market in each state in 2020 is likely still one of the most expensive markets in 2022. The national 2020 median rent was $1,096. In all 50 states, there is at least one ZIP code with a higher 2020 median gross rent.
Housing costs reflect the income levels of the population living there. Housing costs tend to be more expensive in wealthier communities. Of the 50 ZIP codes on this list, 47 have higher typical household incomes compared to their home state. The U.S. median household income is $64,996. In 36 of the 50 ZIP codes on this list, the typical household income is greater than $100,000. This includes Connecticut’s ZIP 06820, which encompasses the wealthy town of Darien, where median rent is over $3,000 per month and the typical annual household income comes to nearly a quarter of a million dollars. This is the richest town in every state.
Nationwide, 2020 median gross rent comes to 29.6% of household income. As a result of the higher incomes in the cities on this list, in 29 of the ZIP codes rent is actually relatively affordable. In ZIP 25405, on the outskirts of Martinsburg, West Virginia, median gross rent comes to just 18.8% of household income. Rents have risen considerably during the pandemic, so the affordability of many of these metro areas has likely decreased in the past two years. These are the U.S. cities where the most families need food stamps.
Click here to see the neighborhood with the highest rent in every state
Click here to see our detailed methodology

Alabama: 35763
> Location: Huntsville
> Median monthly rental cost: $1,484 (Alabama: $811)
> Share of income typically spent on rent: 19.5% (Alabama: 28.8%)
> Rental occupied housing units: 9.0% (Alabama: 30.8%)
> Median home value: $273,300 (Alabama: $149,600)
> No. of zip codes considered in ranking: 249
[in-text-ad]
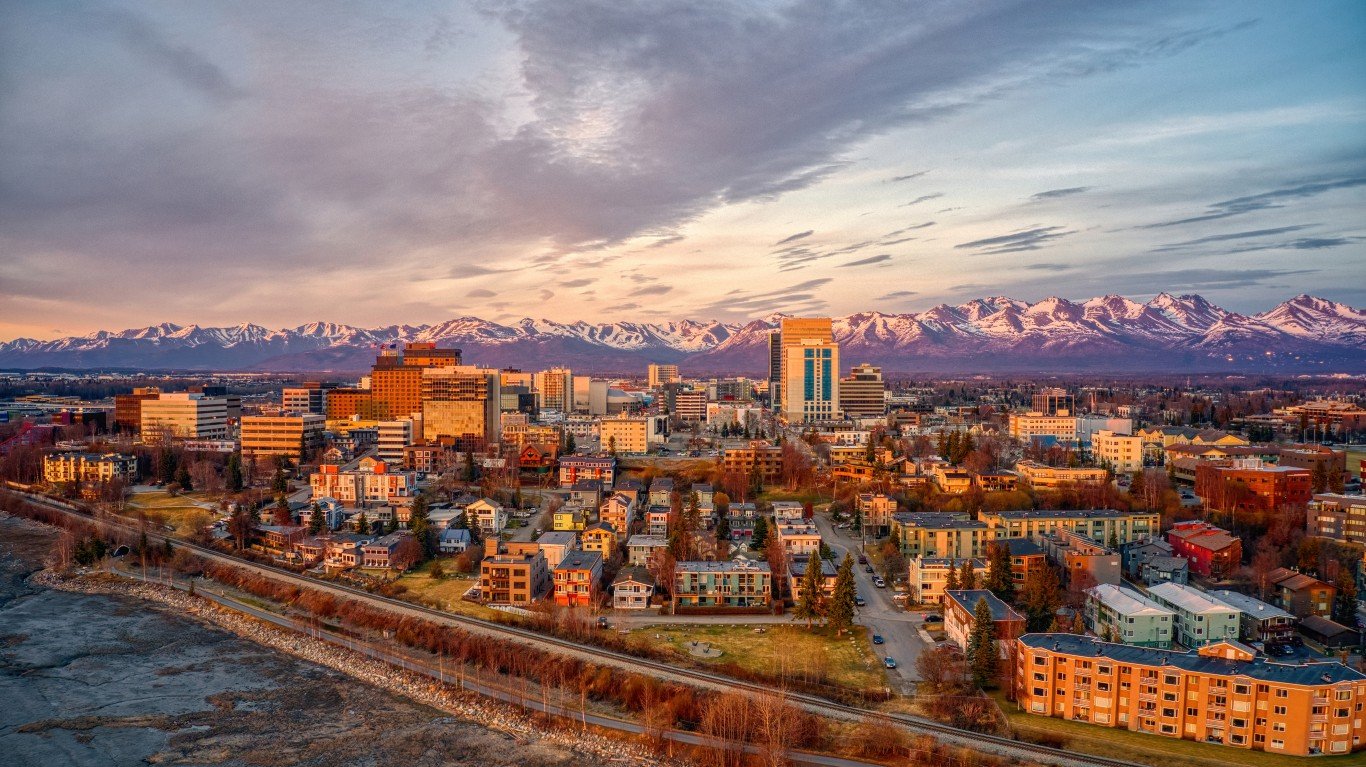
Alaska: 99505
> Location: Anchorage
> Median monthly rental cost: $2,265 (Alaska: $1,240)
> Share of income typically spent on rent: 37.6% (Alaska: 27.5%)
> Rental occupied housing units: 100.0% (Alaska: 35.2%)
> Median home value: N/A (Alaska: $275,600)
> No. of zip codes considered in ranking: 35
[recirclink id=1090849]
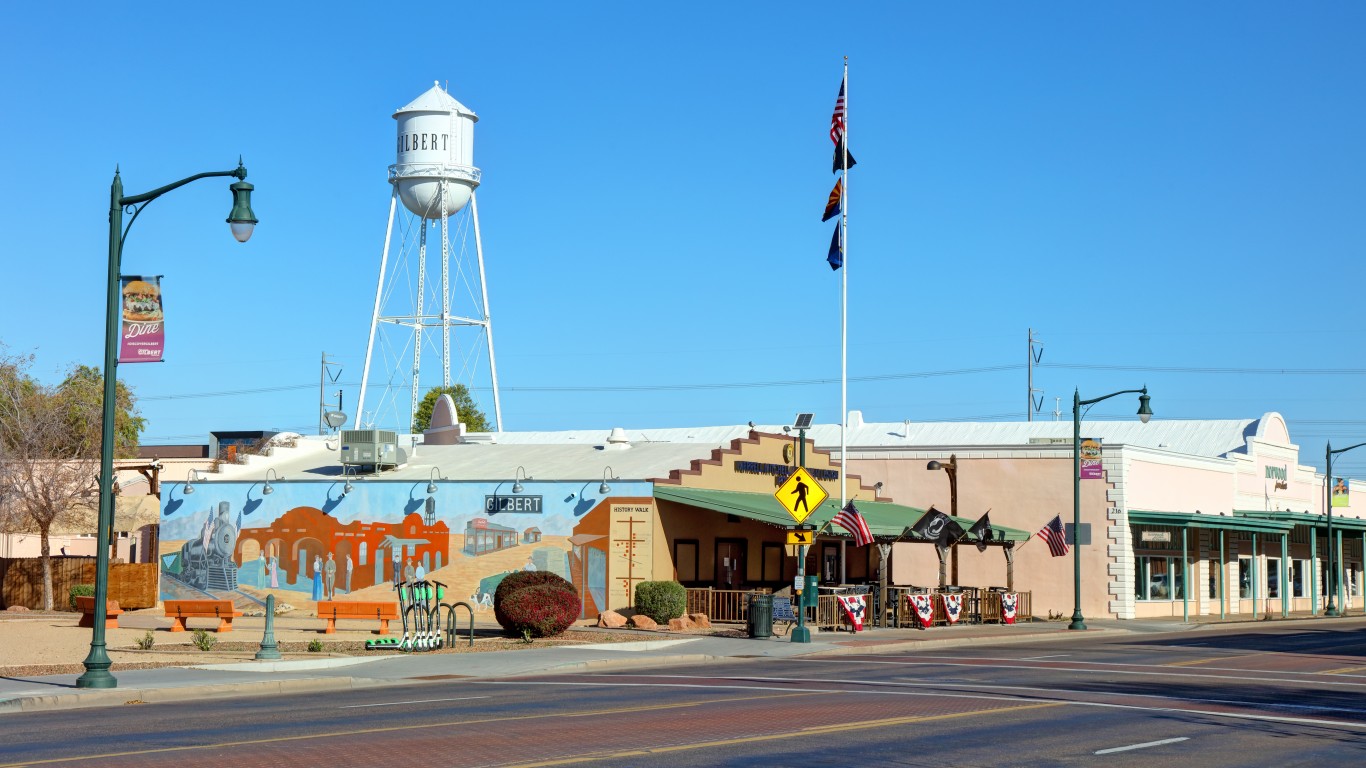
Arizona: 85298
> Location: Gilbert
> Median monthly rental cost: $2,202 (Arizona: $1,097)
> Share of income typically spent on rent: 23.7% (Arizona: 29.0%)
> Rental occupied housing units: 7.7% (Arizona: 34.7%)
> Median home value: $400,200 (Arizona: $242,000)
> No. of zip codes considered in ranking: 224

Arkansas: 72751
> Location: Pea Ridge
> Median monthly rental cost: $2,107 (Arkansas: $760)
> Share of income typically spent on rent: 27.3% (Arkansas: 27.2%)
> Rental occupied housing units: 47.7% (Arkansas: 34.2%)
> Median home value: $145,800 (Arkansas: $133,600)
> No. of zip codes considered in ranking: 139
[in-text-ad-2]

California: 90290
> Location: Topanga
> Median monthly rental cost: $3,500+ (California: $1,586)
> Share of income typically spent on rent: 35.2% (California: 32.2%)
> Rental occupied housing units: 29.2% (California: 44.7%)
> Median home value: $1,070,800 (California: $538,500)
> No. of zip codes considered in ranking: 1,131

Colorado: 80130
> Location: Highlands Ranch
> Median monthly rental cost: $2,155 (Colorado: $1,335)
> Share of income typically spent on rent: 24.5% (Colorado: 30.6%)
> Rental occupied housing units: 22.2% (Colorado: 33.8%)
> Median home value: $476,400 (Colorado: $369,900)
> No. of zip codes considered in ranking: 206
[in-text-ad]

Connecticut: 06820
> Location: Darien
> Median monthly rental cost: $3,052 (Connecticut: $1,201)
> Share of income typically spent on rent: 35.0% (Connecticut: 30.8%)
> Rental occupied housing units: 14.3% (Connecticut: 33.9%)
> Median home value: $1,465,800 (Connecticut: $279,700)
> No. of zip codes considered in ranking: 154
[recirclink id=1090988]
Delaware: 19707
> Location: Hockessin
> Median monthly rental cost: $1,842 (Delaware: $1,150)
> Share of income typically spent on rent: 38.3% (Delaware: 29.7%)
> Rental occupied housing units: 11.0% (Delaware: 28.6%)
> Median home value: $444,400 (Delaware: $258,300)
> No. of zip codes considered in ranking: 37
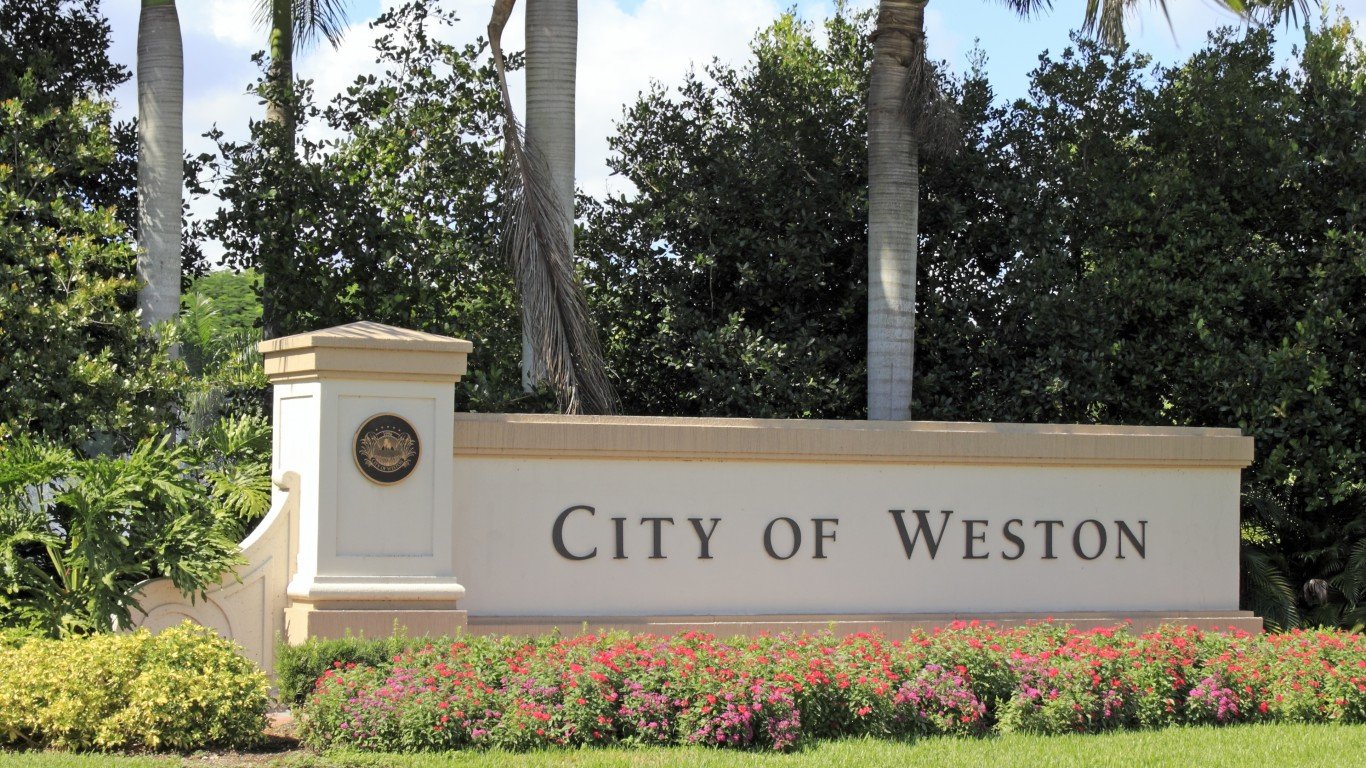
Florida: 33327
> Location: Weston
> Median monthly rental cost: $2,647 (Florida: $1,218)
> Share of income typically spent on rent: 40.6% (Florida: 33.3%)
> Rental occupied housing units: 23.1% (Florida: 33.8%)
> Median home value: $580,000 (Florida: $232,000)
> No. of zip codes considered in ranking: 747
[in-text-ad-2]

Georgia: 30326
> Location: Atlanta
> Median monthly rental cost: $1,852 (Georgia: $1,042)
> Share of income typically spent on rent: 28.3% (Georgia: 29.6%)
> Rental occupied housing units: 64.7% (Georgia: 36.0%)
> Median home value: $435,800 (Georgia: $190,200)
> No. of zip codes considered in ranking: 385

Hawaii: 96818
> Location: Urban Honolulu
> Median monthly rental cost: $2,899 (Hawaii: $1,651)
> Share of income typically spent on rent: 44.2% (Hawaii: 32.5%)
> Rental occupied housing units: 64.5% (Hawaii: 39.7%)
> Median home value: $568,200 (Hawaii: $636,400)
> No. of zip codes considered in ranking: 44
[in-text-ad]

Idaho: 83716
> Location: Boise City
> Median monthly rental cost: $1,396 (Idaho: $887)
> Share of income typically spent on rent: 22.1% (Idaho: 27.9%)
> Rental occupied housing units: 22.3% (Idaho: 29.2%)
> Median home value: $355,600 (Idaho: $235,600)
> No. of zip codes considered in ranking: 67
[recirclink id=1094298]
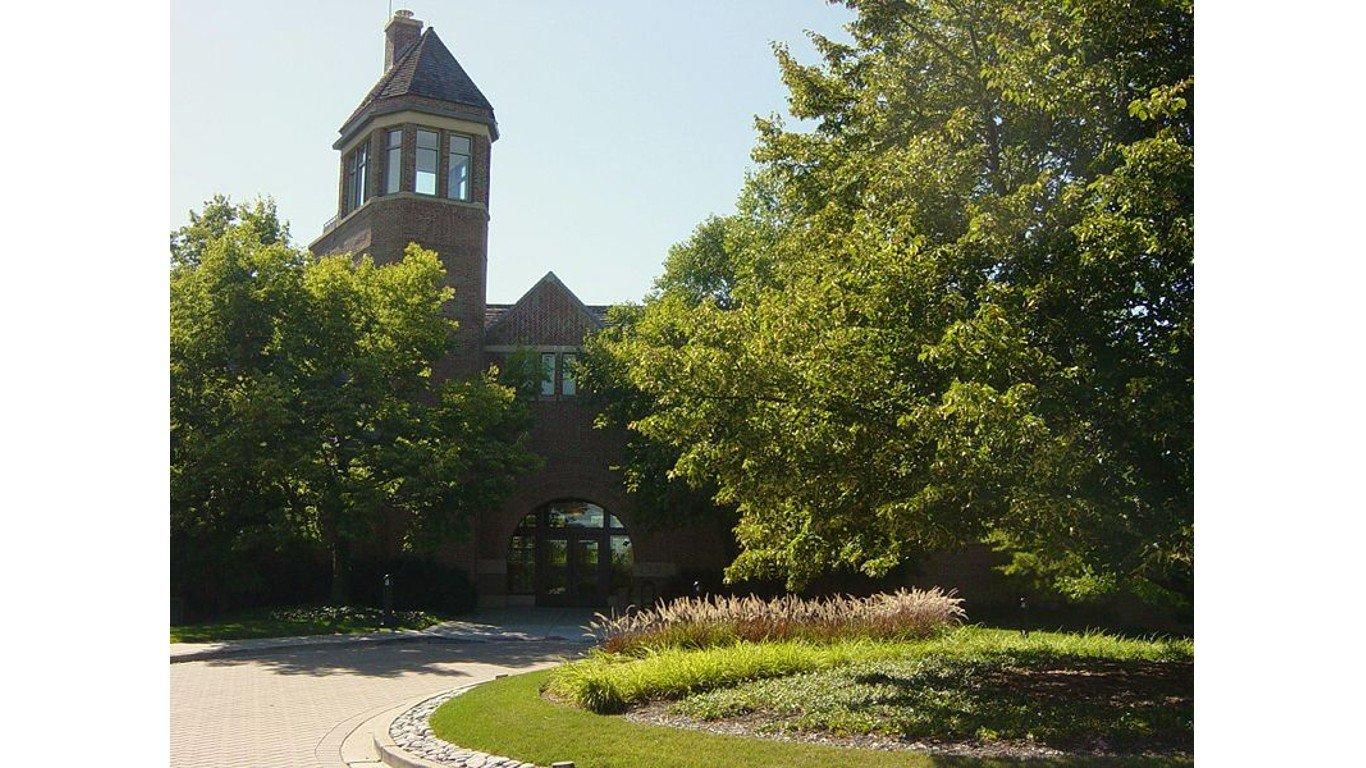
Illinois: 60069
> Location: Lincolnshire
> Median monthly rental cost: $2,725 (Illinois: $1,038)
> Share of income typically spent on rent: 50.0%+ (Illinois: 28.7%)
> Rental occupied housing units: 17.0% (Illinois: 33.7%)
> Median home value: $503,500 (Illinois: $202,100)
> No. of zip codes considered in ranking: 450
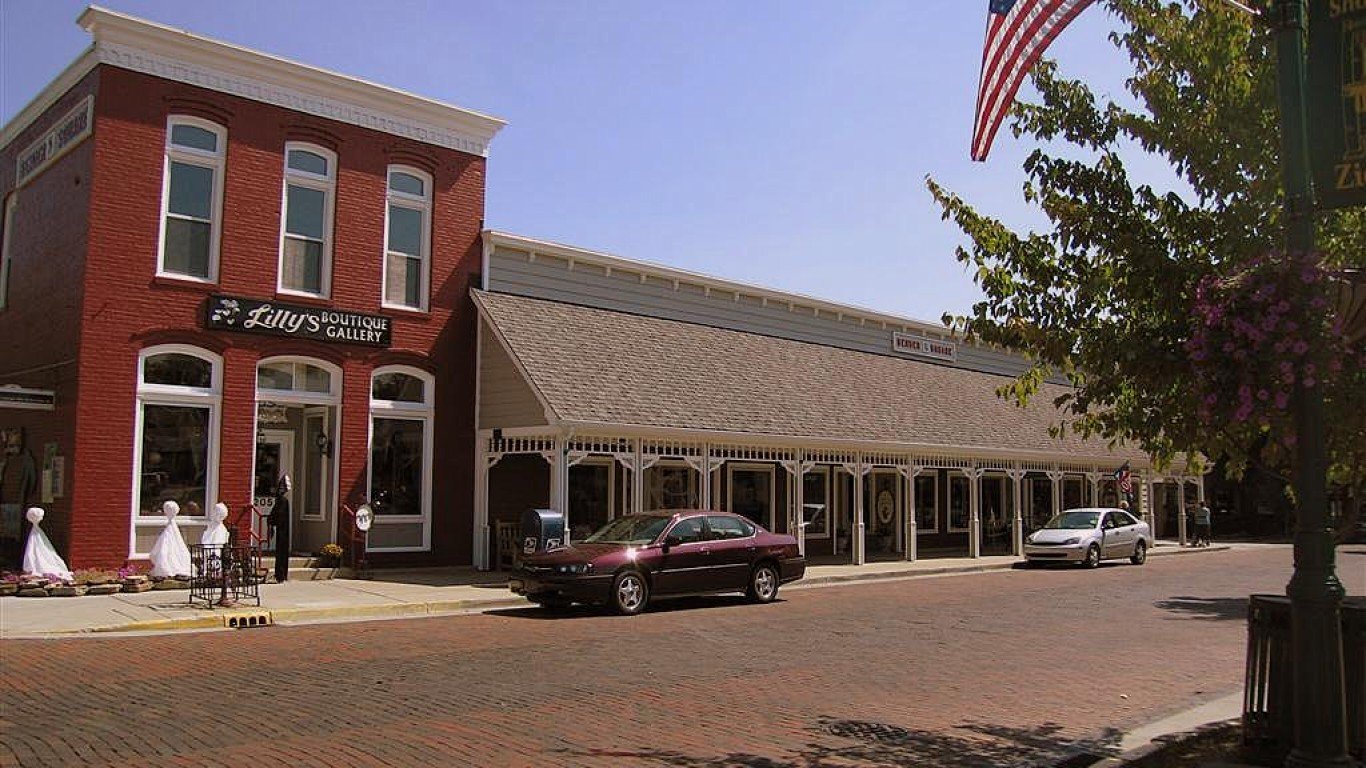
Indiana: 46077
> Location: Zionsville
> Median monthly rental cost: $1,427 (Indiana: $844)
> Share of income typically spent on rent: 25.5% (Indiana: 28.3%)
> Rental occupied housing units: 15.5% (Indiana: 30.5%)
> Median home value: $403,400 (Indiana: $148,900)
> No. of zip codes considered in ranking: 262
[in-text-ad-2]
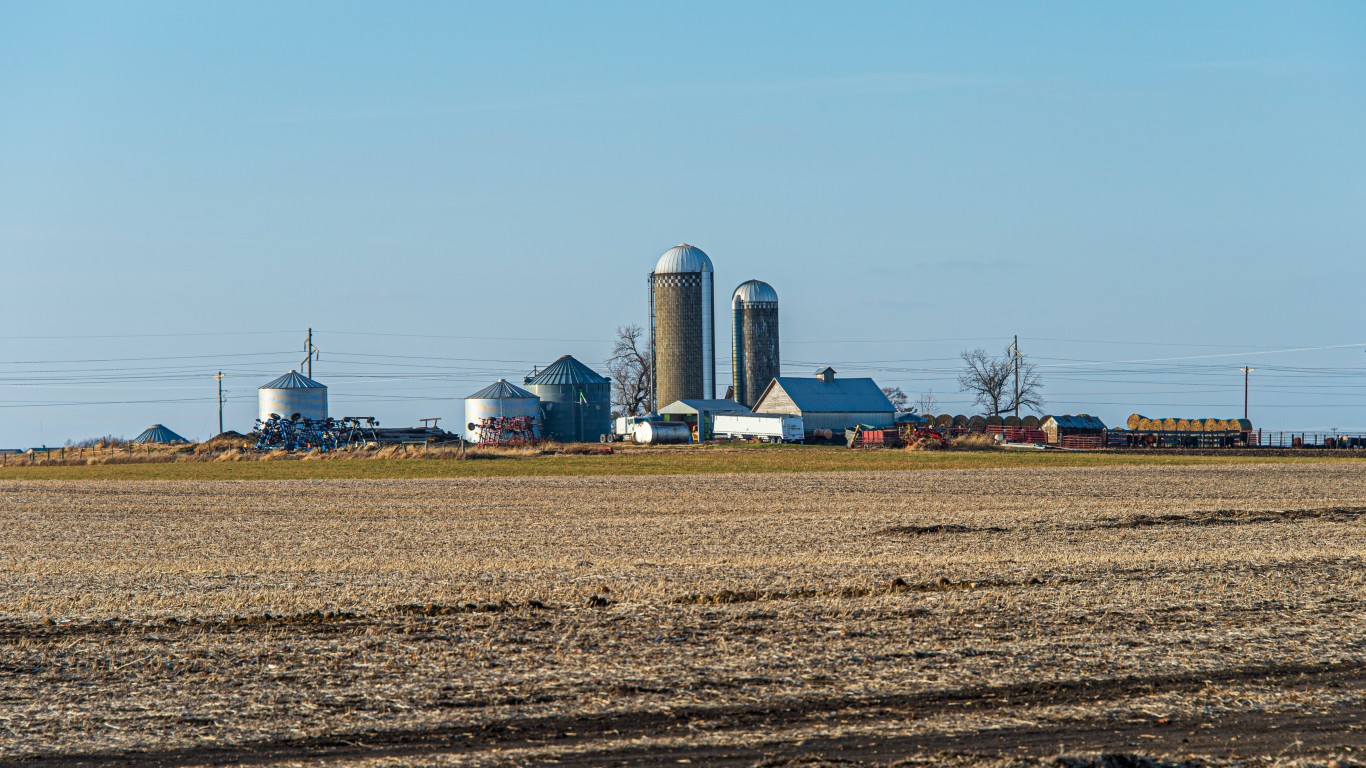
Iowa: 50021
> Location: Ankeny
> Median monthly rental cost: $1,191 (Iowa: $806)
> Share of income typically spent on rent: 24.6% (Iowa: 26.7%)
> Rental occupied housing units: 24.9% (Iowa: 28.8%)
> Median home value: $237,100 (Iowa: $153,900)
> No. of zip codes considered in ranking: 135

Kansas: 66206
> Location: Leawood
> Median monthly rental cost: $2,193 (Kansas: $863)
> Share of income typically spent on rent: 30.3% (Kansas: 27.0%)
> Rental occupied housing units: 11.3% (Kansas: 33.8%)
> Median home value: $444,000 (Kansas: $157,600)
> No. of zip codes considered in ranking: 141
[in-text-ad]

Kentucky: 40059
> Location: Prospect
> Median monthly rental cost: $1,564 (Kentucky: $783)
> Share of income typically spent on rent: 31.0% (Kentucky: 27.1%)
> Rental occupied housing units: 7.8% (Kentucky: 32.4%)
> Median home value: $450,200 (Kentucky: $147,100)
> No. of zip codes considered in ranking: 195
[recirclink id=1101677]
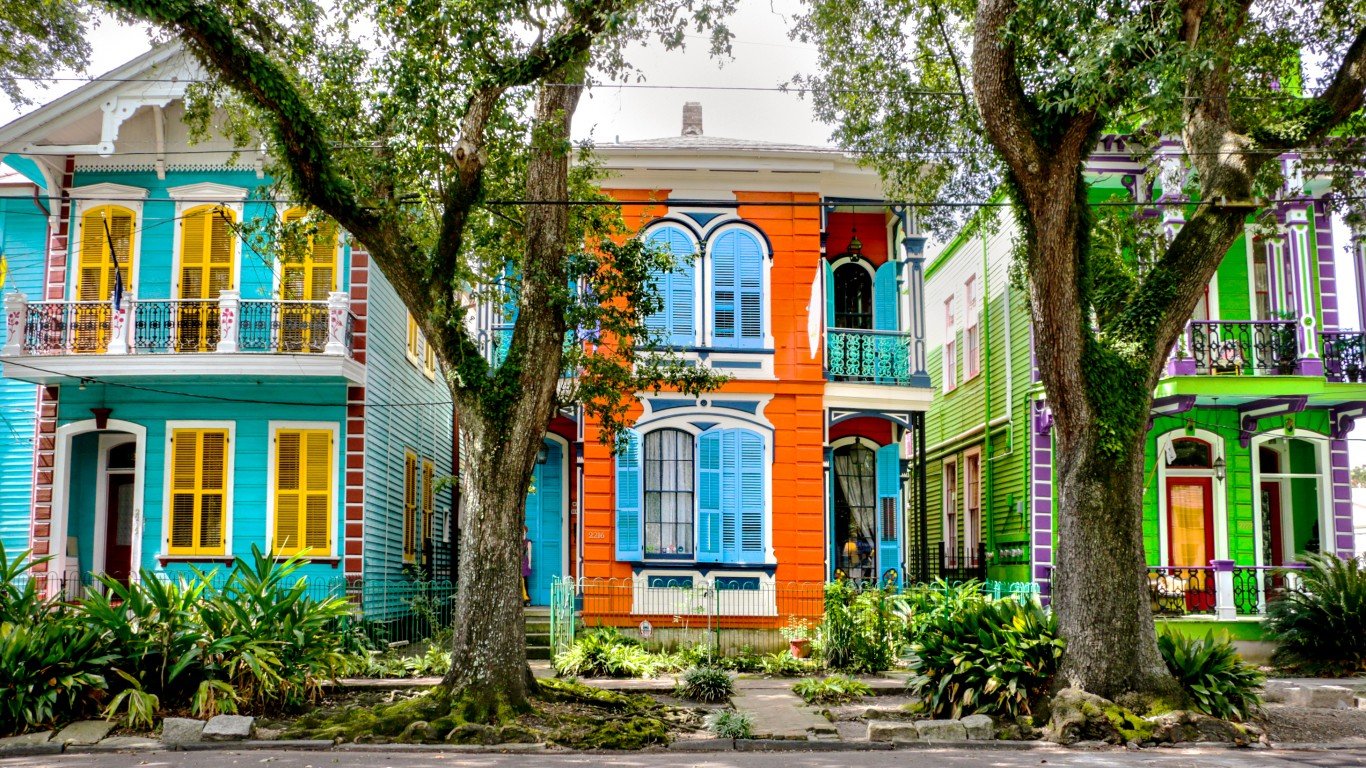
Louisiana: 70124
> Location: New Orleans
> Median monthly rental cost: $1,471 (Louisiana: $876)
> Share of income typically spent on rent: 24.2% (Louisiana: 32.3%)
> Rental occupied housing units: 28.4% (Louisiana: 33.4%)
> Median home value: $460,000 (Louisiana: $168,100)
> No. of zip codes considered in ranking: 205
Maine: 04105
> Location: Falmouth
> Median monthly rental cost: $1,581 (Maine: $873)
> Share of income typically spent on rent: 29.9% (Maine: 28.6%)
> Rental occupied housing units: 15.0% (Maine: 27.1%)
> Median home value: $463,000 (Maine: $198,000)
> No. of zip codes considered in ranking: 61
[in-text-ad-2]
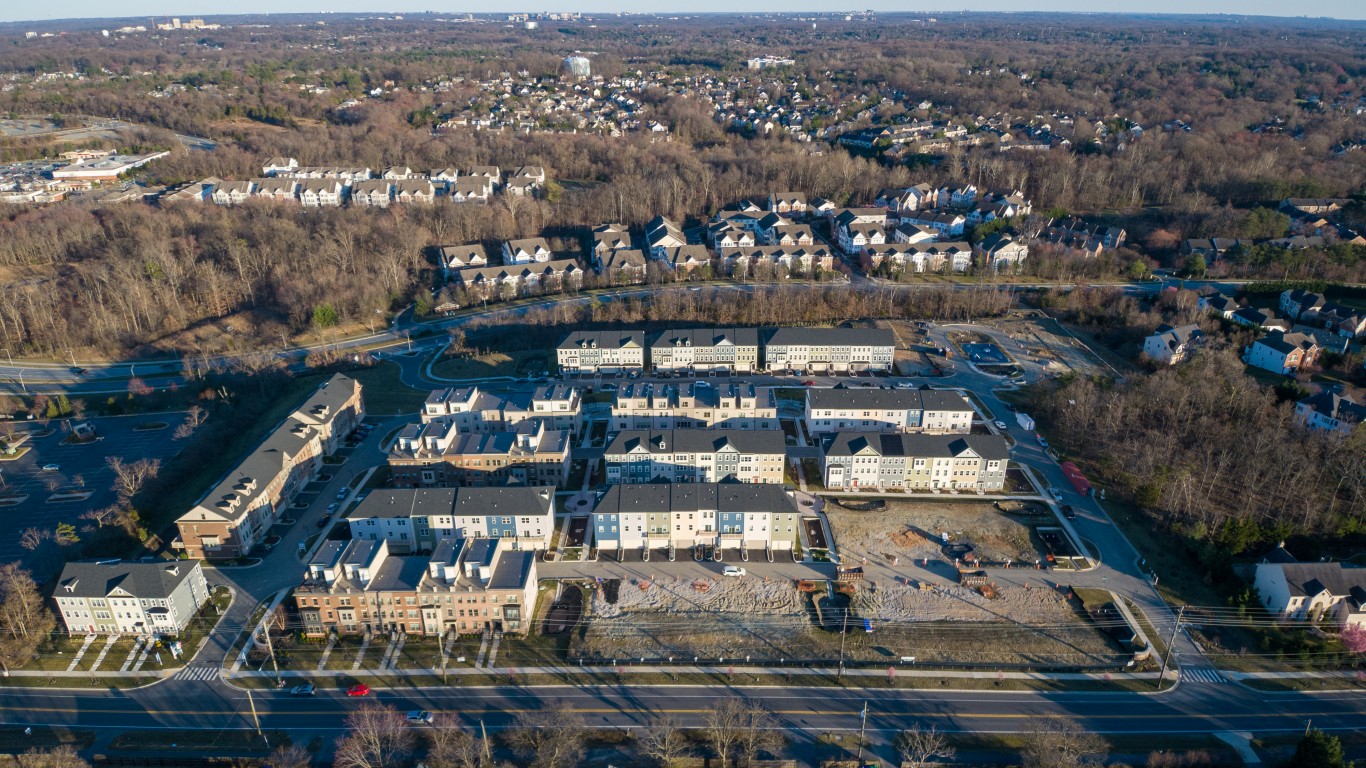
Maryland: 20854
> Location: Potomac
> Median monthly rental cost: $2,556 (Maryland: $1,415)
> Share of income typically spent on rent: 23.4% (Maryland: 29.7%)
> Rental occupied housing units: 9.5% (Maryland: 32.9%)
> Median home value: $923,600 (Maryland: $325,400)
> No. of zip codes considered in ranking: 193

Massachusetts: 02142
> Location: Cambridge
> Median monthly rental cost: $3,241 (Massachusetts: $1,336)
> Share of income typically spent on rent: 24.3% (Massachusetts: 29.6%)
> Rental occupied housing units: 85.3% (Massachusetts: 37.5%)
> Median home value: $948,500 (Massachusetts: $398,800)
> No. of zip codes considered in ranking: 301
[in-text-ad]
Michigan: 48374
> Location: Novi
> Median monthly rental cost: $1,750 (Michigan: $892)
> Share of income typically spent on rent: 24.9% (Michigan: 29.3%)
> Rental occupied housing units: 12.0% (Michigan: 28.3%)
> Median home value: $461,900 (Michigan: $162,600)
> No. of zip codes considered in ranking: 377
[recirclink id=1102674]

Minnesota: 55415
> Location: Minneapolis
> Median monthly rental cost: $1,786 (Minnesota: $1,010)
> Share of income typically spent on rent: 22.2% (Minnesota: 28.2%)
> Rental occupied housing units: 73.0% (Minnesota: 28.1%)
> Median home value: $468,900 (Minnesota: $235,700)
> No. of zip codes considered in ranking: 214

Mississippi: 39110
> Location: Madison
> Median monthly rental cost: $1,570 (Mississippi: $789)
> Share of income typically spent on rent: 31.2% (Mississippi: 29.6%)
> Rental occupied housing units: 4.8% (Mississippi: 31.2%)
> Median home value: $264,100 (Mississippi: $125,500)
> No. of zip codes considered in ranking: 150
[in-text-ad-2]

Missouri: 63127
> Location: Sunset Hills
> Median monthly rental cost: $2,429 (Missouri: $843)
> Share of income typically spent on rent: 44.4% (Missouri: 27.6%)
> Rental occupied housing units: 24.8% (Missouri: 32.9%)
> Median home value: $466,900 (Missouri: $163,600)
> No. of zip codes considered in ranking: 281
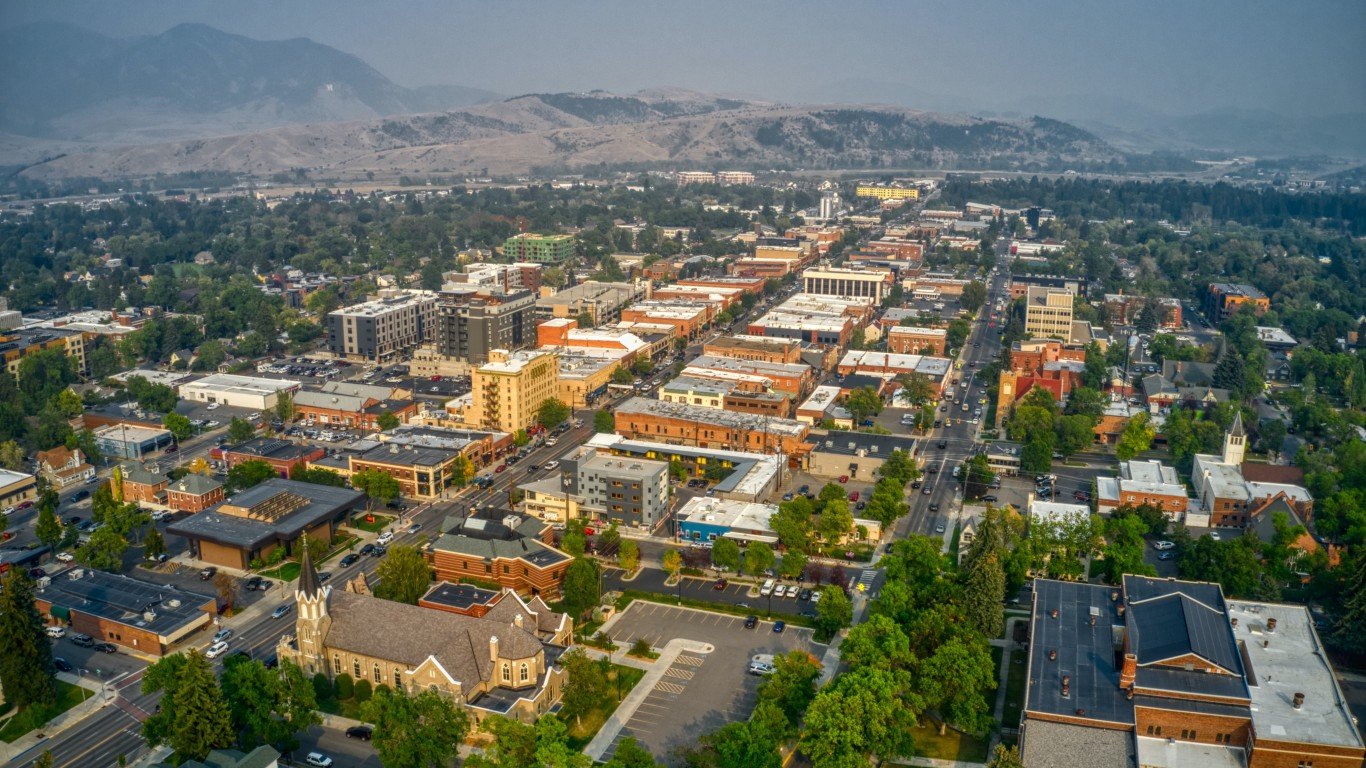
Montana: 59718
> Location: Bozeman
> Median monthly rental cost: $1,272 (Montana: $836)
> Share of income typically spent on rent: 29.5% (Montana: 27.7%)
> Rental occupied housing units: 41.7% (Montana: 31.5%)
> Median home value: $381,400 (Montana: $244,900)
> No. of zip codes considered in ranking: 48
[in-text-ad]

Nebraska: 68118
> Location: Omaha
> Median monthly rental cost: $1,448 (Nebraska: $857)
> Share of income typically spent on rent: 35.1% (Nebraska: 26.3%)
> Rental occupied housing units: 16.2% (Nebraska: 33.8%)
> Median home value: $283,500 (Nebraska: $164,000)
> No. of zip codes considered in ranking: 90
[recirclink id=1090849]
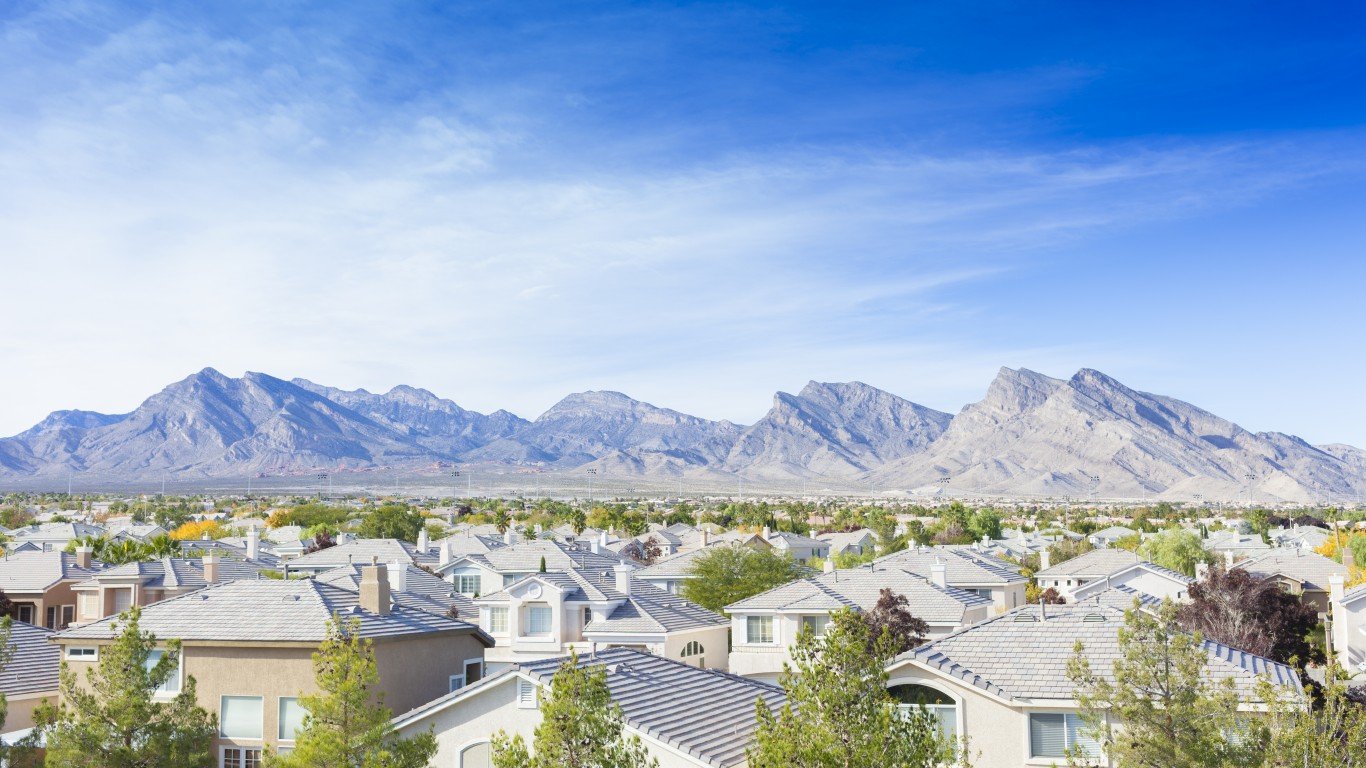
Nevada: 89135
> Location: Summerlin South
> Median monthly rental cost: $1,949 (Nevada: $1,159)
> Share of income typically spent on rent: 26.5% (Nevada: 30.0%)
> Rental occupied housing units: 29.9% (Nevada: 42.9%)
> Median home value: $453,600 (Nevada: $290,200)
> No. of zip codes considered in ranking: 95
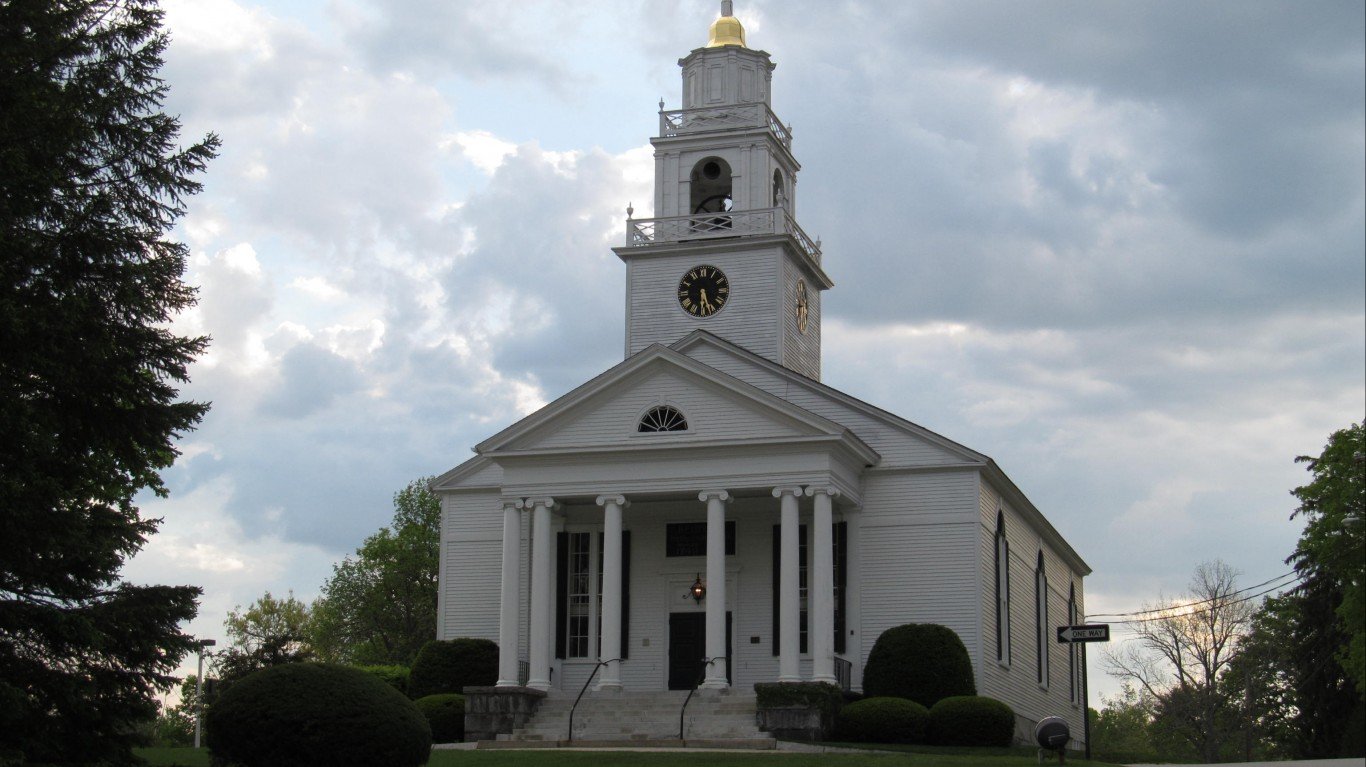
New Hampshire: 03110
> Location: Bedford
> Median monthly rental cost: $1,705 (New Hampshire: $1,145)
> Share of income typically spent on rent: 28.6% (New Hampshire: 28.6%)
> Rental occupied housing units: 14.5% (New Hampshire: 28.8%)
> Median home value: $437,300 (New Hampshire: $272,300)
> No. of zip codes considered in ranking: 58
[in-text-ad-2]
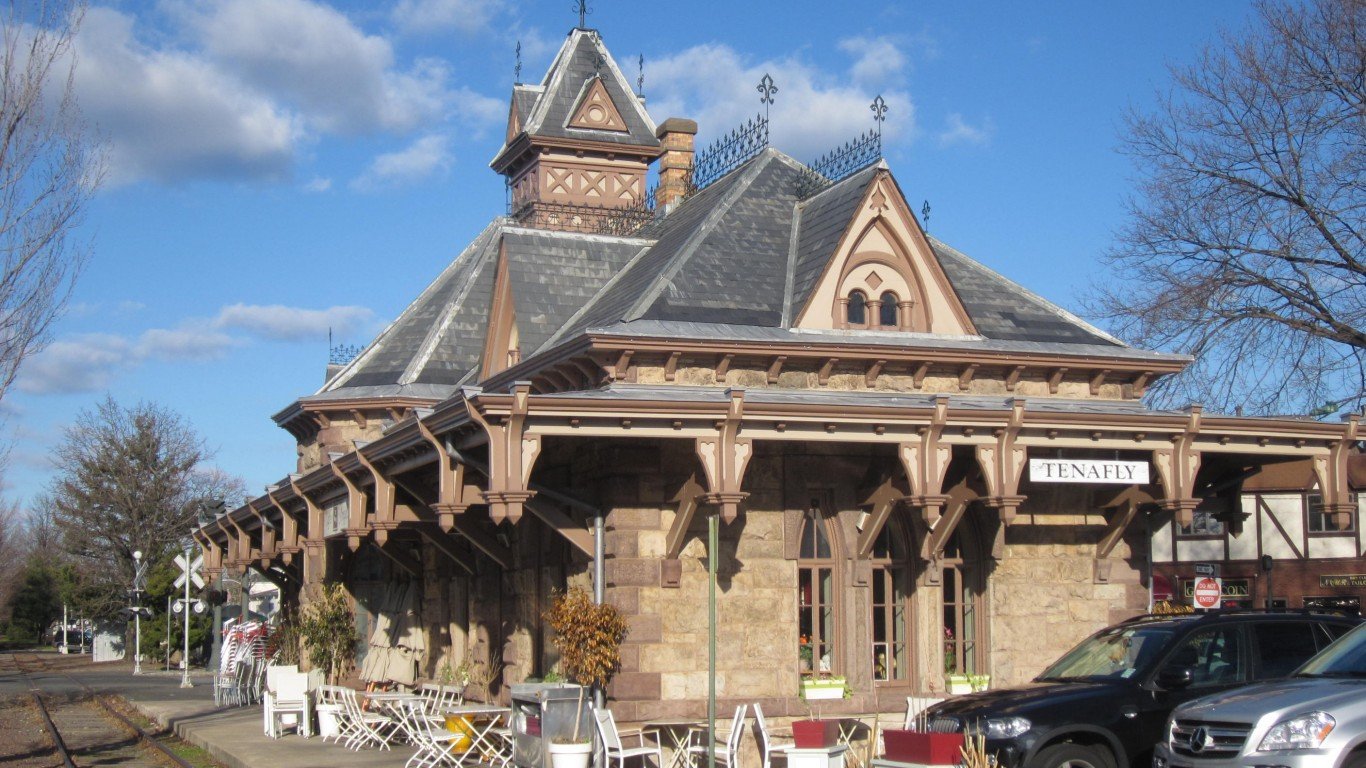
New Jersey: 07670
> Location: Tenafly
> Median monthly rental cost: $3,073 (New Jersey: $1,368)
> Share of income typically spent on rent: 26.3% (New Jersey: 30.3%)
> Rental occupied housing units: 21.3% (New Jersey: 36.0%)
> Median home value: $848,600 (New Jersey: $343,500)
> No. of zip codes considered in ranking: 354

New Mexico: 87116
> Location: Albuquerque
> Median monthly rental cost: $1,375 (New Mexico: $857)
> Share of income typically spent on rent: 26.2% (New Mexico: 29.3%)
> Rental occupied housing units: 96.8% (New Mexico: 32.0%)
> Median home value: N/A (New Mexico: $175,700)
> No. of zip codes considered in ranking: 69
[in-text-ad]

New York: 10005
> Location: New York
> Median monthly rental cost: $3,500+ (New York: $1,315)
> Share of income typically spent on rent: 22.8% (New York: 30.8%)
> Rental occupied housing units: 84.2% (New York: 45.9%)
> Median home value: $1,159,600 (New York: $325,000)
> No. of zip codes considered in ranking: 663
[recirclink id=1090988]
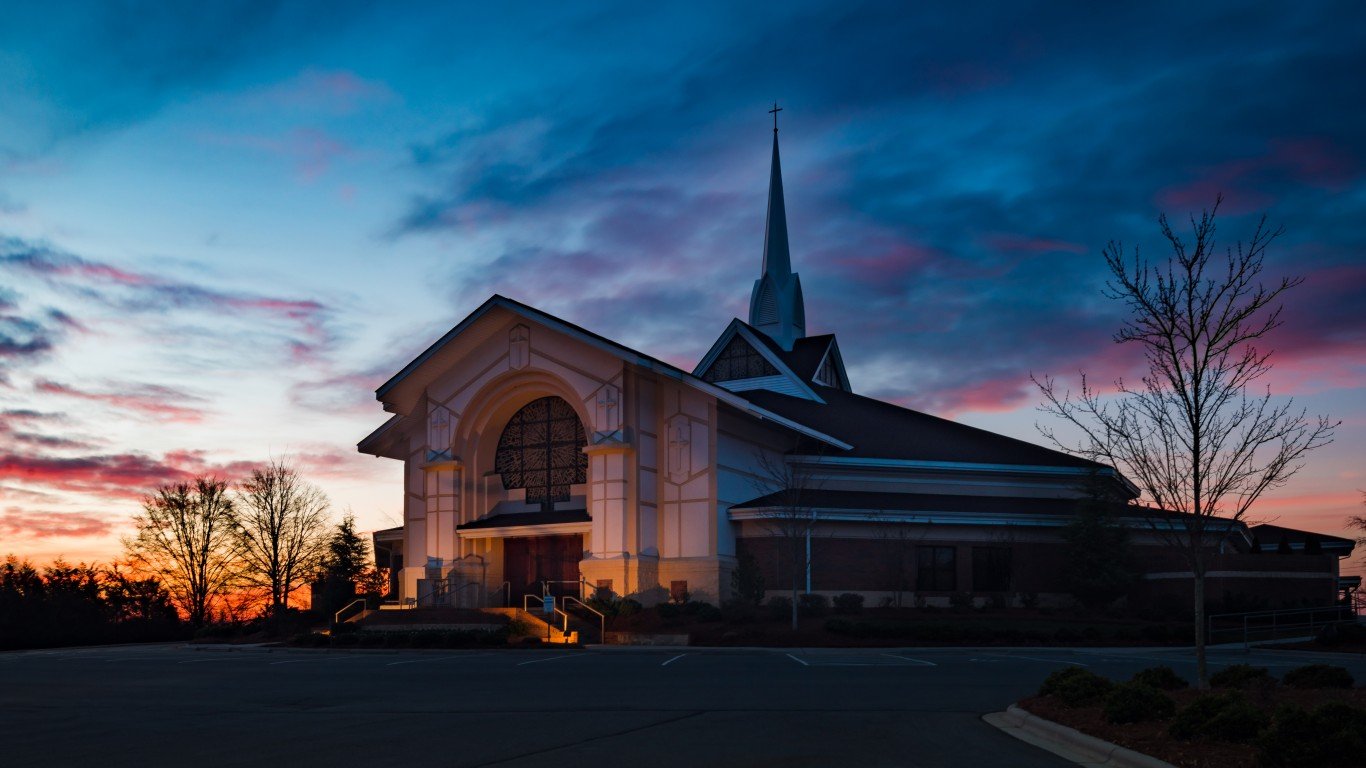
North Carolina: 28075
> Location: Harrisburg
> Median monthly rental cost: $1,686 (North Carolina: $932)
> Share of income typically spent on rent: 21.8% (North Carolina: 28.6%)
> Rental occupied housing units: 10.1% (North Carolina: 34.3%)
> Median home value: $307,500 (North Carolina: $182,100)
> No. of zip codes considered in ranking: 417
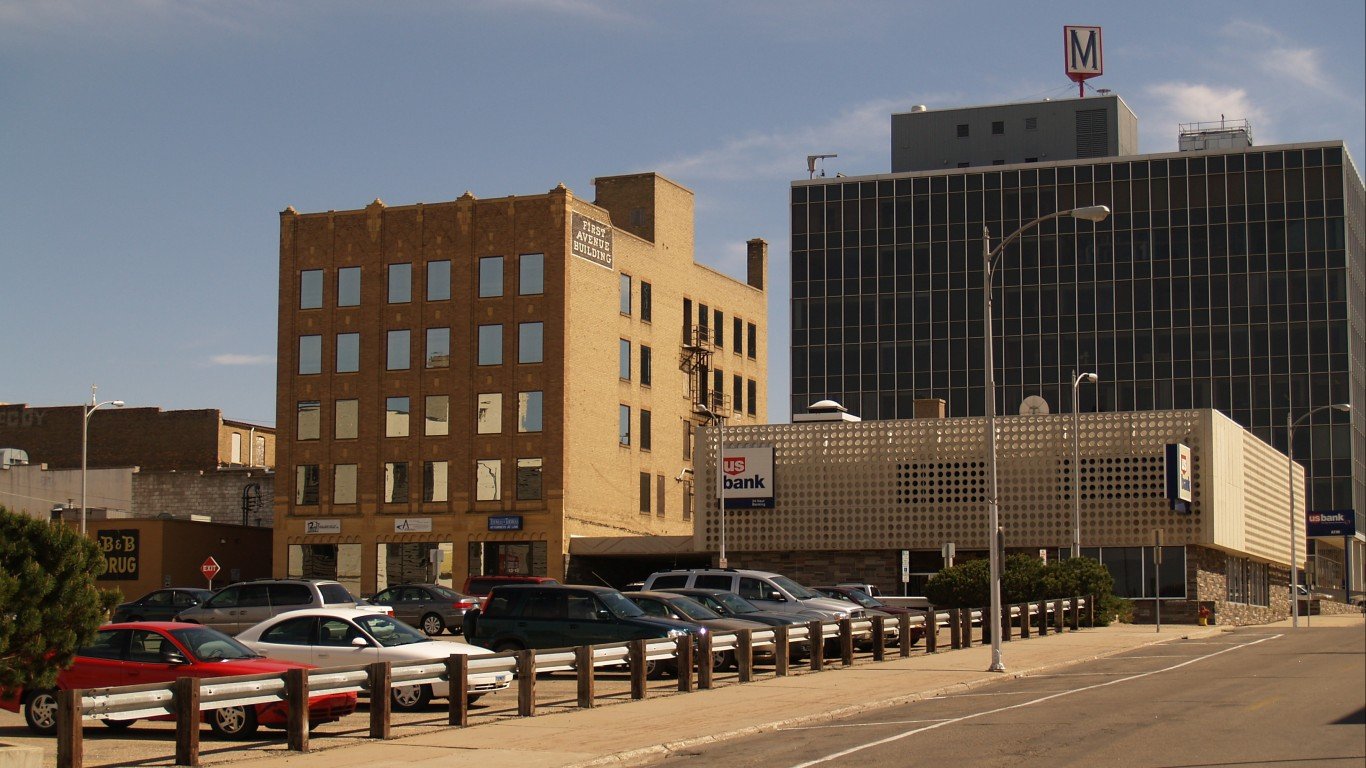
North Dakota: 58704
> Location: Minot
> Median monthly rental cost: $1,497 (North Dakota: $828)
> Share of income typically spent on rent: 29.5% (North Dakota: 24.4%)
> Rental occupied housing units: 99.0% (North Dakota: 37.5%)
> Median home value: N/A (North Dakota: $199,900)
> No. of zip codes considered in ranking: 25
[in-text-ad-2]
Ohio: 44236
> Location: Hudson
> Median monthly rental cost: $1,828 (Ohio: $825)
> Share of income typically spent on rent: 39.3% (Ohio: 27.5%)
> Rental occupied housing units: 10.5% (Ohio: 33.7%)
> Median home value: $354,300 (Ohio: $151,400)
> No. of zip codes considered in ranking: 490

Oklahoma: 73012
> Location: Oklahoma City
> Median monthly rental cost: $1,658 (Oklahoma: $818)
> Share of income typically spent on rent: 27.9% (Oklahoma: 27.2%)
> Rental occupied housing units: 17.5% (Oklahoma: 33.9%)
> Median home value: $241,200 (Oklahoma: $142,400)
> No. of zip codes considered in ranking: 178
[in-text-ad]

Oregon: 97034
> Location: Lake Oswego
> Median monthly rental cost: $1,779 (Oregon: $1,173)
> Share of income typically spent on rent: 33.7% (Oregon: 30.3%)
> Rental occupied housing units: 23.7% (Oregon: 37.2%)
> Median home value: $746,100 (Oregon: $336,700)
> No. of zip codes considered in ranking: 156
[recirclink id=1094298]

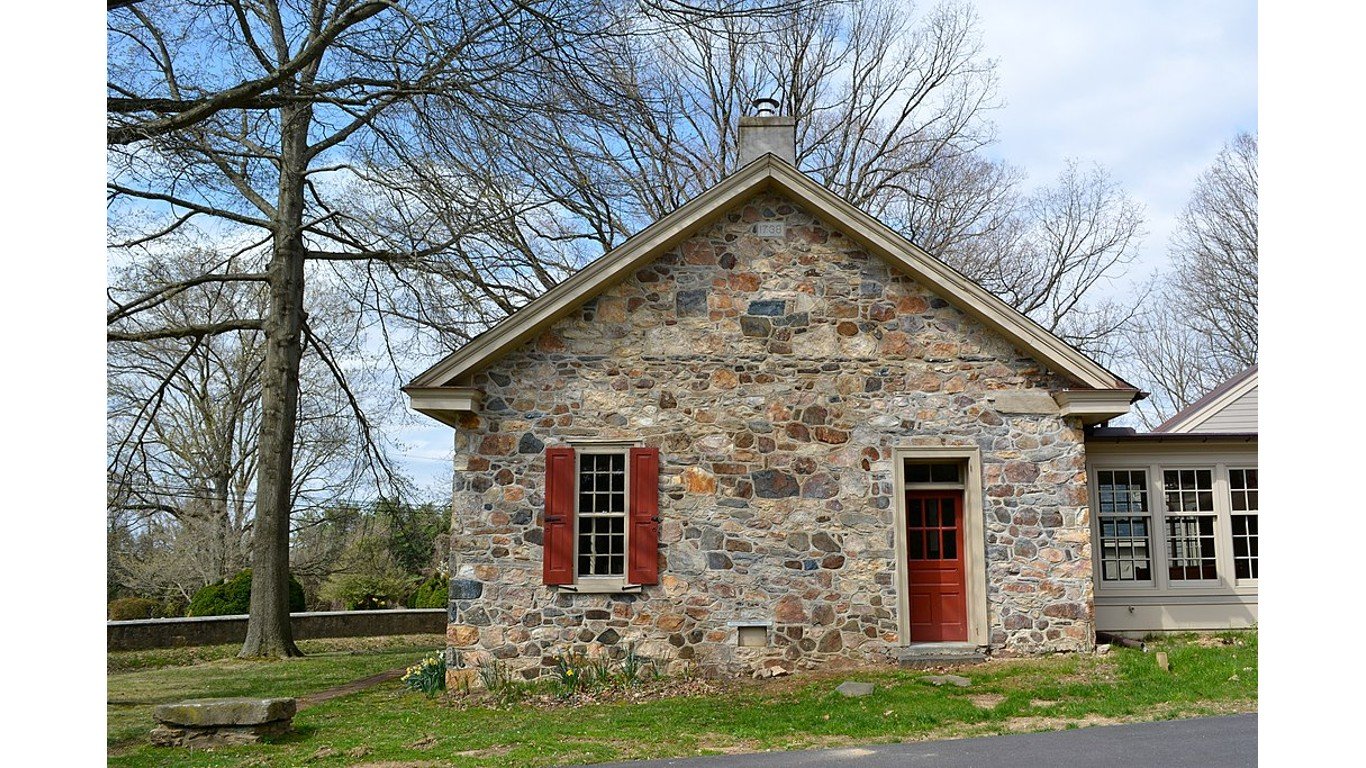
Pennsylvania: 19102
> Location: Philadelphia
> Median monthly rental cost: $2,114 (Pennsylvania: $958)
> Share of income typically spent on rent: 24.1% (Pennsylvania: 28.6%)
> Rental occupied housing units: 74.5% (Pennsylvania: 31.0%)
> Median home value: $506,800 (Pennsylvania: $187,500)
> No. of zip codes considered in ranking: 570

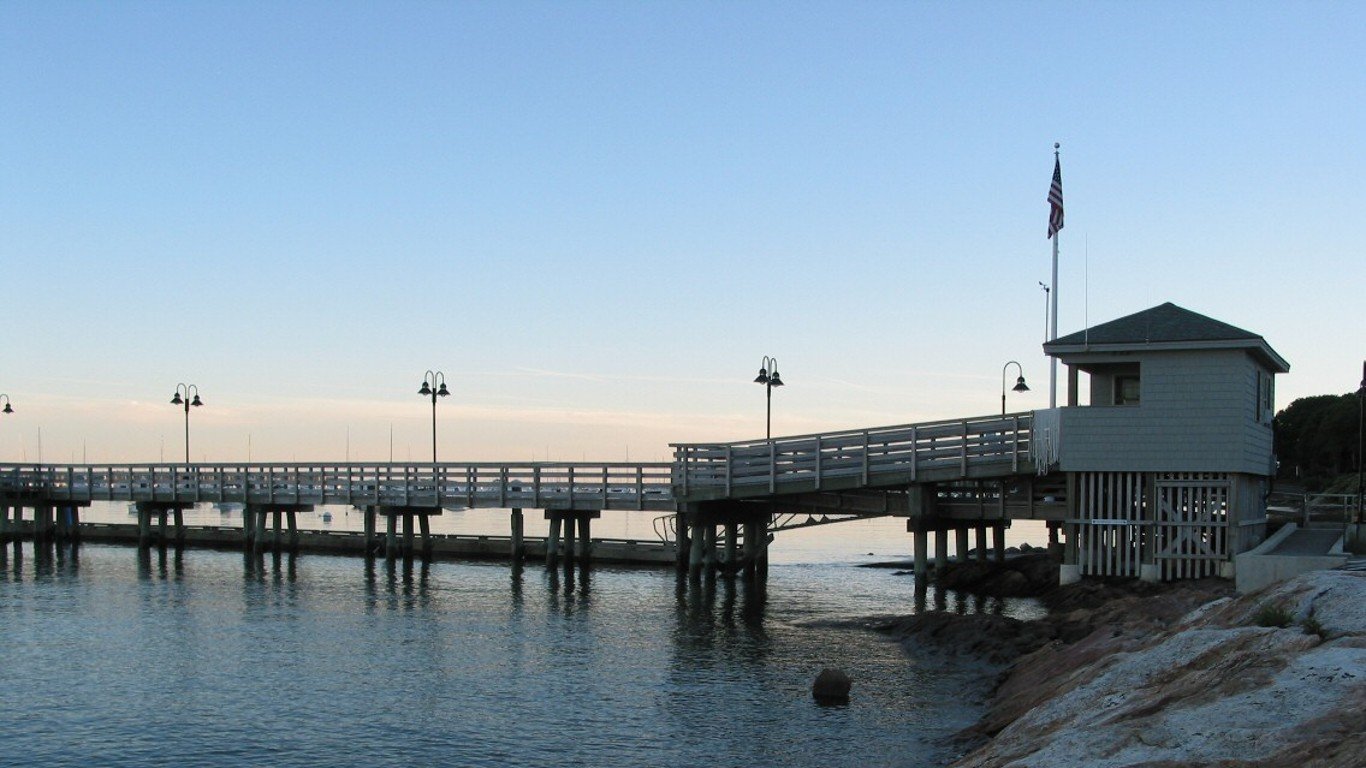
Rhode Island: 02871
> Location: Melville
> Median monthly rental cost: $1,562 (Rhode Island: $1,031)
> Share of income typically spent on rent: 31.5% (Rhode Island: 29.0%)
> Rental occupied housing units: 20.6% (Rhode Island: 38.4%)
> Median home value: $390,800 (Rhode Island: $276,600)
> No. of zip codes considered in ranking: 43
[in-text-ad-2]
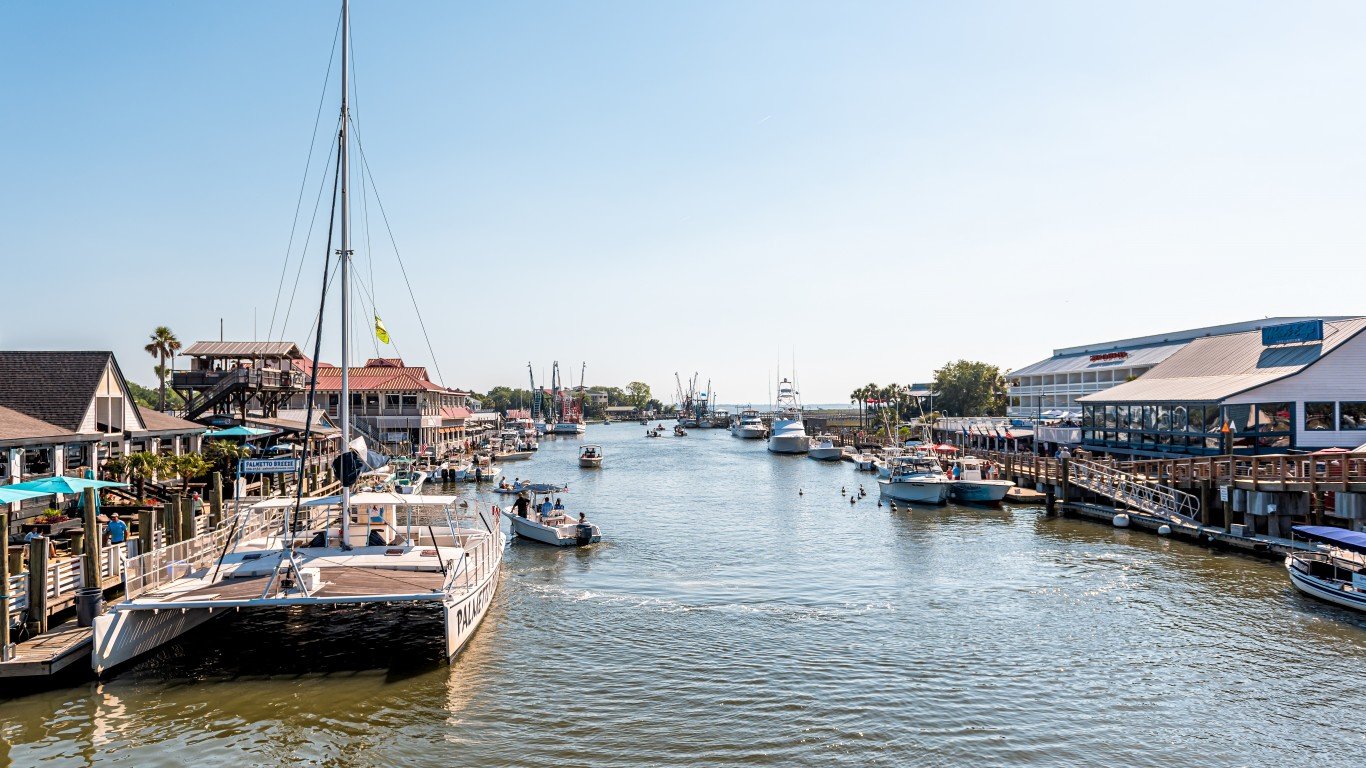
South Carolina: 29466
> Location: Mount Pleasant
> Median monthly rental cost: $1,724 (South Carolina: $918)
> Share of income typically spent on rent: 37.6% (South Carolina: 29.7%)
> Rental occupied housing units: 15.8% (South Carolina: 29.9%)
> Median home value: $456,400 (South Carolina: $170,100)
> No. of zip codes considered in ranking: 201
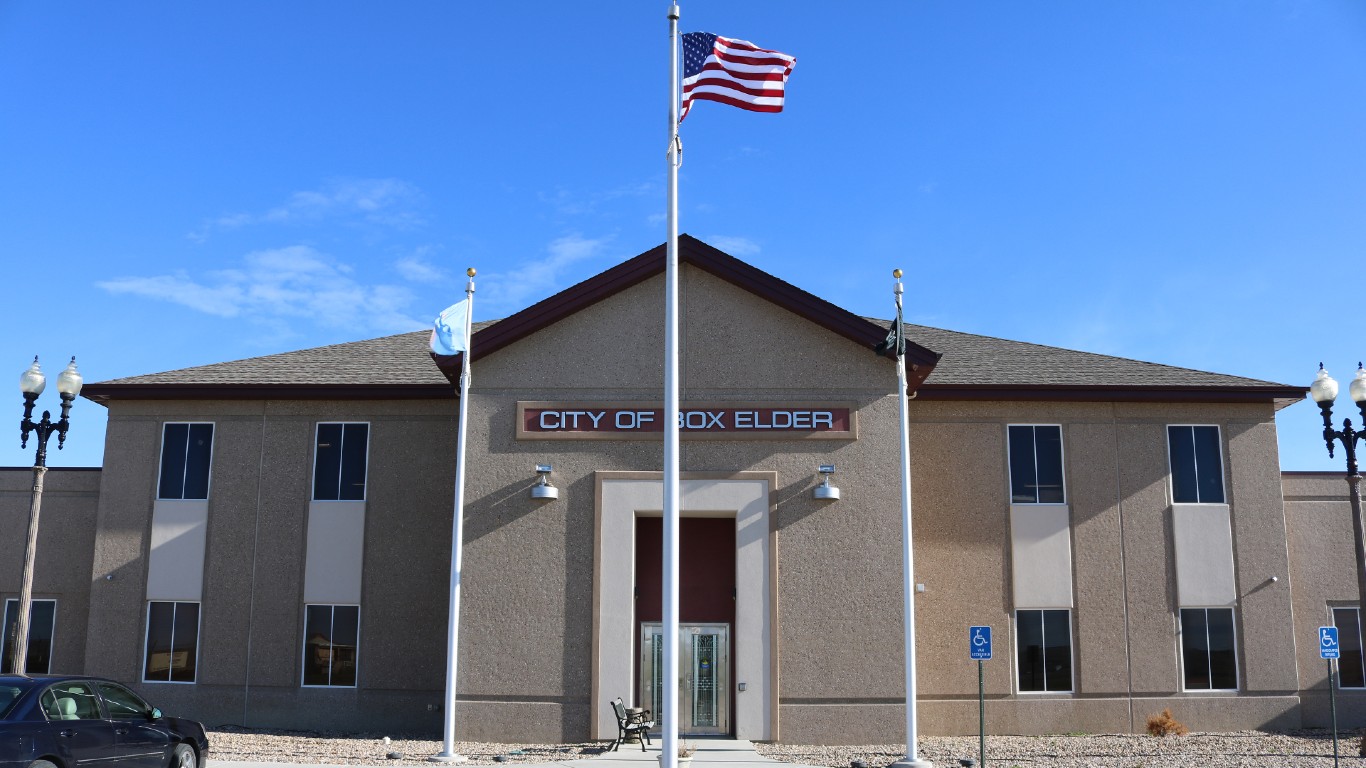
South Dakota: 57706
> Location: Box Elder
> Median monthly rental cost: $1,133 (South Dakota: $761)
> Share of income typically spent on rent: 26.7% (South Dakota: 25.2%)
> Rental occupied housing units: 98.4% (South Dakota: 32.0%)
> Median home value: N/A (South Dakota: $174,600)
> No. of zip codes considered in ranking: 37
[in-text-ad]

Tennessee: 37069
> Location: Franklin
> Median monthly rental cost: $2,075 (Tennessee: $897)
> Share of income typically spent on rent: 30.3% (Tennessee: 28.8%)
> Rental occupied housing units: 11.2% (Tennessee: 33.5%)
> Median home value: $499,400 (Tennessee: $177,600)
> No. of zip codes considered in ranking: 271
[recirclink id=1101677]

Texas: 78701
> Location: Austin
> Median monthly rental cost: $2,220 (Texas: $1,082)
> Share of income typically spent on rent: 24.3% (Texas: 29.1%)
> Rental occupied housing units: 62.3% (Texas: 37.7%)
> Median home value: $498,400 (Texas: $187,200)
> No. of zip codes considered in ranking: 925

Utah: 84092
> Location: Sandy
> Median monthly rental cost: $1,798 (Utah: $1,090)
> Share of income typically spent on rent: 27.2% (Utah: 27.8%)
> Rental occupied housing units: 6.5% (Utah: 29.5%)
> Median home value: $485,900 (Utah: $305,400)
> No. of zip codes considered in ranking: 94
[in-text-ad-2]
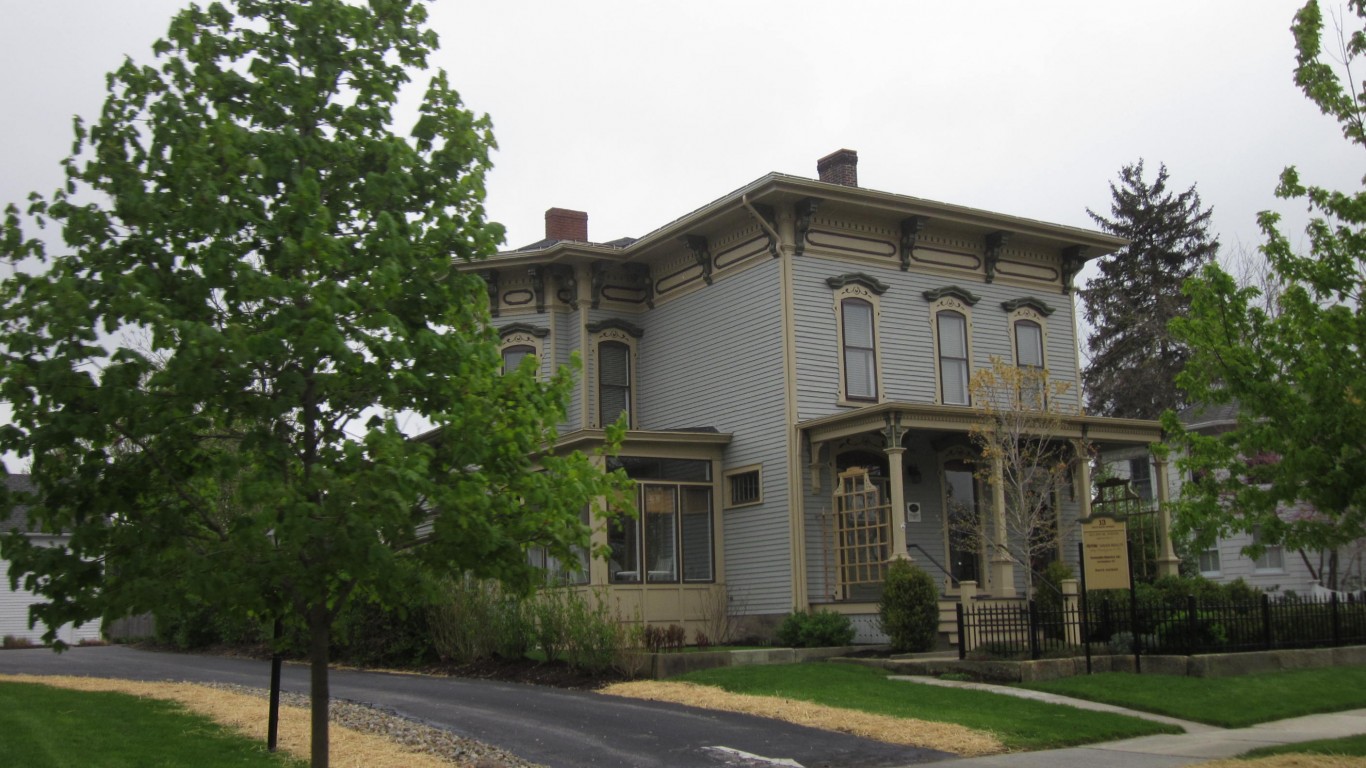
Vermont: 05495
> Location: Williston
> Median monthly rental cost: $1,515 (Vermont: $999)
> Share of income typically spent on rent: 39.9% (Vermont: 29.8%)
> Rental occupied housing units: 21.7% (Vermont: 28.7%)
> Median home value: $344,500 (Vermont: $230,900)
> No. of zip codes considered in ranking: 34

Virginia: 22101
> Location: McLean
> Median monthly rental cost: $3,252 (Virginia: $1,257)
> Share of income typically spent on rent: 30.0% (Virginia: 28.8%)
> Rental occupied housing units: 15.2% (Virginia: 33.3%)
> Median home value: $1,026,000 (Virginia: $282,800)
> No. of zip codes considered in ranking: 324
[in-text-ad]
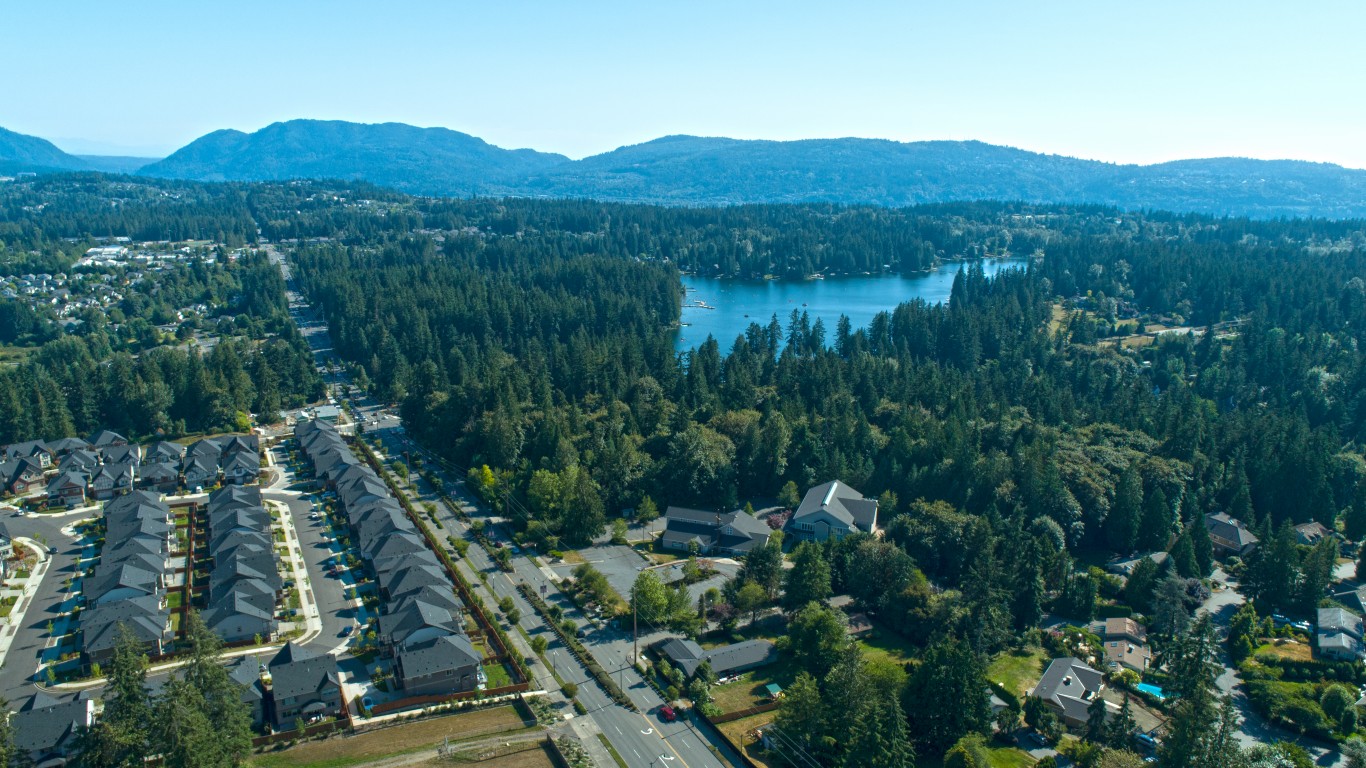
Washington: 98075
> Location: Sammamish
> Median monthly rental cost: $2,498 (Washington: $1,337)
> Share of income typically spent on rent: 24.3% (Washington: 29.1%)
> Rental occupied housing units: 11.5% (Washington: 36.7%)
> Median home value: $984,500 (Washington: $366,800)
> No. of zip codes considered in ranking: 277
[recirclink id=1102674]
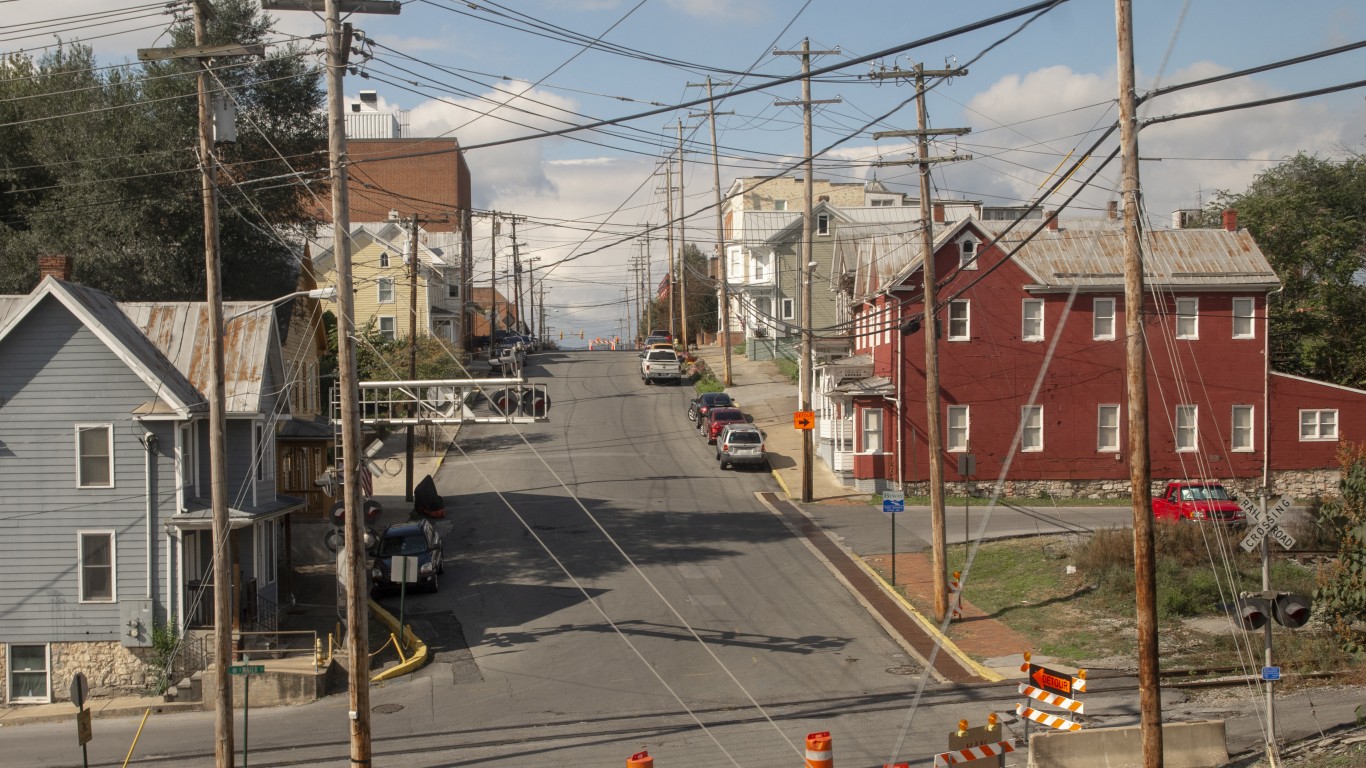
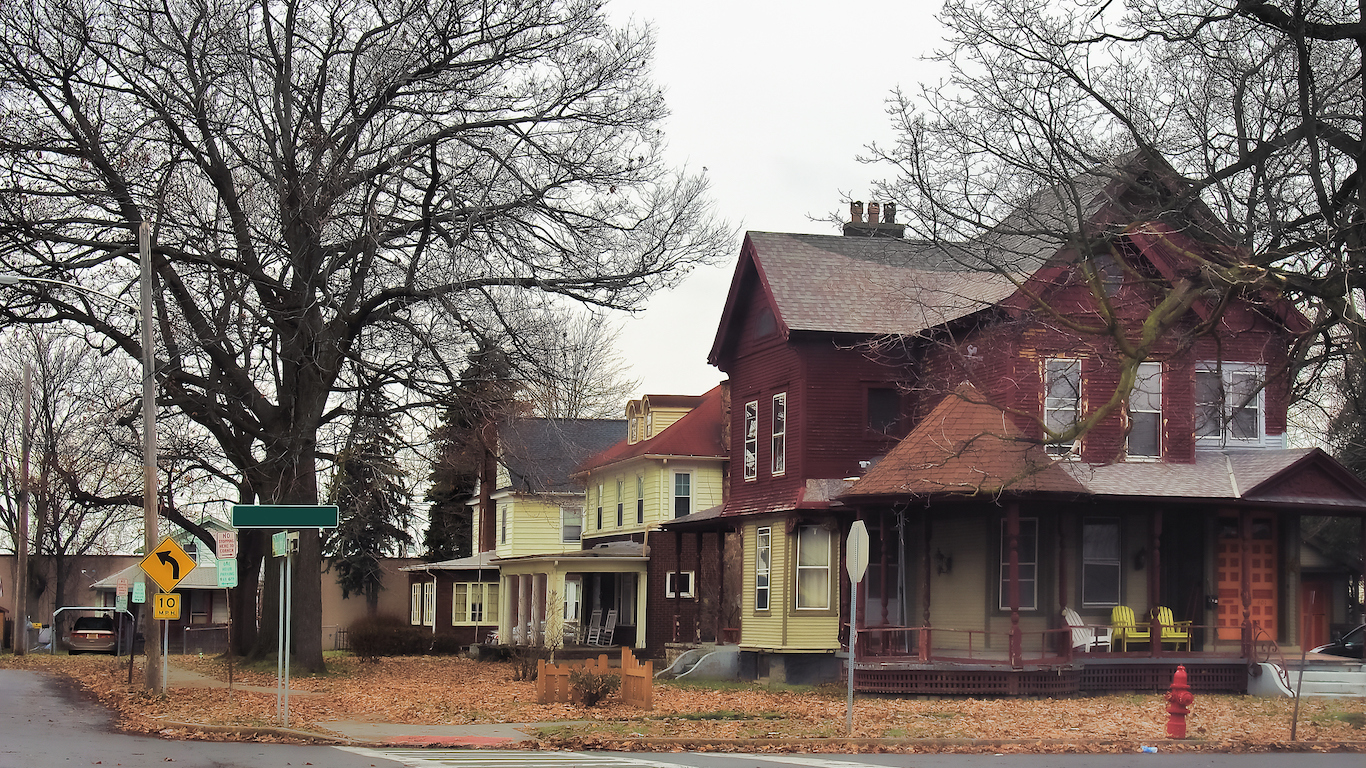
West Virginia: 25405
> Location: Martinsburg
> Median monthly rental cost: $1,436 (West Virginia: $732)
> Share of income typically spent on rent: 18.8% (West Virginia: 28.9%)
> Rental occupied housing units: 17.1% (West Virginia: 26.3%)
> Median home value: $189,900 (West Virginia: $123,200)
> No. of zip codes considered in ranking: 90
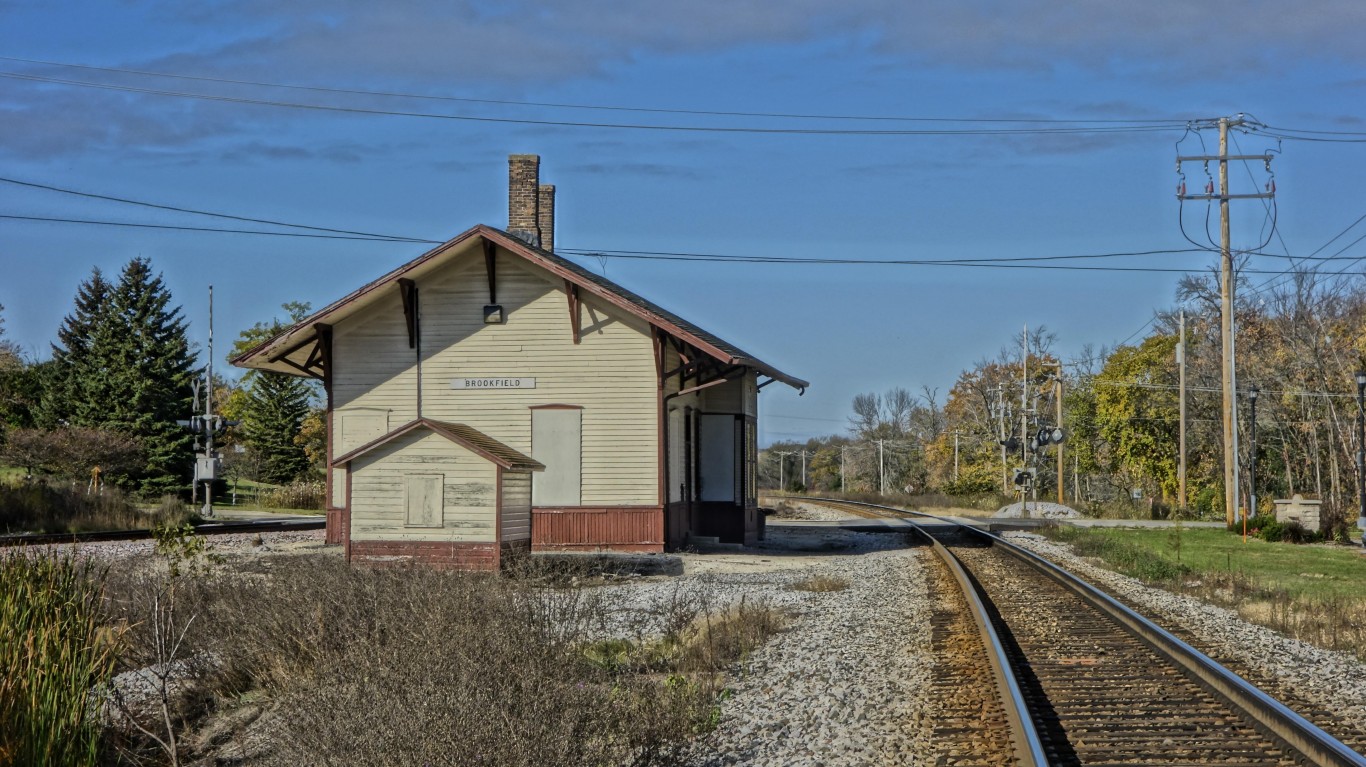
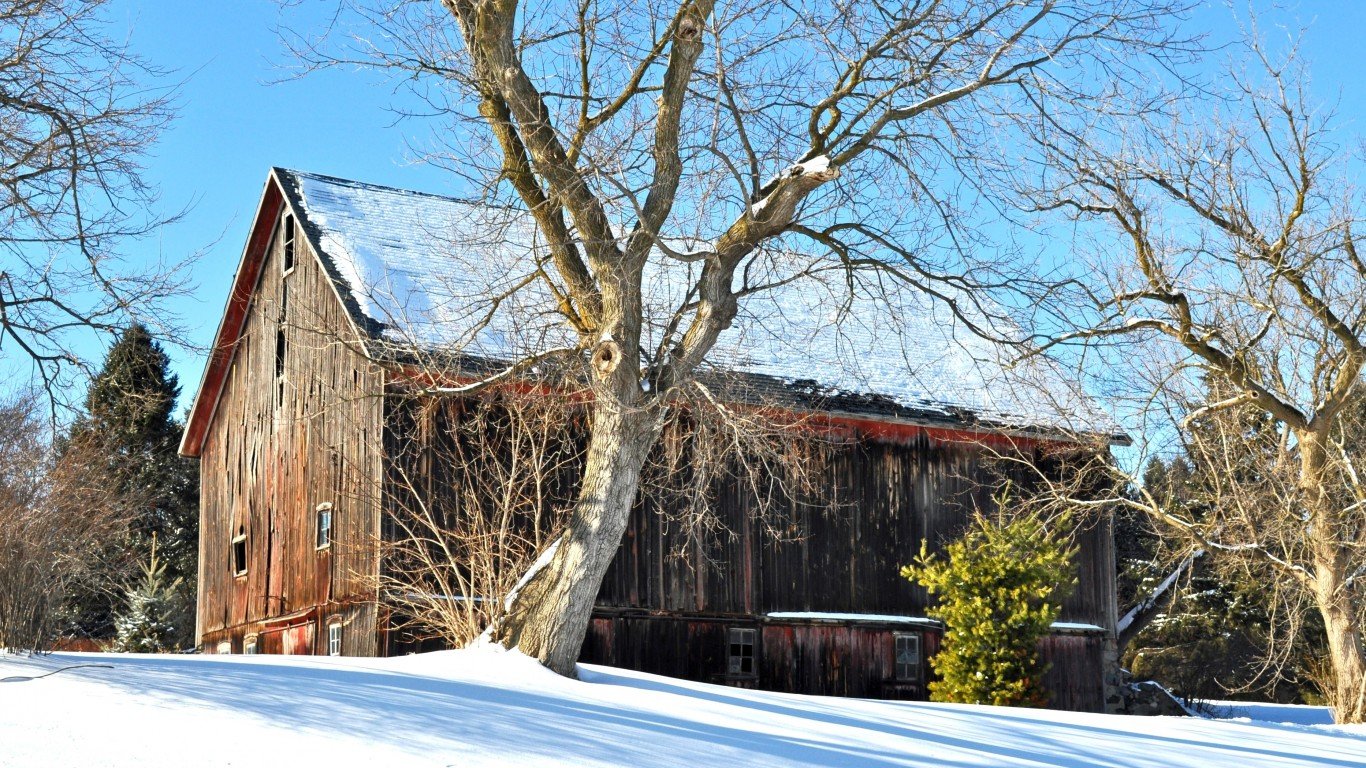
Wisconsin: 53045
> Location: Brookfield
> Median monthly rental cost: $1,548 (Wisconsin: $872)
> Share of income typically spent on rent: 26.5% (Wisconsin: 27.0%)
> Rental occupied housing units: 19.0% (Wisconsin: 32.9%)
> Median home value: $352,400 (Wisconsin: $189,200)
> No. of zip codes considered in ranking: 247
[in-text-ad-2]
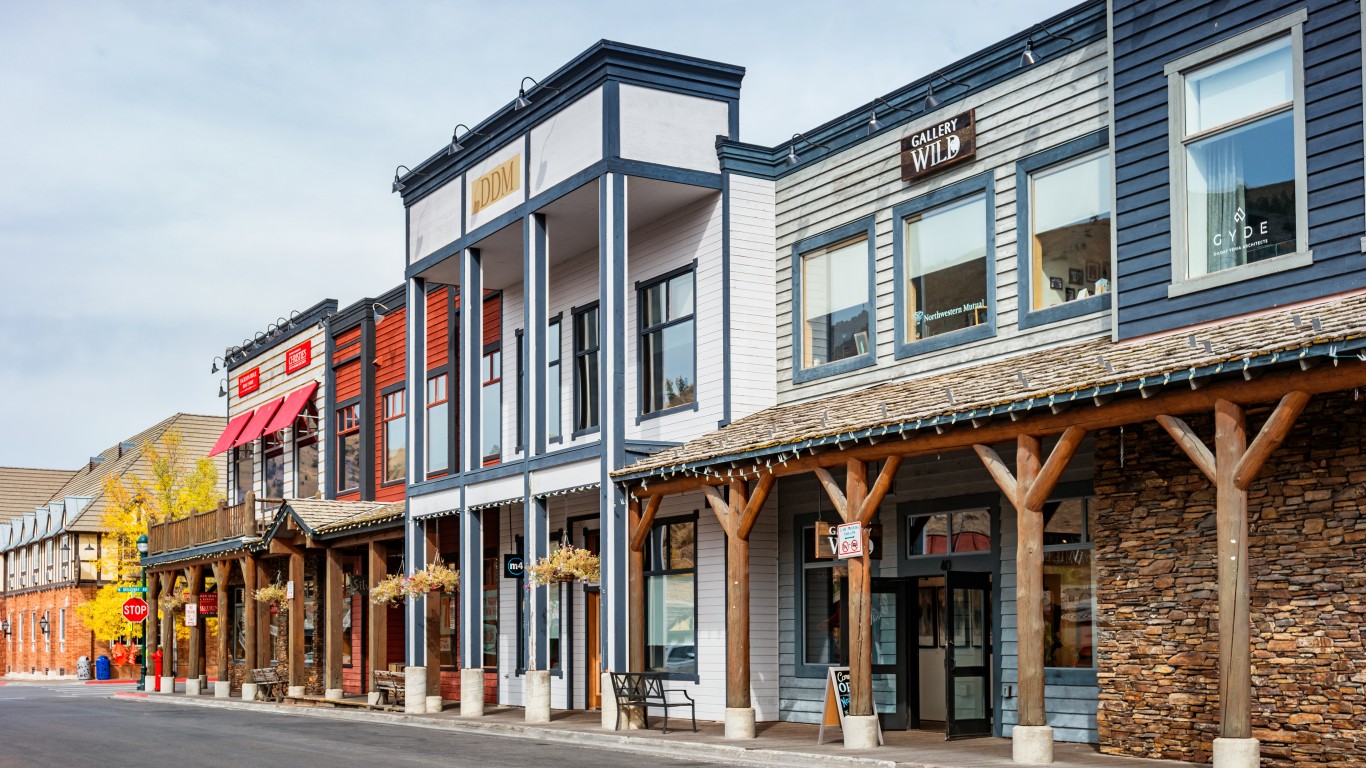
Wyoming: 83001
> Location: Jackson
> Median monthly rental cost: $1,519 (Wyoming: $853)
> Share of income typically spent on rent: 26.4% (Wyoming: 26.3%)
> Rental occupied housing units: 45.8% (Wyoming: 29.0%)
> Median home value: $831,000 (Wyoming: $228,000)
> No. of zip codes considered in ranking: 27
Methodology
To determine the ZIP code with the highest rent in every state, 24/7 Wall St. reviewed five-year estimates of median gross rent from the U.S. Census Bureau’s 2020 American Community Survey.
We used ZIP Code Tabulation Areas — a census geography type which defines areal representations of United States Postal Service zip codes (USPS zip codes do not define geographic boundaries but instead are a network of mail delivery routes in a service area). We refer to census ZCTAs as zip codes.
ZIP codes were excluded if median gross rent was not available in the 2020 ACS, if there were fewer than 500 renter-occupied housing units, or if the sampling error associated with a ZIP code’s data was deemed too high.
The sampling error was defined as too high if the coefficient of variation — a statistical assessment of how reliable an estimate is — for a ZIP code’s median gross rent was above 15% and greater than two standard deviations above the mean CV for all ZIP codes’ median gross rents. We similarly excluded ZIP codes that had a sampling error too high for their population, using the same definition.
ZIP codes were ranked based on the median gross rent. To break ties, we used the median gross rent as a share of household income.
Additional information on median gross rent as a share of household income, share of households occupied by renters, and median home value are also five-year estimates from the 2020 ACS. Because the Census Bureau didn’t release one-year estimates for 2020 due to data collection issues caused by the COVID-19 pandemic, all ACS data are five-year estimates.
Contact [email protected] for any questions or corrections.