Natural disasters, including pandemics like COVID-19, rarely harm communities in a uniform manner. Time and again, hurricanes, floods, extreme heat, wildfires, and health dangers, hurt some neighborhoods considerably more than others, despite having similar exposure to the disaster.
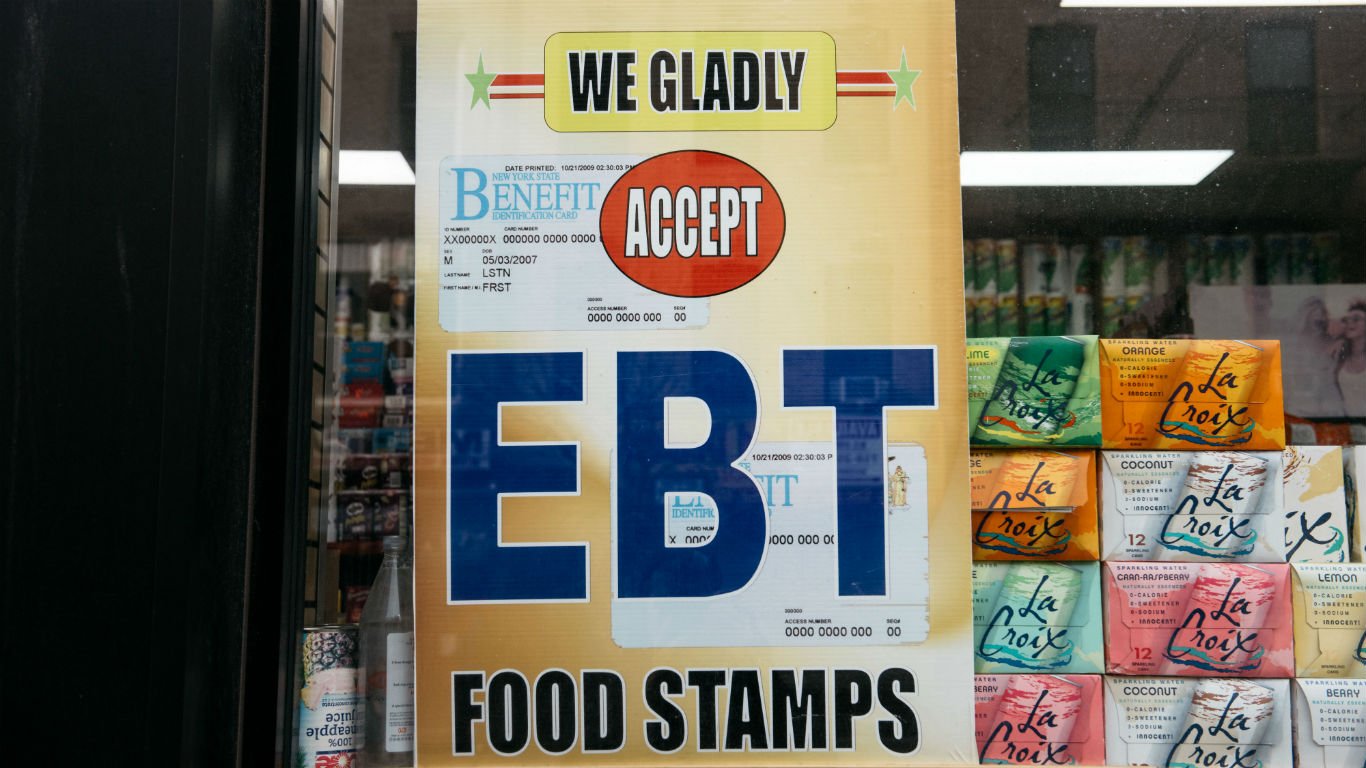
To try to understand the vulnerability or resilience of a community to natural disaster, the U.S. Census Bureau developed Community Resilience Estimates. The Census identified 10 risk factors that make a household more vulnerable in emergencies. The 10 factors are: no access to a vehicle, low income levels, no one in household working full time, relatively crowded housing, no health insurance, no internet access, being 65 and older, having one or no caregiver in the household (person between 18 to 64), having a constraining disability, and poor English or education level that could hinder communication.
Nearly 22% of the U.S. residents are considered to be exposed to at least three risk factors that could make them more vulnerable during natural disasters. In communities nationwide, the percentage of the population exposed to three or more risk factors ranges from 7% to 58%. (These are cities at the greatest risk of hurricane disaster this year.)
Many of these risk factors are related, often affected by low income and poverty. For example, a low-income household is less likely to have access to a vehicle to use for evacuation or access to the internet to follow emergency response updates.
Older Americans, especially those with disabilities or without a family member to take care of them, are also significantly more likely to be vulnerable during emergencies. A White House report found that 71% of the people killed by Hurricane Katrina in 2005 in the state of Louisiana were over the age of 60; nearly half were over the age of 75. (These are neighborhoods with the oldest residents.)
To determine the 55 counties that are most vulnerable to disaster, 24/7 Wall St. reviewed data on exposure to risk from the 2019 Community Resilience Estimates program. Counties are ranked by the estimated percentage of the population exposed to at least three risk factors of the 10 the CRE identified. Additional data are five-year averages for 2020.
Out of the 55 U.S. counties most vulnerable to disasters, 11 are in Texas, home to about 210,000 residents. Mississippi, South Dakota, and Georgia are other states with a large number of these counties, with a combined population of nearly 300,000.
The Bronx borough of New York City is by far the largest of these at-risk communities, in part because of its high density of low-income public-housing residents who are less likely to be able to evacuate due to their economic and/or physical conditions, as demonstrated in 2012 during Hurricane Sandy.
The 55 most at-risk counties have a share of residents living with at least three vulnerabilities of between 40.4% in Turner County, Georgia, to 58.4% in Oglala Lakota County, South Dakota. About one in four residents in seven of these counties are at least 65 years old, including nearly one in three residents of Mora County, New Mexico.
Here are the counties that are most vulnerable to disasters
Click here to read our detailed methodology

55. Turner County, GA
> Population with at least three risk factors: 40.4%
> Median household income: $34,514 (#3,018 highest out of 3,221)
> Uninsured: 13.0% (#639 highest out of 3,221)
> Pct. population over 65: 19.0% (#1,558 highest out of 3,221)
> Population: 7,920
[in-text-ad]

54. Hancock County, GA
> Population with at least three risk factors: 40.5%
> Median household income: $32,914 (#3,053 highest out of 3,221)
> Uninsured: 12.6% (#700 highest out of 3,221)
> Pct. population over 65: 22.9% (#570 highest out of 3,221)
> Population: 8,500
[recirclink id=1143949]

53. Washington County, MS
> Population with at least three risk factors: 40.6%
> Median household income: $32,011 (#3,075 highest out of 3,221)
> Uninsured: 14.2% (#476 highest out of 3,221)
> Pct. population over 65: 16.4% (#2,364 highest out of 3,221)
> Population: 16,336

52. Amite County, MS
> Population with at least three risk factors: 40.7%
> Median household income: $30,805 (#3,094 highest out of 3,221)
> Uninsured: 13.5% (#571 highest out of 3,221)
> Pct. population over 65: 23.5% (#480 highest out of 3,221)
> Population: 12,341
[in-text-ad-2]
51. Rolette County, ND
> Population with at least three risk factors: 40.7%
> Median household income: $46,481 (#2,281 highest out of 3,221)
> Uninsured: 25.8% (# 34 highest out of 3,221)
> Pct. population over 65: 11.8% (#3,087 highest out of 3,221)
> Population: 14,437

50. Mora County, NM
> Population with at least three risk factors: 40.8%
> Median household income: $29,458 (#3,115 highest out of 3,221)
> Uninsured: 2.8% (#3,177 highest out of 3,221)
> Pct. population over 65: 31.0% (# 60 highest out of 3,221)
> Population: 4,500
[in-text-ad]

49. Warren County, GA
> Population with at least three risk factors: 40.8%
> Median household income: $38,250 (#2,875 highest out of 3,221)
> Uninsured: 11.0% (#979 highest out of 3,221)
> Pct. population over 65: 22.2% (#701 highest out of 3,221)
> Population: 5,259
[recirclink id=1142693]

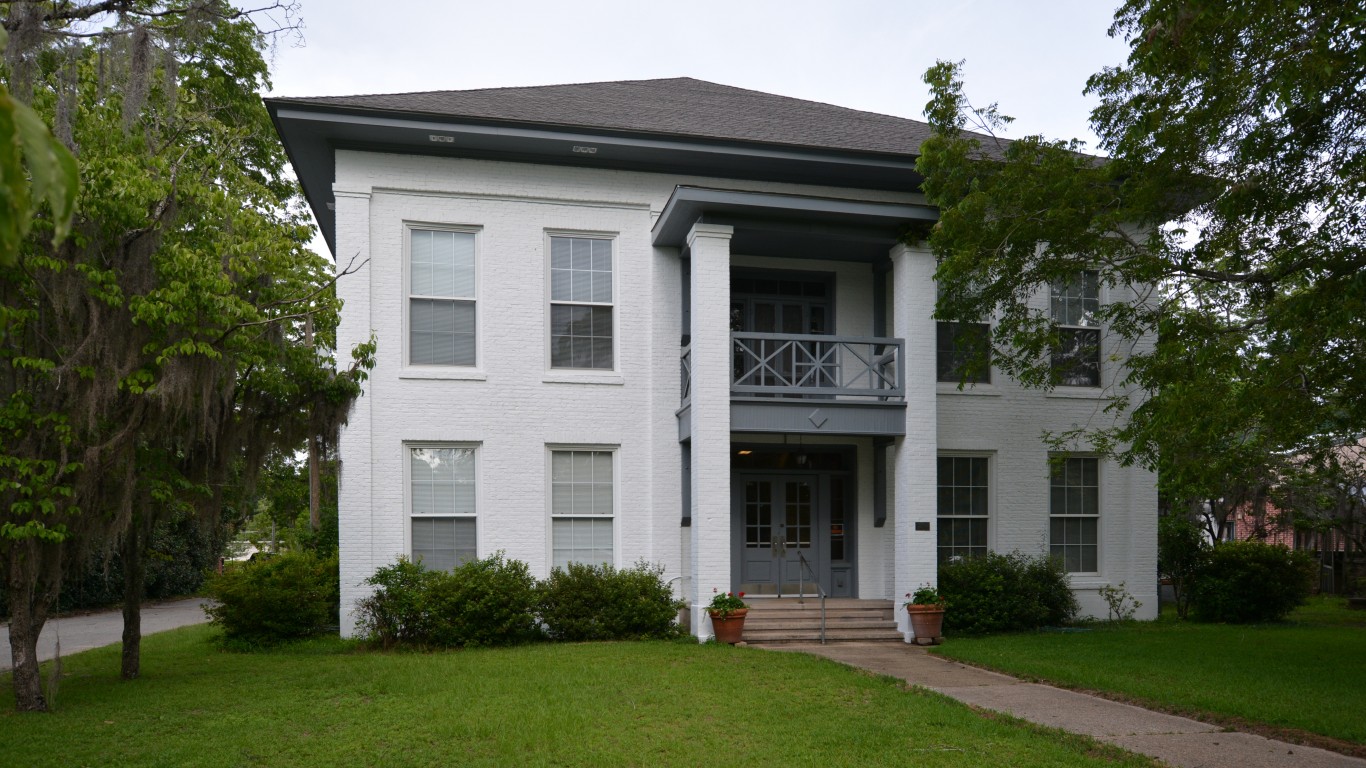
48. Greene County, AL
> Population with at least three risk factors: 40.8%
> Median household income: $26,688 (#3,134 highest out of 3,221)
> Uninsured: 16.6% (#289 highest out of 3,221)
> Pct. population over 65: 22.3% (#676 highest out of 3,221)
> Population: 8,221

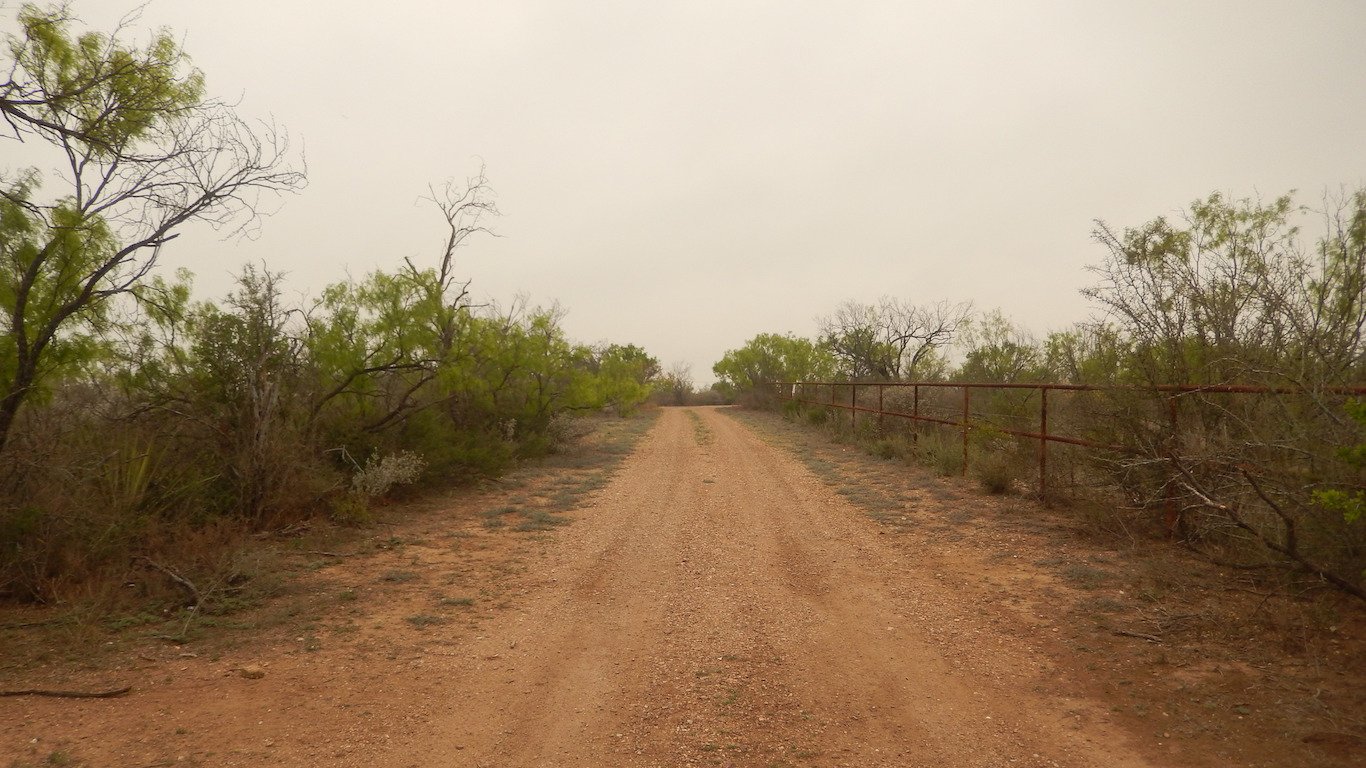
47. Zapata County, TX
> Population with at least three risk factors: 41.0%
> Median household income: $32,945 (#3,051 highest out of 3,221)
> Uninsured: 25.9% (# 32 highest out of 3,221)
> Pct. population over 65: 13.6% (#2,898 highest out of 3,221)
> Population: 14,243
[in-text-ad-2]

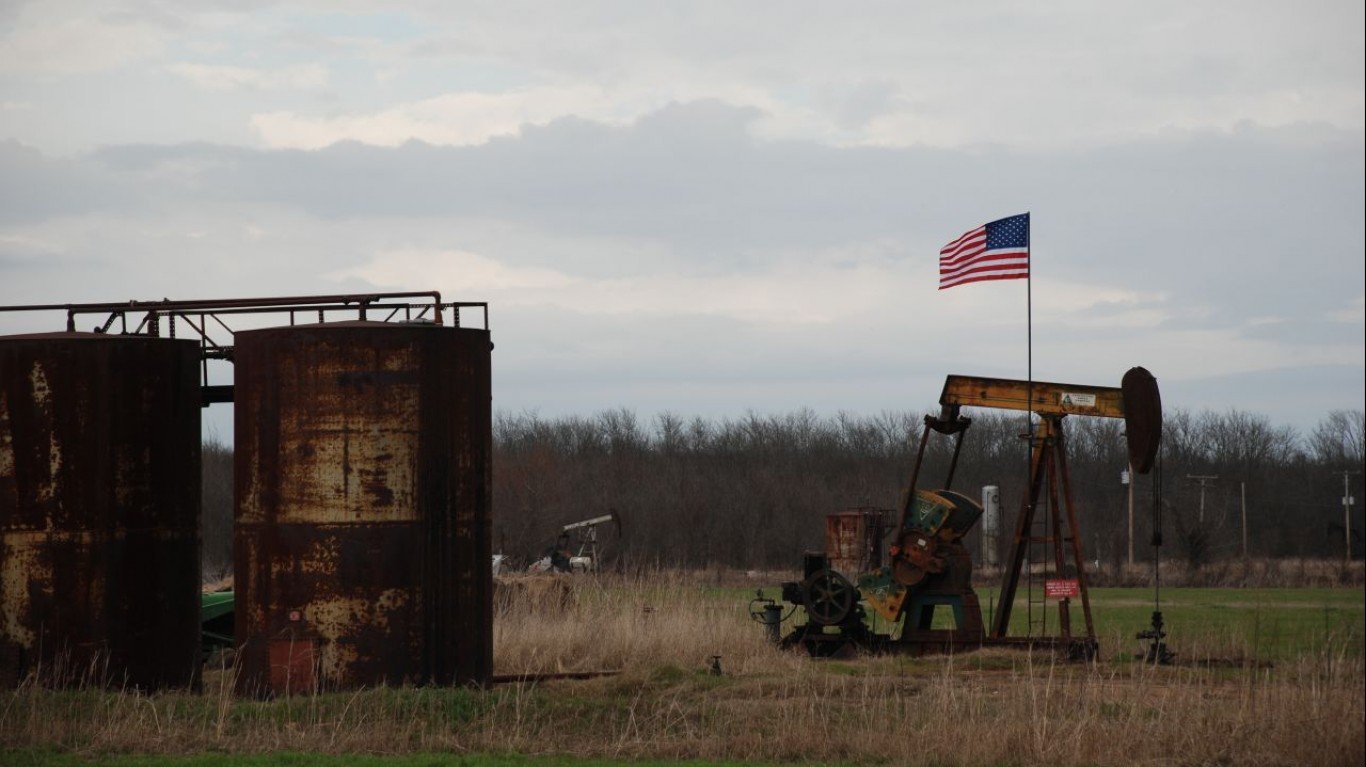
46. Monroe County, AR
> Population with at least three risk factors: 41.1%
> Median household income: $38,438 (#2,862 highest out of 3,221)
> Uninsured: 8.4% (#1,585 highest out of 3,221)
> Pct. population over 65: 22.9% (#570 highest out of 3,221)
> Population: 21,006

45. Starr County, TX
> Population with at least three risk factors: 41.2%
> Median household income: $30,931 (#3,093 highest out of 3,221)
> Uninsured: 33.4% (# 10 highest out of 3,221)
> Pct. population over 65: 11.3% (#3,123 highest out of 3,221)
> Population: 64,032
[in-text-ad]

44. Wolfe County, KY
> Population with at least three risk factors: 41.7%
> Median household income: $22,292 (#3,156 highest out of 3,221)
> Uninsured: 1.2% (#3,218 highest out of 3,221)
> Pct. population over 65: 19.3% (#1,462 highest out of 3,221)
> Population: 7,188
[recirclink id=1145871]

43. Tallahatchie County, MS
> Population with at least three risk factors: 41.7%
> Median household income: $30,433 (#3,103 highest out of 3,221)
> Uninsured: 14.1% (#493 highest out of 3,221)
> Pct. population over 65: 15.2% (#2,647 highest out of 3,221)
> Population: 14,041
42. Bennett County, SD
> Population with at least three risk factors: 41.8%
> Median household income: $41,887 (#2,663 highest out of 3,221)
> Uninsured: 23.9% (# 54 highest out of 3,221)
> Pct. population over 65: 12.4% (#3,038 highest out of 3,221)
> Population: 3,430
[in-text-ad-2]

41. Hardeman County, TX
> Population with at least three risk factors: 41.9%
> Median household income: $47,188 (#2,211 highest out of 3,221)
> Uninsured: 13.1% (#627 highest out of 3,221)
> Pct. population over 65: 22.5% (#637 highest out of 3,221)
> Population: 25,247

40. Leflore County, MS
> Population with at least three risk factors: 41.9%
> Median household income: $30,077 (#3,107 highest out of 3,221)
> Uninsured: 13.4% (#586 highest out of 3,221)
> Pct. population over 65: 14.2% (#2,803 highest out of 3,221)
> Population: 28,764
[in-text-ad]

39. Sharkey County, MS
> Population with at least three risk factors: 41.9%
> Median household income: $35,711 (#2,976 highest out of 3,221)
> Uninsured: 17.6% (#228 highest out of 3,221)
> Pct. population over 65: 17.2% (#2,156 highest out of 3,221)
> Population: 4,427
[recirclink id=1049367]

38. Bronx County, NY
> Population with at least three risk factors: 42.0%
> Median household income: $41,895 (#2,661 highest out of 3,221)
> Uninsured: 8.0% (#1,696 highest out of 3,221)
> Pct. population over 65: 12.9% (#2,986 highest out of 3,221)
> Population: 1,427,056

37. Jenkins County, GA
> Population with at least three risk factors: 42.2%
> Median household income: $25,712 (#3,140 highest out of 3,221)
> Uninsured: 18.3% (#189 highest out of 3,221)
> Pct. population over 65: 17.2% (#2,156 highest out of 3,221)
> Population: 8,787
[in-text-ad-2]

36. Wilcox County, AL
> Population with at least three risk factors: 42.3%
> Median household income: $35,063 (#3,001 highest out of 3,221)
> Uninsured: 10.1% (#1,156 highest out of 3,221)
> Pct. population over 65: 19.5% (#1,393 highest out of 3,221)
> Population: 10,552
35. Maverick County, TX
> Population with at least three risk factors: 42.4%
> Median household income: $41,385 (#2,702 highest out of 3,221)
> Uninsured: 29.2% (# 17 highest out of 3,221)
> Pct. population over 65: 11.8% (#3,087 highest out of 3,221)
> Population: 58,098
[in-text-ad]

34. Warren County, NC
> Population with at least three risk factors: 42.5%
> Median household income: $37,476 (#2,909 highest out of 3,221)
> Uninsured: 10.1% (#1,156 highest out of 3,221)
> Pct. population over 65: 25.4% (#303 highest out of 3,221)
> Population: 5,259
[recirclink id=1099722]

33. Holmes County, MS
> Population with at least three risk factors: 42.6%
> Median household income: $24,074 (#3,149 highest out of 3,221)
> Uninsured: 16.5% (#295 highest out of 3,221)
> Pct. population over 65: 15.2% (#2,647 highest out of 3,221)
> Population: 19,530
32. Clay County, GA
> Population with at least three risk factors: 43.3%
> Median household income: $32,434 (#3,065 highest out of 3,221)
> Uninsured: 14.2% (#476 highest out of 3,221)
> Pct. population over 65: 30.5% (# 77 highest out of 3,221)
> Population: 13,285
[in-text-ad-2]

31. Dillingham Census Area, AK
> Population with at least three risk factors: 43.3%
> Median household income: $57,436 (#1,107 highest out of 3,221)
> Uninsured: 18.7% (#172 highest out of 3,221)
> Pct. population over 65: 11.3% (#3,123 highest out of 3,221)
> Population: 4,934

30. Hancock County, TN
> Population with at least three risk factors: 43.4%
> Median household income: $28,234 (#3,126 highest out of 3,221)
> Uninsured: 9.5% (#1,308 highest out of 3,221)
> Pct. population over 65: 21.1% (#934 highest out of 3,221)
> Population: 8,500
[in-text-ad]

29. Brooks County, TX
> Population with at least three risk factors: 43.5%
> Median household income: $25,058 (#3,143 highest out of 3,221)
> Uninsured: 25.6% (# 36 highest out of 3,221)
> Pct. population over 65: 17.8% (#1,953 highest out of 3,221)
> Population: 15,548
[recirclink id=1143949]

28. San Augustine County, TX
> Population with at least three risk factors: 44.0%
> Median household income: $41,568 (#2,689 highest out of 3,221)
> Uninsured: 15.2% (#394 highest out of 3,221)
> Pct. population over 65: 26.8% (#210 highest out of 3,221)
> Population: 8,260

27. Roosevelt County, MT
> Population with at least three risk factors: 44.0%
> Median household income: $45,458 (#2,369 highest out of 3,221)
> Uninsured: 27.2% (# 25 highest out of 3,221)
> Pct. population over 65: 11.5% (#3,113 highest out of 3,221)
> Population: 11,091
[in-text-ad-2]

26. Randolph County, GA
> Population with at least three risk factors: 44.8%
> Median household income: $29,400 (#3,117 highest out of 3,221)
> Uninsured: 12.1% (#777 highest out of 3,221)
> Pct. population over 65: 22.2% (#701 highest out of 3,221)
> Population: 22,732

25. Baker County, GA
> Population with at least three risk factors: 45.0%
> Median household income: $34,034 (#3,025 highest out of 3,221)
> Uninsured: 13.6% (#550 highest out of 3,221)
> Pct. population over 65: 29.8% (# 93 highest out of 3,221)
> Population: 28,679
[in-text-ad]
24. Lafayette County, AR
> Population with at least three risk factors: 45.6%
> Median household income: $33,763 (#3,035 highest out of 3,221)
> Uninsured: 7.6% (#1,807 highest out of 3,221)
> Pct. population over 65: 23.7% (#462 highest out of 3,221)
> Population: 6,728
[recirclink id=1142693]

23. Fulton County, AR
> Population with at least three risk factors: 45.6%
> Median household income: $35,274 (#2,992 highest out of 3,221)
> Uninsured: 10.9% (#993 highest out of 3,221)
> Pct. population over 65: 26.0% (#252 highest out of 3,221)
> Population: 12,301

22. Issaquena County, MS
> Population with at least three risk factors: 46.2%
> Median household income: $28,333 (#3,124 highest out of 3,221)
> Uninsured: 8.9% (#1,458 highest out of 3,221)
> Pct. population over 65: 22.6% (#623 highest out of 3,221)
> Population: 1,223
[in-text-ad-2]

21. Real County, TX
> Population with at least three risk factors: 46.4%
> Median household income: $38,659 (#2,854 highest out of 3,221)
> Uninsured: 22.7% (# 68 highest out of 3,221)
> Pct. population over 65: 29.7% (# 97 highest out of 3,221)
> Population: 3,429

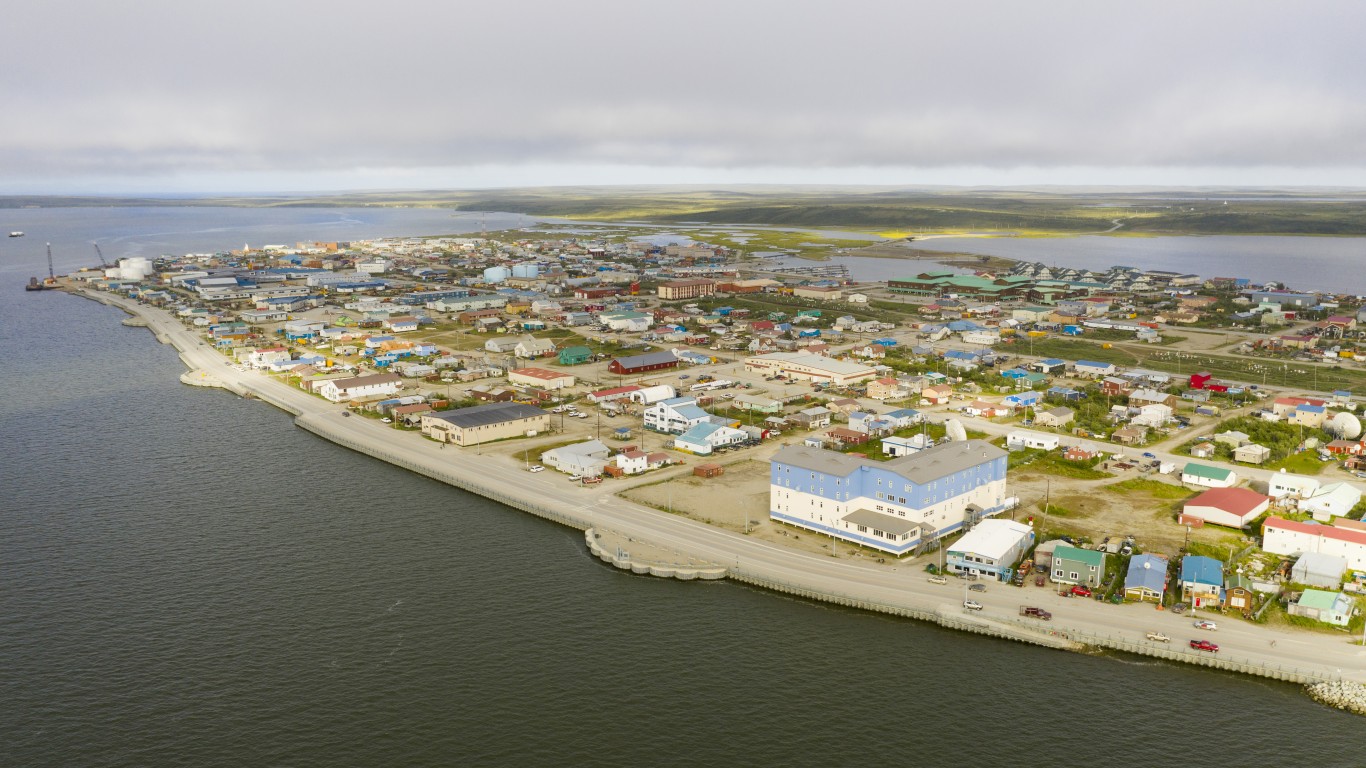
20. Nome Census Area, AK
> Population with at least three risk factors: 46.6%
> Median household income: $62,843 (#699 highest out of 3,221)
> Uninsured: 19.1% (#152 highest out of 3,221)
> Pct. population over 65: 7.8% (#3,209 highest out of 3,221)
> Population: 10,009
[in-text-ad]

19. Mellette County, SD
> Population with at least three risk factors: 46.8%
> Median household income: $33,882 (#3,029 highest out of 3,221)
> Uninsured: 37.1% (# 06 highest out of 3,221)
> Pct. population over 65: 15.4% (#2,599 highest out of 3,221)
> Population: 2,065
[recirclink id=1145871]

18. Humphreys County, MS
> Population with at least three risk factors: 47.4%
> Median household income: $28,628 (#3,121 highest out of 3,221)
> Uninsured: 14.7% (#437 highest out of 3,221)
> Pct. population over 65: 16.9% (#2,236 highest out of 3,221)
> Population: 8,198

17. Kemper County, MS
> Population with at least three risk factors: 48.0%
> Median household income: $30,735 (#3,099 highest out of 3,221)
> Uninsured: 12.8% (#671 highest out of 3,221)
> Pct. population over 65: 20.9% (#971 highest out of 3,221)
> Population: 9,829
[in-text-ad-2]
16. Northwest Arctic Borough, AK
> Population with at least three risk factors: 48.5%
> Median household income: $63,750 (#650 highest out of 3,221)
> Uninsured: 23.2% (# 63 highest out of 3,221)
> Pct. population over 65: 7.7% (#3,210 highest out of 3,221)
> Population: 7,709

15. Collingsworth County, TX
> Population with at least three risk factors: 48.6%
> Median household income: $41,202 (#2,710 highest out of 3,221)
> Uninsured: 23.6% (# 57 highest out of 3,221)
> Pct. population over 65: 17.9% (#1,921 highest out of 3,221)
> Population: 2,939
[in-text-ad]

14. Sioux County, ND
> Population with at least three risk factors: 48.7%
> Median household income: $41,893 (#2,662 highest out of 3,221)
> Uninsured: 33.0% (# 11 highest out of 3,221)
> Pct. population over 65: 8.6% (#3,205 highest out of 3,221)
> Population: 34,900
[recirclink id=1049367]

13. Bethel Census Area, AK
> Population with at least three risk factors: 48.7%
> Median household income: $54,400 (#1,406 highest out of 3,221)
> Uninsured: 17.4% (#241 highest out of 3,221)
> Pct. population over 65: 7.4% (#3,214 highest out of 3,221)
> Population: 18,263
12. Todd County, SD
> Population with at least three risk factors: 49.1%
> Median household income: $24,102 (#3,148 highest out of 3,221)
> Uninsured: 29.1% (# 18 highest out of 3,221)
> Pct. population over 65: 7.4% (#3,214 highest out of 3,221)
> Population: 12,334
[in-text-ad-2]

11. Edwards County, TX
> Population with at least three risk factors: 49.2%
> Median household income: $40,643 (#2,753 highest out of 3,221)
> Uninsured: 21.0% (#100 highest out of 3,221)
> Pct. population over 65: 24.1% (#422 highest out of 3,221)
> Population: 6,431

10. Yukon-Koyukuk Census Area, AK
> Population with at least three risk factors: 49.5%
> Median household income: $41,728 (#2,682 highest out of 3,221)
> Uninsured: 22.7% (# 68 highest out of 3,221)
> Pct. population over 65: 14.9% (#2,699 highest out of 3,221)
> Population: 5,305
[in-text-ad]
9. Corson County, SD
> Population with at least three risk factors: 49.9%
> Median household income: $36,705 (#2,944 highest out of 3,221)
> Uninsured: 24.1% (# 52 highest out of 3,221)
> Pct. population over 65: 11.1% (#3,133 highest out of 3,221)
> Population: 4,106
[recirclink id=1099722]
8. Ziebach County, SD
> Population with at least three risk factors: 50.1%
> Median household income: $36,615 (#2,949 highest out of 3,221)
> Uninsured: 28.7% (# 19 highest out of 3,221)
> Pct. population over 65: 10.1% (#3,175 highest out of 3,221)
> Population: 2,767
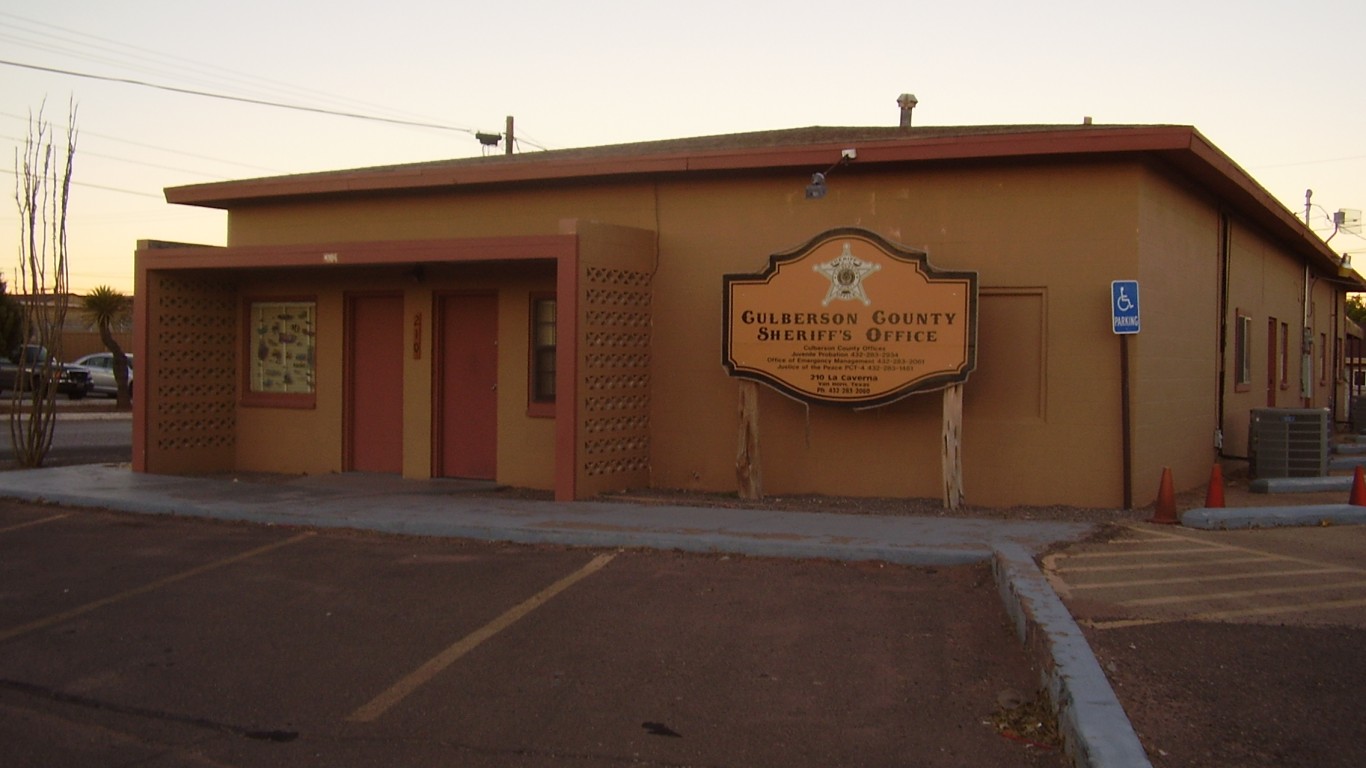
7. Hudspeth County, TX
> Population with at least three risk factors: 51.4%
> Median household income: $31,505 (#3,087 highest out of 3,221)
> Uninsured: 30.6% (# 14 highest out of 3,221)
> Pct. population over 65: 13.8% (#2,869 highest out of 3,221)
> Population: 4,687
[in-text-ad-2]

6. Apache County, AZ
> Population with at least three risk factors: 52.8%
> Median household income: $33,967 (#3,027 highest out of 3,221)
> Uninsured: 26.2% (# 29 highest out of 3,221)
> Pct. population over 65: 15.5% (#2,578 highest out of 3,221)
> Population: 71,714
5. Buffalo County, SD
> Population with at least three risk factors: 53.1%
> Median household income: $35,000 (#3,005 highest out of 3,221)
> Uninsured: 40.4% (# 03 highest out of 3,221)
> Pct. population over 65: 7.7% (#3,210 highest out of 3,221)
> Population: 49,594
[in-text-ad]

4. McKinley County, NM
> Population with at least three risk factors: 53.4%
> Median household income: $36,179 (#2,963 highest out of 3,221)
> Uninsured: 19.9% (#125 highest out of 3,221)
> Pct. population over 65: 12.3% (#3,043 highest out of 3,221)
> Population: 71,956
[recirclink id=1143949]

3. Kusilvak Census Area, AK
> Population with at least three risk factors: 57.6%
> Median household income: $37,358 (#2,913 highest out of 3,221)
> Uninsured: 18.0% (#201 highest out of 3,221)
> Pct. population over 65: 5.8% (#3,219 highest out of 3,221)
> Population: 8,298

2. La Salle County, TX
> Population with at least three risk factors: 58.3%
> Median household income: $47,162 (#2,215 highest out of 3,221)
> Uninsured: 23.3% (# 61 highest out of 3,221)
> Pct. population over 65: 15.8% (#2,503 highest out of 3,221)
> Population: 7,551
[in-text-ad-2]

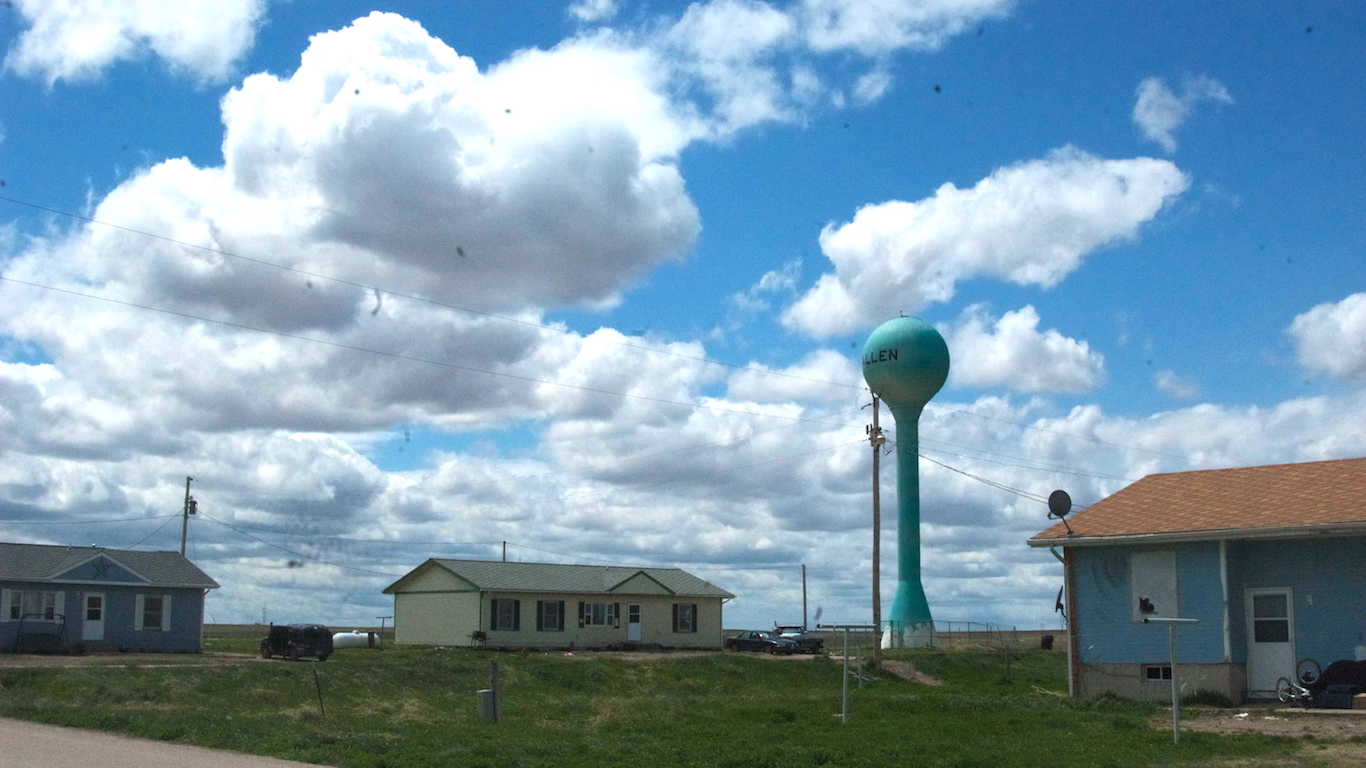
1. Oglala Lakota County, SD
> Population with at least three risk factors: 58.4%
> Median household income: $31,423 (#3,090 highest out of 3,221)
> Uninsured: 37.7% (# 05 highest out of 3,221)
> Pct. population over 65: 7.1% (#3,217 highest out of 3,221)
> Population: 14,277
Methodology
To determine the communities that are most vulnerable to disaster, 24/7 Wall St. reviewed data on exposure to risk from the U.S. Census Bureau’s 2019 Community Resilience Estimates program. Counties are ranked by the estimated percentage of the population exposed to at least three risk factors of the 10 the CRE identified.
The 10 risk factors are: no access to a vehicle, income-to-poverty ratio less than 130%; lack of health insurance; household crowding of 0.75 or greater persons per room; single or zero caregiver households (one or no persons in household 18-64 years old); communications barriers (defined as no one with at least high school diploma or no one who speaks English very well); no one in household employed full time, year-round (not applied for household with 65+ occupants); disability with at least one constraint to significant life activity; 65 years or older; and households without broadband Internet access.
Additional demographic, income, and health insurance data came from the U.S. Census Bureau’s 2020 American Community Survey and are five-year estimates.
Contact [email protected] for any questions or corrections.