Over two years have passed since the start of the COVID-19 pandemic, and its effects continue to extend far beyond public health. A recent report released by the National Assessment of Educational Progress reveals a staggering decline in math and reading skills among the nation’s fourth and eighth grade students.
Specifically, the share of fourth-graders and the share of eighth-graders who are considered proficient in reading each fell by 3 percentage points since 2019, the last time the standardized test was administered. While there is no single explanation for the trend, experts attribute the historic decline primarily to the disruptions stemming from the pandemic. (Here is a look at the best places to teach in America.)
Based on the latest NAEP test results, also known as the nation’s report card, only 33% of fourth-graders and 31% of eighth-graders are proficient in reading. In some states, reading proficiency rates are even lower.
Using data from the NAEP, 24/7 Wall St. identified the states where students score the worst in reading. States are ranked on an average for fourth-and eighth-grade reading proficiency rates. In the case of a tie, the state that spends less on education per pupil ranks lower. In the 21 states on this list, average reading proficiency among fourth- and eighth-graders is below 30%.
In 2021, the federal government invested $123 billion in public education to help students catch up in the wake of the pandemic. The latest test results reveal it may take billions more. While the link between per pupil spending and student outcomes is complicated, most of the states on this list invest less on a per student basis in their education system than most other states, according to the latest data from the Department of Education. (Here is a look at how much each state spends on public schools.)
Miquel Cardona, the secretary of education, summed up what is at stake in improving reading and math proficiency. “This is a moment of truth for education,” he said. “How we respond to this will determine not only our recovery, but our nation’s standing in the world.”
Click here to see 21 states where students score the worst on reading tests.

21. South Carolina
> Avg. share of 4th and 8th graders proficient in reading: 29.5%
> 4th graders proficient in reading: 32% – 21st highest (no change from 2019)
> 8th graders proficient in reading: 27% – 14th lowest (-5 ppt. from 2019)
> Avg. annual per pupil spending in state: $11,359 – 22nd lowest
[in-text-ad]

20. Arizona
> Avg. share of 4th and 8th graders proficient in reading: 29.5%
> 4th graders proficient in reading: 31% – 23rd lowest (no change from 2019)
> 8th graders proficient in reading: 28% – 19th lowest (-1 ppt. from 2019)
> Avg. annual per pupil spending in state: $8,648 – 3rd lowest
[recirclink id=1177031]
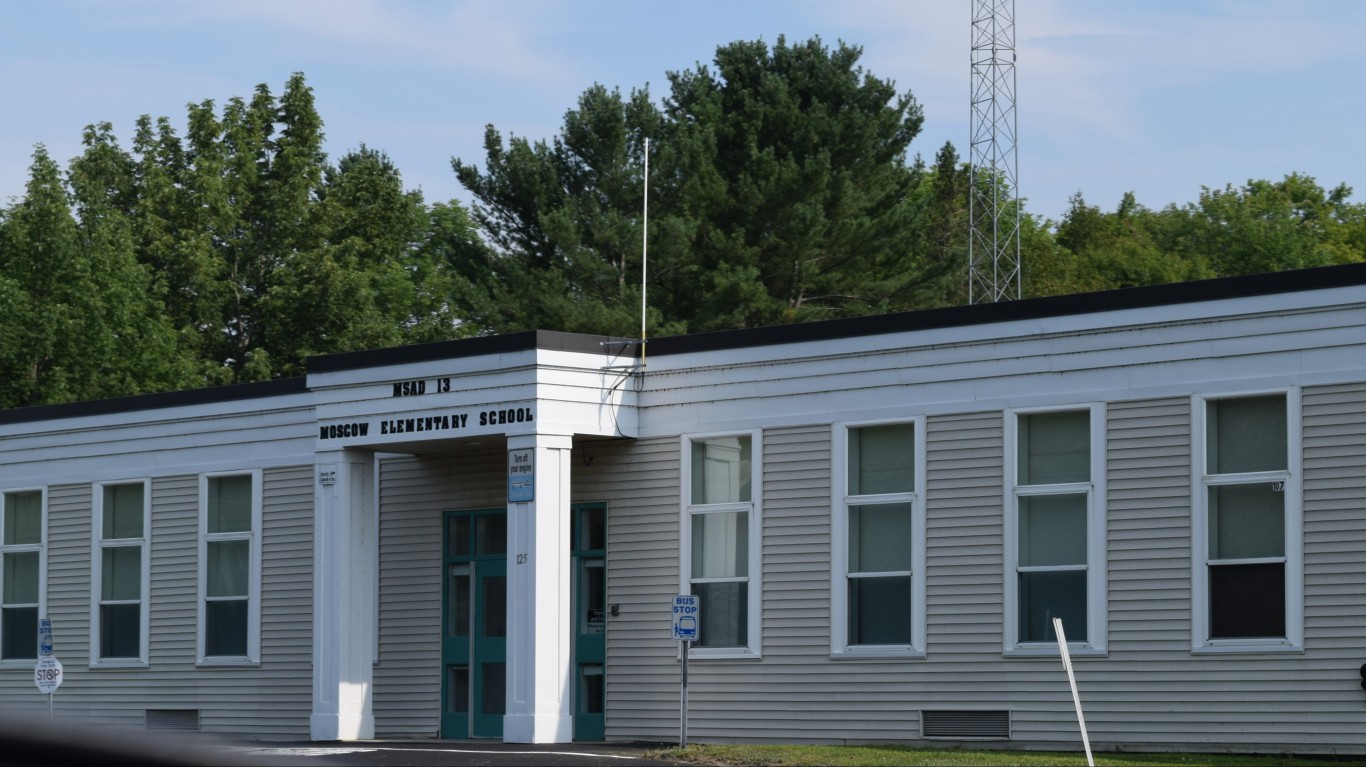
19. Maine
> Avg. share of 4th and 8th graders proficient in reading: 29%
> 4th graders proficient in reading: 29% – 11th lowest (-8 ppt. from 2019)
> 8th graders proficient in reading: 29% – 25th highest (-8 ppt. from 2019)
> Avg. annual per pupil spending in state: $14,720 – 15th highest
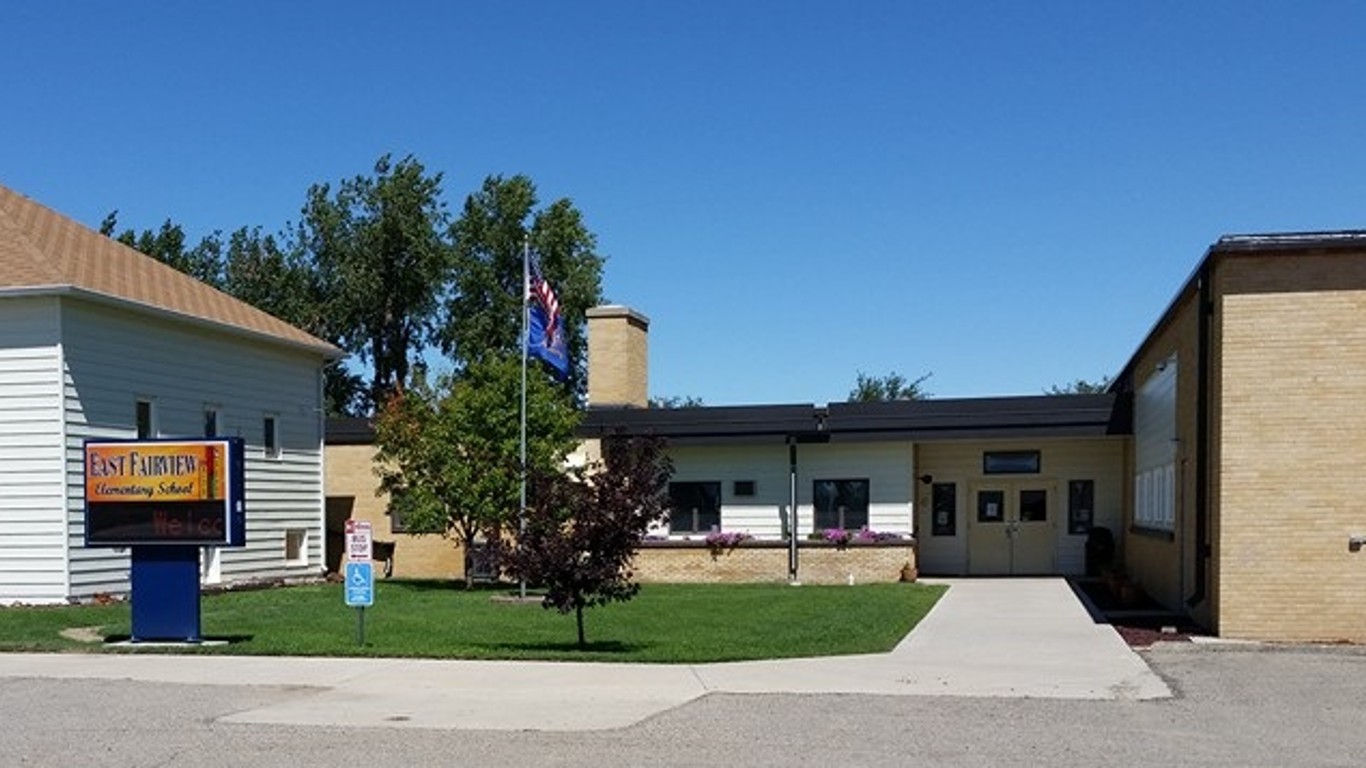
18. North Dakota
> Avg. share of 4th and 8th graders proficient in reading: 29%
> 4th graders proficient in reading: 31% – 23rd lowest (-4 ppt. from 2019)
> 8th graders proficient in reading: 27% – 14th lowest (-5 ppt. from 2019)
> Avg. annual per pupil spending in state: $13,453 – 18th highest
[in-text-ad-2]

17. Missouri
> Avg. share of 4th and 8th graders proficient in reading: 29%
> 4th graders proficient in reading: 30% – 16th lowest (-5 ppt. from 2019)
> 8th graders proficient in reading: 28% – 19th lowest (-6 ppt. from 2019)
> Avg. annual per pupil spending in state: $11,243 – 19th lowest
16. Tennessee
> Avg. share of 4th and 8th graders proficient in reading: 29%
> 4th graders proficient in reading: 30% – 16th lowest (-5 ppt. from 2019)
> 8th graders proficient in reading: 28% – 19th lowest (-5 ppt. from 2019)
> Avg. annual per pupil spending in state: $9,870 – 10th lowest
[in-text-ad]
15. North Carolina
> Avg. share of 4th and 8th graders proficient in reading: 29%
> 4th graders proficient in reading: 32% – 21st highest (-5 ppt. from 2019)
> 8th graders proficient in reading: 26% – 11th lowest (-6 ppt. from 2019)
> Avg. annual per pupil spending in state: $9,747 – 9th lowest
[recirclink id=1177237]

14. Kansas
> Avg. share of 4th and 8th graders proficient in reading: 28.5%
> 4th graders proficient in reading: 31% – 23rd lowest (-4 ppt. from 2019)
> 8th graders proficient in reading: 26% – 11th lowest (-7 ppt. from 2019)
> Avg. annual per pupil spending in state: $11,387 – 23rd lowest
13. Oregon
> Avg. share of 4th and 8th graders proficient in reading: 28%
> 4th graders proficient in reading: 28% – 10th lowest (-7 ppt. from 2019)
> 8th graders proficient in reading: 28% – 19th lowest (-7 ppt. from 2019)
> Avg. annual per pupil spending in state: $11,778 – 24th lowest
[in-text-ad-2]
12. Michigan
> Avg. share of 4th and 8th graders proficient in reading: 28%
> 4th graders proficient in reading: 28% – 10th lowest (-6 ppt. from 2019)
> 8th graders proficient in reading: 28% – 19th lowest (-4 ppt. from 2019)
> Avg. annual per pupil spending in state: $11,211 – 18th lowest
11. Arkansas
> Avg. share of 4th and 8th graders proficient in reading: 28%
> 4th graders proficient in reading: 30% – 16th lowest (-3 ppt. from 2019)
> 8th graders proficient in reading: 26% – 11th lowest (-4 ppt. from 2019)
> Avg. annual per pupil spending in state: $10,084 – 12th lowest
[in-text-ad]

10. Nevada
> Avg. share of 4th and 8th graders proficient in reading: 28%
> 4th graders proficient in reading: 27% – 6th lowest (-6 ppt. from 2019)
> 8th graders proficient in reading: 29% – 25th highest (+1 ppt. from 2019)
> Avg. annual per pupil spending in state: $9,159 – 5th lowest
[recirclink id=1175927]
9. Louisiana
> Avg. share of 4th and 8th graders proficient in reading: 27.5%
> 4th graders proficient in reading: 28% – 10th lowest (+2 ppt. from 2019)
> 8th graders proficient in reading: 27% – 14th lowest (-1 ppt. from 2019)
> Avg. annual per pupil spending in state: $11,800 – 25th lowest

8. Texas
> Avg. share of 4th and 8th graders proficient in reading: 26.5%
> 4th graders proficient in reading: 30% – 16th lowest (-2 ppt. from 2019)
> 8th graders proficient in reading: 23% – 6th lowest (-1 ppt. from 2019)
> Avg. annual per pupil spending in state: $9,697 – 8th lowest
[in-text-ad-2]

7. Mississippi
> Avg. share of 4th and 8th graders proficient in reading: 26.5%
> 4th graders proficient in reading: 31% – 23rd lowest (-2 ppt. from 2019)
> 8th graders proficient in reading: 22% – 5th lowest (-3 ppt. from 2019)
> Avg. annual per pupil spending in state: $9,303 – 6th lowest

6. Alaska
> Avg. share of 4th and 8th graders proficient in reading: 25%
> 4th graders proficient in reading: 24% – 4th lowest (-1 ppt. from 2019)
> 8th graders proficient in reading: 26% – 11th lowest (no change from 2019)
> Avg. annual per pupil spending in state: $18,393 – 4th highest
[in-text-ad]

5. Alabama
> Avg. share of 4th and 8th graders proficient in reading: 25%
> 4th graders proficient in reading: 28% – 10th lowest (+2 ppt. from 2019)
> 8th graders proficient in reading: 22% – 5th lowest (-3 ppt. from 2019)
> Avg. annual per pupil spending in state: $10,076 – 11th lowest
[recirclink id=1126628]
4. Delaware
> Avg. share of 4th and 8th graders proficient in reading: 24.5%
> 4th graders proficient in reading: 25% – 5th lowest (-9 ppt. from 2019)
> 8th graders proficient in reading: 24% – 7th lowest (-7 ppt. from 2019)
> Avg. annual per pupil spending in state: $15,910 – 11th highest
3. Oklahoma
> Avg. share of 4th and 8th graders proficient in reading: 22.5%
> 4th graders proficient in reading: 24% – 4th lowest (-8 ppt. from 2019)
> 8th graders proficient in reading: 21% – 2nd lowest (-7 ppt. from 2019)
> Avg. annual per pupil spending in state: $9,144 – 4th lowest
[in-text-ad-2]
2. West Virginia
> Avg. share of 4th and 8th graders proficient in reading: 22%
> 4th graders proficient in reading: 22% – 2nd lowest (-8 ppt. from 2019)
> 8th graders proficient in reading: 22% – 5th lowest (-6 ppt. from 2019)
> Avg. annual per pupil spending in state: $11,944 – 24th highest
1. New Mexico
> Avg. share of 4th and 8th graders proficient in reading: 19.5%
> 4th graders proficient in reading: 21% – the lowest (-5 ppt. from 2019)
> 8th graders proficient in reading: 18% – the lowest (-4 ppt. from 2019)
> Avg. annual per pupil spending in state: $10,167 – 15th lowest
Contact [email protected] for any questions or corrections.