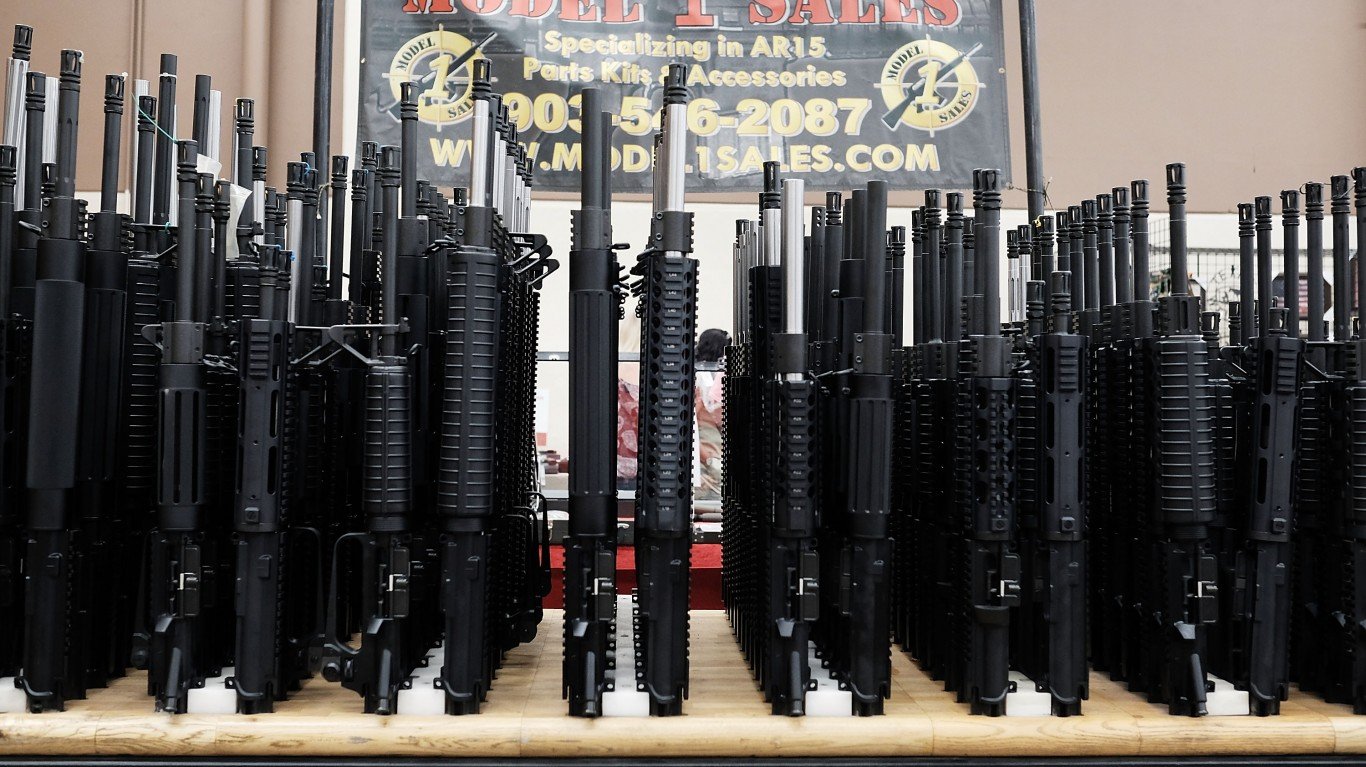
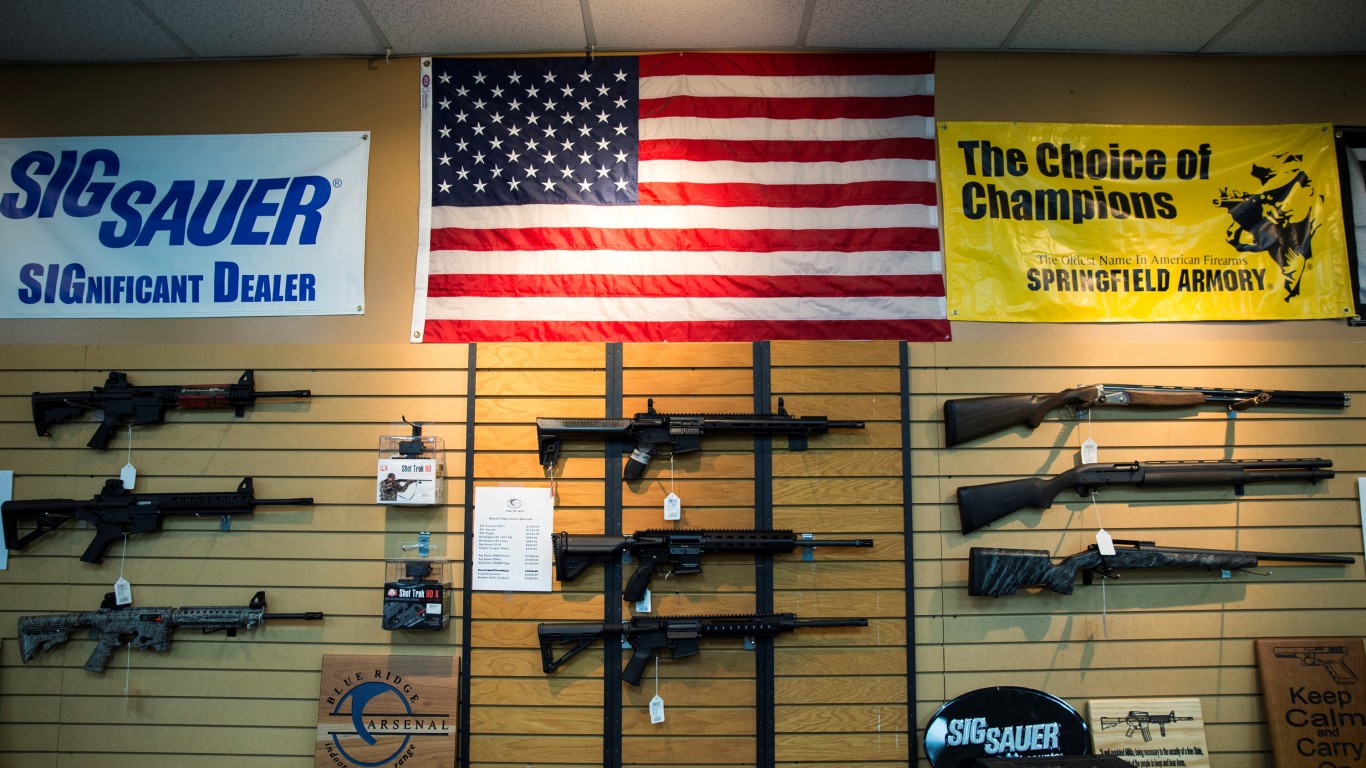
Gun sales trends in the U.S. can be measured in several ways and observed at both the national and the state levels. While raw sales is an important indicator, one of the most valuable yardsticks is gun sales per person. Such a measure allows for direct comparison between states, whether they are highly populated like California or Texas or less populated like Rhode Island and Wyoming.
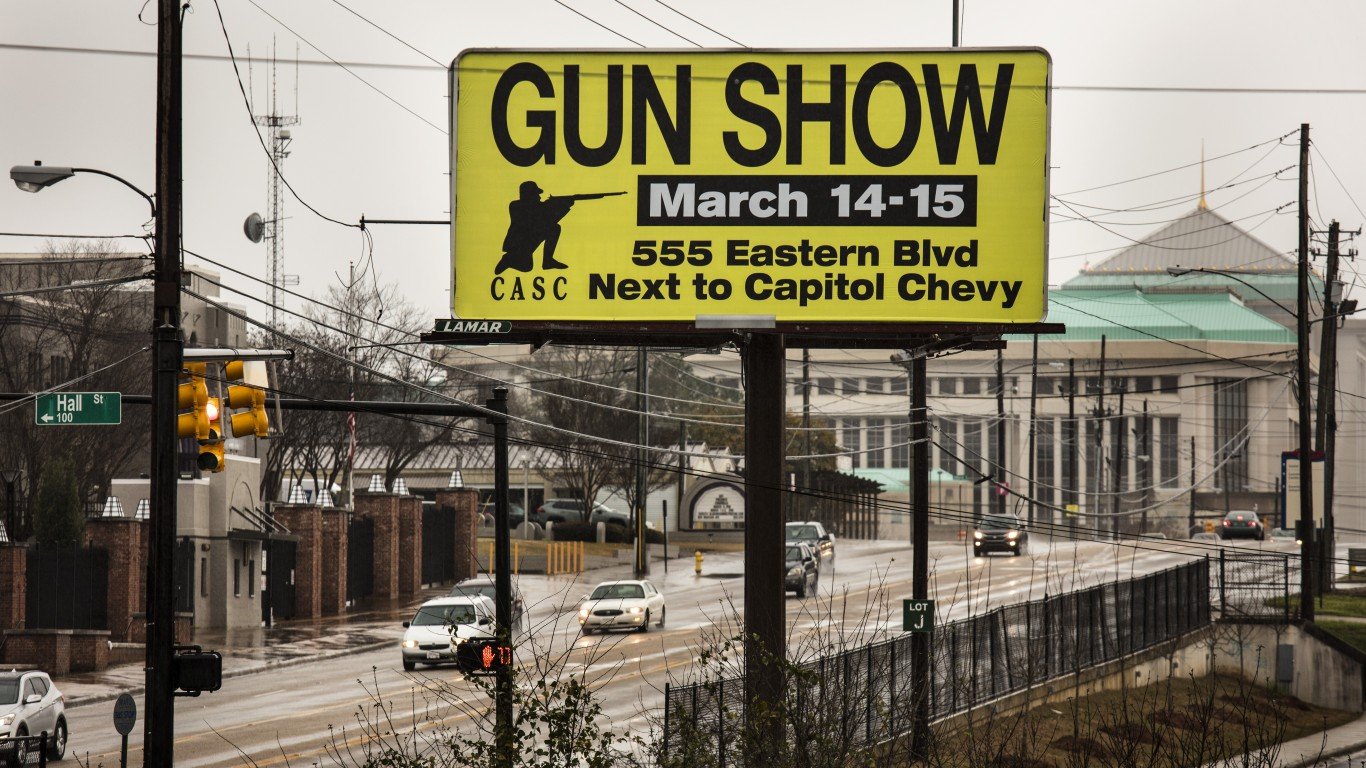
FBI data on background checks is the best available proxy of U.S. gun sales, even though private sales of firearms, including those at gun shows, are exempted from background checks in some states.
The FBI’s Investigation’s National Instant Criminal Background Check System publishes a monthly list of how many firearm background checks are conducted on potential gun buyers. Nearly everyone put through this system qualifies. Of the more than 400 million checks conducted since November 1998, there have only been 2.1 million denials. More than half of those who are denied have criminal records.
To find states with the most gun purchases per person, 24/7 Wall St. used FBI data from its National Instant Criminal Background Check System, ranking states based on gun background checks in the first 11 months of the year per 1,000 people in each state. Population data came from the Census Bureau and are one-year averages for 2021.
There is no definitive pattern of gun sales per person per state. However, states that have the highest numbers tend to be Southern and Mountain states. Among the top 10 by this measure are Kentucky, Tennessee, Utah, Alabama, Montana, and Idaho. (Also see, states where the most guns are stolen.)
One of the trends the background check data has shown recently is that gun sales have declined this year after a sharp jump in 2020 and the first part of 2021, followed by a return to the pre-2020 levels. Gun background checks in the first 11 months of this year have totaled 28,560,115. The figure will certainly top 30 million for 2022. In 2021, the full-year total was 38,876,673.
The recent decline in background checks to pre-pandemic levels does not negate the fact that the U.S. has extremely high gun sales compared to any other nation in the world. According to estimates from the 2018 Small Arms Survey, Americans own nearly 400 million guns. The total U.S. population count is under 332 million people. Americans’ use of guns in acts of violence is also extraordinarily high. According to the Gun Violence Archive, there have been 41,355 gun deaths this year. Of these, 622 were mass shootings. (Here are 28 guns used the most to commit crimes in America.)
Click here to see the states with the most gun purchases per person.
50. Hawaii
> Firearm background checks per 1,000 residents, Jan-Nov 2022: 12.0
> Firearm background checks per 1,000 residents, Jan-Nov 2021: 11.3 (the fewest)
> Firearm background checks Jan-Nov 2022: 17,280 (the fewest)
> Firearm background checks Jan-Nov 2021: 16,245 (the fewest)
> Change in background checks, first 11 months, year-to-date: +1,035 (+6.4% — 2nd largest increase)
> 2021 Population: 1,441,553 (11th smallest)
[in-text-ad]
49. New Jersey
> Firearm background checks per 1,000 residents, Jan-Nov 2022: 16.6
> Firearm background checks per 1,000 residents, Jan-Nov 2021: 22.6 (3rd fewest)
> Firearm background checks Jan-Nov 2022: 153,767 (14th fewest)
> Firearm background checks Jan-Nov 2021: 209,839 (17th fewest)
> Change in background checks, first 11 months, year-to-date: -56,072 (-26.7% — 5th largest decrease)
> 2021 Population: 9,267,130 (11th largest)
[recirclink id=1152324]
48. New York
> Firearm background checks per 1,000 residents, Jan-Nov 2022: 20.8
> Firearm background checks per 1,000 residents, Jan-Nov 2021: 21.5 (2nd fewest)
> Firearm background checks Jan-Nov 2022: 412,085 (23rd most)
> Firearm background checks Jan-Nov 2021: 425,778 (23rd most)
> Change in background checks, first 11 months, year-to-date: -13,693 (-3.2% — 3rd smallest decrease)
> 2021 Population: 19,835,913 (4th largest)
47. Rhode Island
> Firearm background checks per 1,000 residents, Jan-Nov 2022: 23.3
> Firearm background checks per 1,000 residents, Jan-Nov 2021: 32.1 (4th fewest)
> Firearm background checks Jan-Nov 2022: 25,478 (2nd fewest)
> Firearm background checks Jan-Nov 2021: 35,144 (2nd fewest)
> Change in background checks, first 11 months, year-to-date: -9,666 (-27.5% — 4th largest decrease)
> 2021 Population: 1,095,610 (7th smallest)
[in-text-ad-2]

46. Massachusetts
> Firearm background checks per 1,000 residents, Jan-Nov 2022: 29.9
> Firearm background checks per 1,000 residents, Jan-Nov 2021: 34.4 (6th fewest)
> Firearm background checks Jan-Nov 2022: 209,082 (19th fewest)
> Firearm background checks Jan-Nov 2021: 240,538 (18th fewest)
> Change in background checks, first 11 months, year-to-date: -31,456 (-13.1% — 12th smallest decrease)
> 2021 Population: 6,984,723 (15th largest)
45. California
> Firearm background checks per 1,000 residents, Jan-Nov 2022: 33.4
> Firearm background checks per 1,000 residents, Jan-Nov 2021: 34.4 (5th fewest)
> Firearm background checks Jan-Nov 2022: 1,310,450 (5th most)
> Firearm background checks Jan-Nov 2021: 1,351,076 (6th most)
> Change in background checks, first 11 months, year-to-date: -40,626 (-3.0% — 2nd smallest decrease)
> 2021 Population: 39,237,836 (the largest)
[in-text-ad]

44. Nebraska
> Firearm background checks per 1,000 residents, Jan-Nov 2022: 34.2
> Firearm background checks per 1,000 residents, Jan-Nov 2021: 42.0 (8th fewest)
> Firearm background checks Jan-Nov 2022: 67,206 (7th fewest)
> Firearm background checks Jan-Nov 2021: 82,564 (7th fewest)
> Change in background checks, first 11 months, year-to-date: -15,358 (-18.6% — 13th largest decrease)
> 2021 Population: 1,963,692 (14th smallest)
[recirclink id=1176845]
43. Nevada
> Firearm background checks per 1,000 residents, Jan-Nov 2022: 43.8
> Firearm background checks per 1,000 residents, Jan-Nov 2021: 54.7 (9th fewest)
> Firearm background checks Jan-Nov 2022: 137,670 (13th fewest)
> Firearm background checks Jan-Nov 2021: 171,980 (13th fewest)
> Change in background checks, first 11 months, year-to-date: -34,310 (-19.9% — 9th largest decrease)
> 2021 Population: 3,143,991 (19th smallest)

42. Maryland
> Firearm background checks per 1,000 residents, Jan-Nov 2022: 45.8
> Firearm background checks per 1,000 residents, Jan-Nov 2021: 39.9 (7th fewest)
> Firearm background checks Jan-Nov 2022: 282,613 (24th fewest)
> Firearm background checks Jan-Nov 2021: 246,090 (20th fewest)
> Change in background checks, first 11 months, year-to-date: +36,523 (+14.8% — the largest increase)
> 2021 Population: 6,165,129 (19th largest)
[in-text-ad-2]

41. Georgia
> Firearm background checks per 1,000 residents, Jan-Nov 2022: 49.4
> Firearm background checks per 1,000 residents, Jan-Nov 2021: 68.4 (14th fewest)
> Firearm background checks Jan-Nov 2022: 533,964 (17th most)
> Firearm background checks Jan-Nov 2021: 738,311 (14th most)
> Change in background checks, first 11 months, year-to-date: -204,347 (-27.7% — 3rd largest decrease)
> 2021 Population: 10,799,566 (8th largest)

40. Ohio
> Firearm background checks per 1,000 residents, Jan-Nov 2022: 50.1
> Firearm background checks per 1,000 residents, Jan-Nov 2021: 65.9 (12th fewest)
> Firearm background checks Jan-Nov 2022: 590,047 (14th most)
> Firearm background checks Jan-Nov 2021: 776,813 (13th most)
> Change in background checks, first 11 months, year-to-date: -186,766 (-24.0% — 6th largest decrease)
> 2021 Population: 11,780,017 (7th largest)
[in-text-ad]
39. North Carolina
> Firearm background checks per 1,000 residents, Jan-Nov 2022: 52.4
> Firearm background checks per 1,000 residents, Jan-Nov 2021: 67.9 (13th fewest)
> Firearm background checks Jan-Nov 2022: 552,472 (16th most)
> Firearm background checks Jan-Nov 2021: 716,542 (16th most)
> Change in background checks, first 11 months, year-to-date: -164,070 (-22.9% — 7th largest decrease)
> 2021 Population: 10,551,162 (9th largest)
[recirclink id=1172025]
38. Texas
> Firearm background checks per 1,000 residents, Jan-Nov 2022: 52.5
> Firearm background checks per 1,000 residents, Jan-Nov 2021: 60.8 (10th fewest)
> Firearm background checks Jan-Nov 2022: 1,550,694 (3rd most)
> Firearm background checks Jan-Nov 2021: 1,794,401 (3rd most)
> Change in background checks, first 11 months, year-to-date: -243,707 (-13.6% — 16th smallest decrease)
> 2021 Population: 29,527,941 (2nd largest)
37. Delaware
> Firearm background checks per 1,000 residents, Jan-Nov 2022: 53.2
> Firearm background checks per 1,000 residents, Jan-Nov 2021: 62.7 (11th fewest)
> Firearm background checks Jan-Nov 2022: 53,358 (4th fewest)
> Firearm background checks Jan-Nov 2021: 62,907 (4th fewest)
> Change in background checks, first 11 months, year-to-date: -9,549 (-15.2% — 22nd largest decrease)
> 2021 Population: 1,003,384 (6th smallest)
[in-text-ad-2]
36. Kansas
> Firearm background checks per 1,000 residents, Jan-Nov 2022: 58.1
> Firearm background checks per 1,000 residents, Jan-Nov 2021: 70.9 (16th fewest)
> Firearm background checks Jan-Nov 2022: 170,594 (16th fewest)
> Firearm background checks Jan-Nov 2021: 207,939 (16th fewest)
> Change in background checks, first 11 months, year-to-date: -37,345 (-18.0% — 16th largest decrease)
> 2021 Population: 2,934,582 (16th smallest)

35. Virginia
> Firearm background checks per 1,000 residents, Jan-Nov 2022: 58.6
> Firearm background checks per 1,000 residents, Jan-Nov 2021: 68.6 (15th fewest)
> Firearm background checks Jan-Nov 2022: 506,213 (18th most)
> Firearm background checks Jan-Nov 2021: 592,584 (18th most)
> Change in background checks, first 11 months, year-to-date: -86,371 (-14.6% — 20th smallest decrease)
> 2021 Population: 8,642,274 (12th largest)
[in-text-ad]
34. Connecticut
> Firearm background checks per 1,000 residents, Jan-Nov 2022: 59.0
> Firearm background checks per 1,000 residents, Jan-Nov 2021: 71.3 (18th fewest)
> Firearm background checks Jan-Nov 2022: 212,675 (21st fewest)
> Firearm background checks Jan-Nov 2021: 257,179 (22nd fewest)
> Change in background checks, first 11 months, year-to-date: -44,504 (-17.3% — 18th largest decrease)
> 2021 Population: 3,605,597 (22nd smallest)
[recirclink id=1153569]
33. Florida
> Firearm background checks per 1,000 residents, Jan-Nov 2022: 61.0
> Firearm background checks per 1,000 residents, Jan-Nov 2021: 71.7 (19th fewest)
> Firearm background checks Jan-Nov 2022: 1,328,944 (4th most)
> Firearm background checks Jan-Nov 2021: 1,560,757 (5th most)
> Change in background checks, first 11 months, year-to-date: -231,813 (-14.9% — 21st smallest decrease)
> 2021 Population: 21,781,128 (3rd largest)
32. Vermont
> Firearm background checks per 1,000 residents, Jan-Nov 2022: 62.4
> Firearm background checks per 1,000 residents, Jan-Nov 2021: 72.8 (20th fewest)
> Firearm background checks Jan-Nov 2022: 40,314 (3rd fewest)
> Firearm background checks Jan-Nov 2021: 46,966 (3rd fewest)
> Change in background checks, first 11 months, year-to-date: -6,652 (-14.2% — 18th smallest decrease)
> 2021 Population: 645,570 (2nd smallest)
[in-text-ad-2]
31. Iowa
> Firearm background checks per 1,000 residents, Jan-Nov 2022: 62.9
> Firearm background checks per 1,000 residents, Jan-Nov 2021: 77.0 (21st fewest)
> Firearm background checks Jan-Nov 2022: 200,953 (18th fewest)
> Firearm background checks Jan-Nov 2021: 245,795 (19th fewest)
> Change in background checks, first 11 months, year-to-date: -44,842 (-18.2% — 15th largest decrease)
> 2021 Population: 3,193,079 (20th smallest)
30. Louisiana
> Firearm background checks per 1,000 residents, Jan-Nov 2022: 66.1
> Firearm background checks per 1,000 residents, Jan-Nov 2021: 78.0 (22nd fewest)
> Firearm background checks Jan-Nov 2022: 305,856 (25th fewest)
> Firearm background checks Jan-Nov 2021: 360,707 (25th fewest)
> Change in background checks, first 11 months, year-to-date: -54,851 (-15.2% — 21st largest decrease)
> 2021 Population: 4,624,047 (25th largest)
[in-text-ad]
29. Arizona
> Firearm background checks per 1,000 residents, Jan-Nov 2022: 66.3
> Firearm background checks per 1,000 residents, Jan-Nov 2021: 70.9 (17th fewest)
> Firearm background checks Jan-Nov 2022: 482,158 (19th most)
> Firearm background checks Jan-Nov 2021: 515,778 (21st most)
> Change in background checks, first 11 months, year-to-date: -33,620 (-6.5% — 5th smallest decrease)
> 2021 Population: 7,276,316 (14th largest)
[recirclink id=1149324]
28. Arkansas
> Firearm background checks per 1,000 residents, Jan-Nov 2022: 69.7
> Firearm background checks per 1,000 residents, Jan-Nov 2021: 85.7 (25th most)
> Firearm background checks Jan-Nov 2022: 210,823 (20th fewest)
> Firearm background checks Jan-Nov 2021: 259,459 (23rd fewest)
> Change in background checks, first 11 months, year-to-date: -48,636 (-18.7% — 12th largest decrease)
> 2021 Population: 3,025,891 (18th smallest)

27. Michigan
> Firearm background checks per 1,000 residents, Jan-Nov 2022: 71.5
> Firearm background checks per 1,000 residents, Jan-Nov 2021: 88.9 (23rd most)
> Firearm background checks Jan-Nov 2022: 718,575 (11th most)
> Firearm background checks Jan-Nov 2021: 893,501 (9th most)
> Change in background checks, first 11 months, year-to-date: -174,926 (-19.6% — 10th largest decrease)
> 2021 Population: 10,050,811 (10th largest)
[in-text-ad-2]
26. South Carolina
> Firearm background checks per 1,000 residents, Jan-Nov 2022: 72.5
> Firearm background checks per 1,000 residents, Jan-Nov 2021: 85.4 (24th fewest)
> Firearm background checks Jan-Nov 2022: 376,413 (24th most)
> Firearm background checks Jan-Nov 2021: 443,095 (22nd most)
> Change in background checks, first 11 months, year-to-date: -66,682 (-15.0% — 23rd smallest decrease)
> 2021 Population: 5,190,705 (23rd largest)
25. New Mexico
> Firearm background checks per 1,000 residents, Jan-Nov 2022: 73.8
> Firearm background checks per 1,000 residents, Jan-Nov 2021: 83.7 (23rd fewest)
> Firearm background checks Jan-Nov 2022: 156,243 (15th fewest)
> Firearm background checks Jan-Nov 2021: 177,022 (14th fewest)
> Change in background checks, first 11 months, year-to-date: -20,779 (-11.7% — 8th smallest decrease)
> 2021 Population: 2,115,877 (15th smallest)
[in-text-ad]
24. Maine
> Firearm background checks per 1,000 residents, Jan-Nov 2022: 74.8
> Firearm background checks per 1,000 residents, Jan-Nov 2021: 85.5 (25th fewest)
> Firearm background checks Jan-Nov 2022: 102,677 (10th fewest)
> Firearm background checks Jan-Nov 2021: 117,261 (10th fewest)
> Change in background checks, first 11 months, year-to-date: -14,584 (-12.4% — 11th smallest decrease)
> 2021 Population: 1,372,247 (9th smallest)
[recirclink id=1152324]
23. Missouri
> Firearm background checks per 1,000 residents, Jan-Nov 2022: 76.6
> Firearm background checks per 1,000 residents, Jan-Nov 2021: 92.9 (22nd most)
> Firearm background checks Jan-Nov 2022: 472,720 (21st most)
> Firearm background checks Jan-Nov 2021: 572,875 (20th most)
> Change in background checks, first 11 months, year-to-date: -100,155 (-17.5% — 17th largest decrease)
> 2021 Population: 6,168,187 (18th largest)

22. Oklahoma
> Firearm background checks per 1,000 residents, Jan-Nov 2022: 82.3
> Firearm background checks per 1,000 residents, Jan-Nov 2021: 93.6 (21st most)
> Firearm background checks Jan-Nov 2022: 328,142 (25th most)
> Firearm background checks Jan-Nov 2021: 373,193 (25th most)
> Change in background checks, first 11 months, year-to-date: -45,051 (-12.1% — 10th smallest decrease)
> 2021 Population: 3,986,639 (23rd smallest)
[in-text-ad-2]

21. Colorado
> Firearm background checks per 1,000 residents, Jan-Nov 2022: 82.5
> Firearm background checks per 1,000 residents, Jan-Nov 2021: 98.8 (17th most)
> Firearm background checks Jan-Nov 2022: 479,434 (20th most)
> Firearm background checks Jan-Nov 2021: 574,023 (19th most)
> Change in background checks, first 11 months, year-to-date: -94,589 (-16.5% — 20th largest decrease)
> 2021 Population: 5,812,069 (21st largest)
20. Washington
> Firearm background checks per 1,000 residents, Jan-Nov 2022: 83.9
> Firearm background checks per 1,000 residents, Jan-Nov 2021: 86.3 (24th most)
> Firearm background checks Jan-Nov 2022: 648,978 (13th most)
> Firearm background checks Jan-Nov 2021: 667,831 (17th most)
> Change in background checks, first 11 months, year-to-date: -18,853 (-2.8% — the smallest decrease)
> 2021 Population: 7,738,692 (13th largest)
[in-text-ad]
19. Mississippi
> Firearm background checks per 1,000 residents, Jan-Nov 2022: 84.4
> Firearm background checks per 1,000 residents, Jan-Nov 2021: 97.2 (19th most)
> Firearm background checks Jan-Nov 2022: 249,071 (23rd fewest)
> Firearm background checks Jan-Nov 2021: 286,796 (24th fewest)
> Change in background checks, first 11 months, year-to-date: -37,725 (-13.2% — 13th smallest decrease)
> 2021 Population: 2,949,965 (17th smallest)
[recirclink id=1176845]
18. Pennsylvania
> Firearm background checks per 1,000 residents, Jan-Nov 2022: 85.9
> Firearm background checks per 1,000 residents, Jan-Nov 2021: 99.3 (16th most)
> Firearm background checks Jan-Nov 2022: 1,113,769 (6th most)
> Firearm background checks Jan-Nov 2021: 1,287,678 (7th most)
> Change in background checks, first 11 months, year-to-date: -173,909 (-13.5% — 15th smallest decrease)
> 2021 Population: 12,964,056 (5th largest)
17. North Dakota
> Firearm background checks per 1,000 residents, Jan-Nov 2022: 86.0
> Firearm background checks per 1,000 residents, Jan-Nov 2021: 95.5 (20th most)
> Firearm background checks Jan-Nov 2022: 66,638 (6th fewest)
> Firearm background checks Jan-Nov 2021: 73,996 (5th fewest)
> Change in background checks, first 11 months, year-to-date: -7,358 (-9.9% — 7th smallest decrease)
> 2021 Population: 774,948 (4th smallest)
[in-text-ad-2]
16. New Hampshire
> Firearm background checks per 1,000 residents, Jan-Nov 2022: 86.4
> Firearm background checks per 1,000 residents, Jan-Nov 2021: 99.9 (15th most)
> Firearm background checks Jan-Nov 2022: 120,024 (11th fewest)
> Firearm background checks Jan-Nov 2021: 138,693 (11th fewest)
> Change in background checks, first 11 months, year-to-date: -18,669 (-13.5% — 14th smallest decrease)
> 2021 Population: 1,388,992 (10th smallest)
15. South Dakota
> Firearm background checks per 1,000 residents, Jan-Nov 2022: 89.1
> Firearm background checks per 1,000 residents, Jan-Nov 2021: 109.3 (14th most)
> Firearm background checks Jan-Nov 2022: 79,773 (9th fewest)
> Firearm background checks Jan-Nov 2021: 97,847 (9th fewest)
> Change in background checks, first 11 months, year-to-date: -18,074 (-18.5% — 14th largest decrease)
> 2021 Population: 895,376 (5th smallest)
[in-text-ad]
14. West Virginia
> Firearm background checks per 1,000 residents, Jan-Nov 2022: 95.7
> Firearm background checks per 1,000 residents, Jan-Nov 2021: 112.8 (13th most)
> Firearm background checks Jan-Nov 2022: 170,716 (17th fewest)
> Firearm background checks Jan-Nov 2021: 201,157 (15th fewest)
> Change in background checks, first 11 months, year-to-date: -30,441 (-15.1% — 23rd largest decrease)
> 2021 Population: 1,782,959 (12th smallest)
[recirclink id=1172025]
13. Wisconsin
> Firearm background checks per 1,000 residents, Jan-Nov 2022: 98.3
> Firearm background checks per 1,000 residents, Jan-Nov 2021: 122.1 (11th most)
> Firearm background checks Jan-Nov 2022: 579,536 (15th most)
> Firearm background checks Jan-Nov 2021: 719,957 (15th most)
> Change in background checks, first 11 months, year-to-date: -140,421 (-19.5% — 11th largest decrease)
> 2021 Population: 5,895,908 (20th largest)

12. Oregon
> Firearm background checks per 1,000 residents, Jan-Nov 2022: 98.8
> Firearm background checks per 1,000 residents, Jan-Nov 2021: 97.7 (18th most)
> Firearm background checks Jan-Nov 2022: 419,405 (22nd most)
> Firearm background checks Jan-Nov 2021: 414,935 (24th most)
> Change in background checks, first 11 months, year-to-date: +4,470 (+1.1% — 4th largest increase)
> 2021 Population: 4,246,155 (24th smallest)
[in-text-ad-2]
11. Alaska
> Firearm background checks per 1,000 residents, Jan-Nov 2022: 106.2
> Firearm background checks per 1,000 residents, Jan-Nov 2021: 114.1 (12th most)
> Firearm background checks Jan-Nov 2022: 77,781 (8th fewest)
> Firearm background checks Jan-Nov 2021: 83,567 (8th fewest)
> Change in background checks, first 11 months, year-to-date: -5,786 (-6.9% — 6th smallest decrease)
> 2021 Population: 732,673 (3rd smallest)
10. Tennessee
> Firearm background checks per 1,000 residents, Jan-Nov 2022: 107.6
> Firearm background checks per 1,000 residents, Jan-Nov 2021: 125.0 (10th most)
> Firearm background checks Jan-Nov 2022: 750,844 (10th most)
> Firearm background checks Jan-Nov 2021: 871,590 (11th most)
> Change in background checks, first 11 months, year-to-date: -120,746 (-13.9% — 17th smallest decrease)
> 2021 Population: 6,975,218 (16th largest)
[in-text-ad]

9. Wyoming
> Firearm background checks per 1,000 residents, Jan-Nov 2022: 109.2
> Firearm background checks per 1,000 residents, Jan-Nov 2021: 131.6 (8th most)
> Firearm background checks Jan-Nov 2022: 63,193 (5th fewest)
> Firearm background checks Jan-Nov 2021: 76,182 (6th fewest)
> Change in background checks, first 11 months, year-to-date: -12,989 (-17.0% — 19th largest decrease)
> 2021 Population: 578,803 (the smallest)
[recirclink id=1153569]
8. Idaho
> Firearm background checks per 1,000 residents, Jan-Nov 2022: 112.4
> Firearm background checks per 1,000 residents, Jan-Nov 2021: 131.0 (9th most)
> Firearm background checks Jan-Nov 2022: 213,617 (22nd fewest)
> Firearm background checks Jan-Nov 2021: 248,986 (21st fewest)
> Change in background checks, first 11 months, year-to-date: -35,369 (-14.2% — 19th smallest decrease)
> 2021 Population: 1,900,923 (13th smallest)
7. Montana
> Firearm background checks per 1,000 residents, Jan-Nov 2022: 116.3
> Firearm background checks per 1,000 residents, Jan-Nov 2021: 132.1 (7th most)
> Firearm background checks Jan-Nov 2022: 128,413 (12th fewest)
> Firearm background checks Jan-Nov 2021: 145,842 (12th fewest)
> Change in background checks, first 11 months, year-to-date: -17,429 (-12.0% — 9th smallest decrease)
> 2021 Population: 1,104,271 (8th smallest)
[in-text-ad-2]
6. Alabama
> Firearm background checks per 1,000 residents, Jan-Nov 2022: 131.0
> Firearm background checks per 1,000 residents, Jan-Nov 2021: 169.5 (5th most)
> Firearm background checks Jan-Nov 2022: 660,214 (12th most)
> Firearm background checks Jan-Nov 2021: 854,080 (12th most)
> Change in background checks, first 11 months, year-to-date: -193,866 (-22.7% — 8th largest decrease)
> 2021 Population: 5,039,877 (24th largest)
5. Minnesota
> Firearm background checks per 1,000 residents, Jan-Nov 2022: 143.9
> Firearm background checks per 1,000 residents, Jan-Nov 2021: 153.1 (6th most)
> Firearm background checks Jan-Nov 2022: 821,401 (9th most)
> Firearm background checks Jan-Nov 2021: 873,639 (10th most)
> Change in background checks, first 11 months, year-to-date: -52,238 (-6.0% — 4th smallest decrease)
> 2021 Population: 5,707,390 (22nd largest)
[in-text-ad]
4. Indiana
> Firearm background checks per 1,000 residents, Jan-Nov 2022: 149.8
> Firearm background checks per 1,000 residents, Jan-Nov 2021: 249.5 (4th most)
> Firearm background checks Jan-Nov 2022: 1,019,443 (7th most)
> Firearm background checks Jan-Nov 2021: 1,698,198 (4th most)
> Change in background checks, first 11 months, year-to-date: -678,755 (-40.0% — 2nd largest decrease)
> 2021 Population: 6,805,985 (17th largest)
[recirclink id=1149324]

3. Utah
> Firearm background checks per 1,000 residents, Jan-Nov 2022: 277.6
> Firearm background checks per 1,000 residents, Jan-Nov 2021: 326.6 (3rd most)
> Firearm background checks Jan-Nov 2022: 926,635 (8th most)
> Firearm background checks Jan-Nov 2021: 1,090,028 (8th most)
> Change in background checks, first 11 months, year-to-date: -163,393 (-15.0% — 22nd smallest decrease)
> 2021 Population: 3,337,975 (21st smallest)
2. Illinois
> Firearm background checks per 1,000 residents, Jan-Nov 2022: 315.6
> Firearm background checks per 1,000 residents, Jan-Nov 2021: 634.2 (2nd most)
> Firearm background checks Jan-Nov 2022: 3,998,754 (the most)
> Firearm background checks Jan-Nov 2021: 8,036,858 (the most)
> Change in background checks, first 11 months, year-to-date: -4,038,104 (-50.2% — the largest decrease)
> 2021 Population: 12,671,469 (6th largest)
[in-text-ad-2]
1. Kentucky
> Firearm background checks per 1,000 residents, Jan-Nov 2022: 815.6
> Firearm background checks per 1,000 residents, Jan-Nov 2021: 770.2 (the most)
> Firearm background checks Jan-Nov 2022: 3,677,885 (2nd most)
> Firearm background checks Jan-Nov 2021: 3,473,035 (2nd most)
> Change in background checks, first 11 months, year-to-date: +204,850 (+5.9% — 3rd largest increase)
> 2021 Population: 4,509,394 (25th smallest)
Contact [email protected] for any questions or corrections.