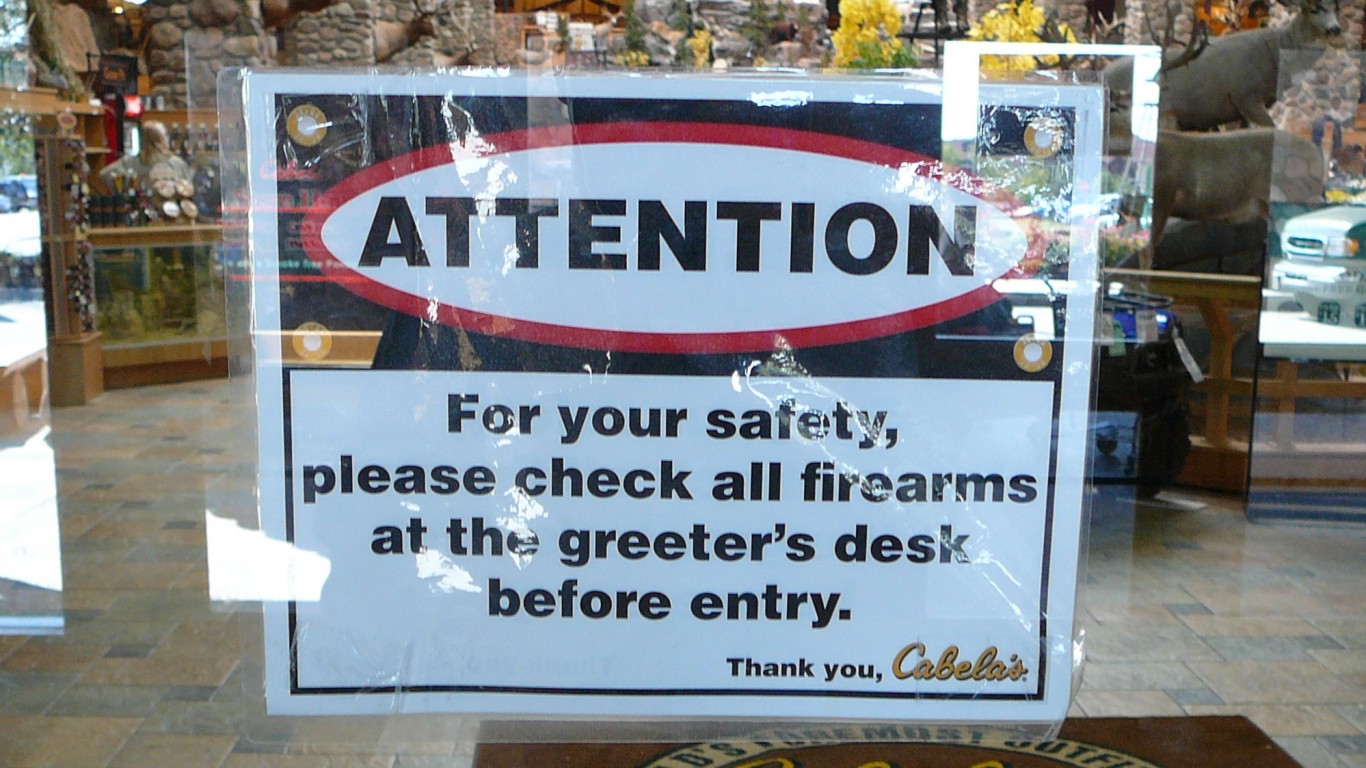
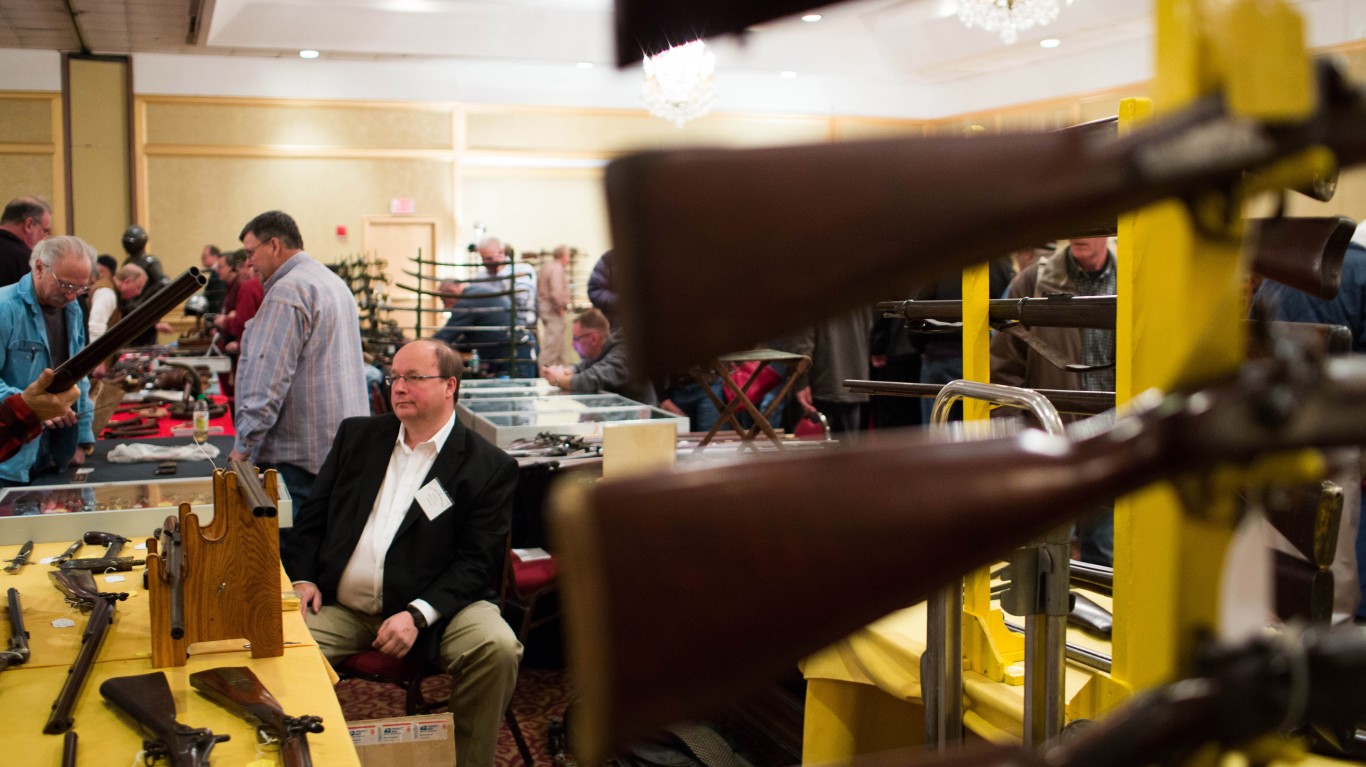
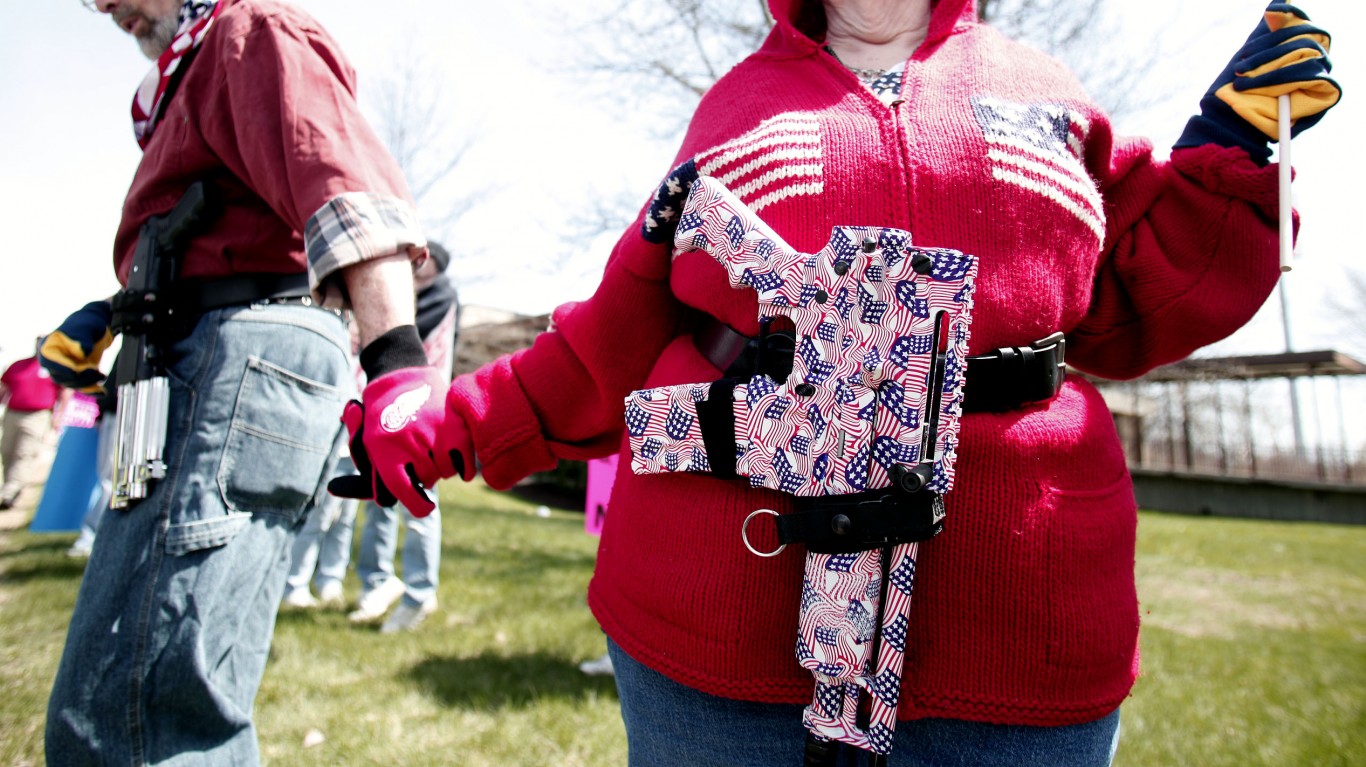
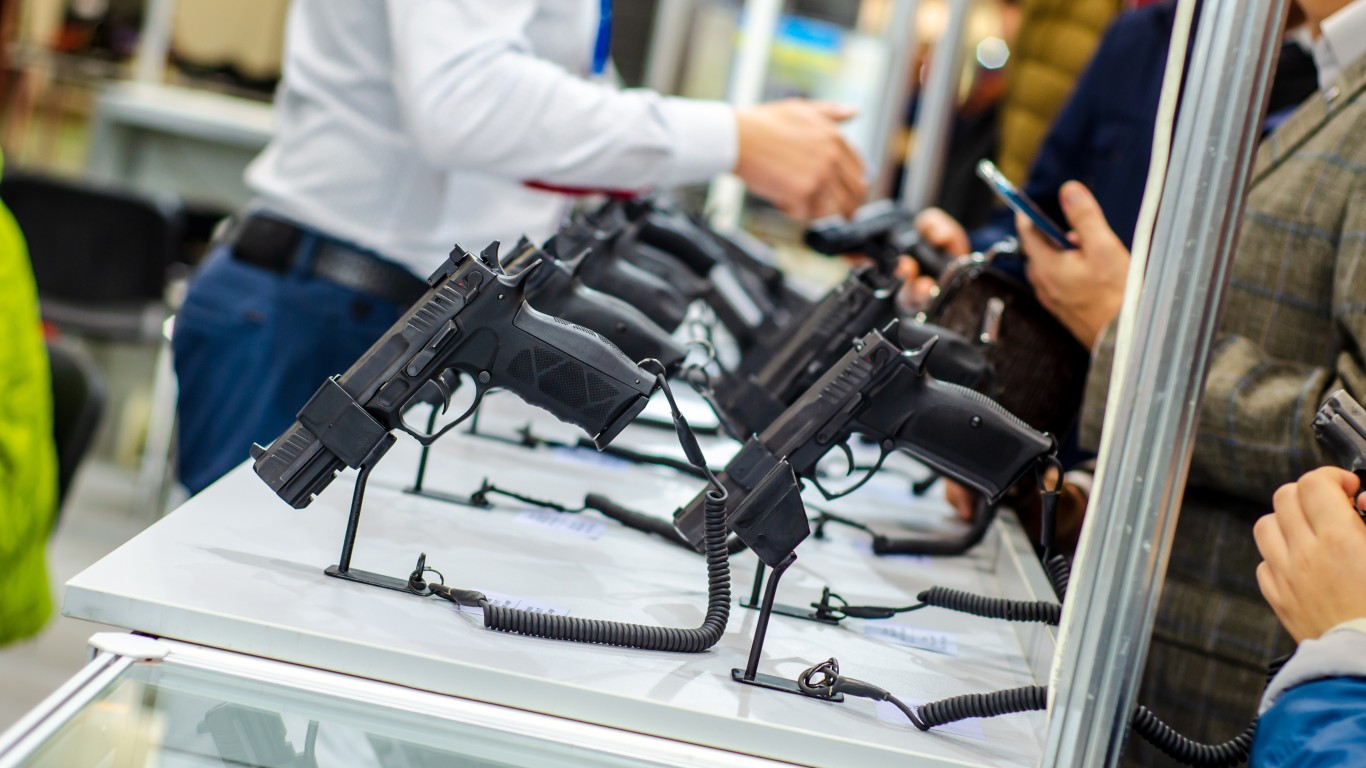
The Bureau of Alcohol, Tobacco, Firearms, and Explosives has so far revoked the licenses of 122 firearms dealers this year. For comparison, the ATF revoked 90 gun dealer licenses in 2022, and just 27 in 2021. Since elected into office, President Joe Biden has acted on behalf of gun control advocates, including signing the Safer Communities Act last year and issuing an executive order in march to increase background checks conducted. The administration’s policies are likely contributing to the ATF’s increased enforcement.
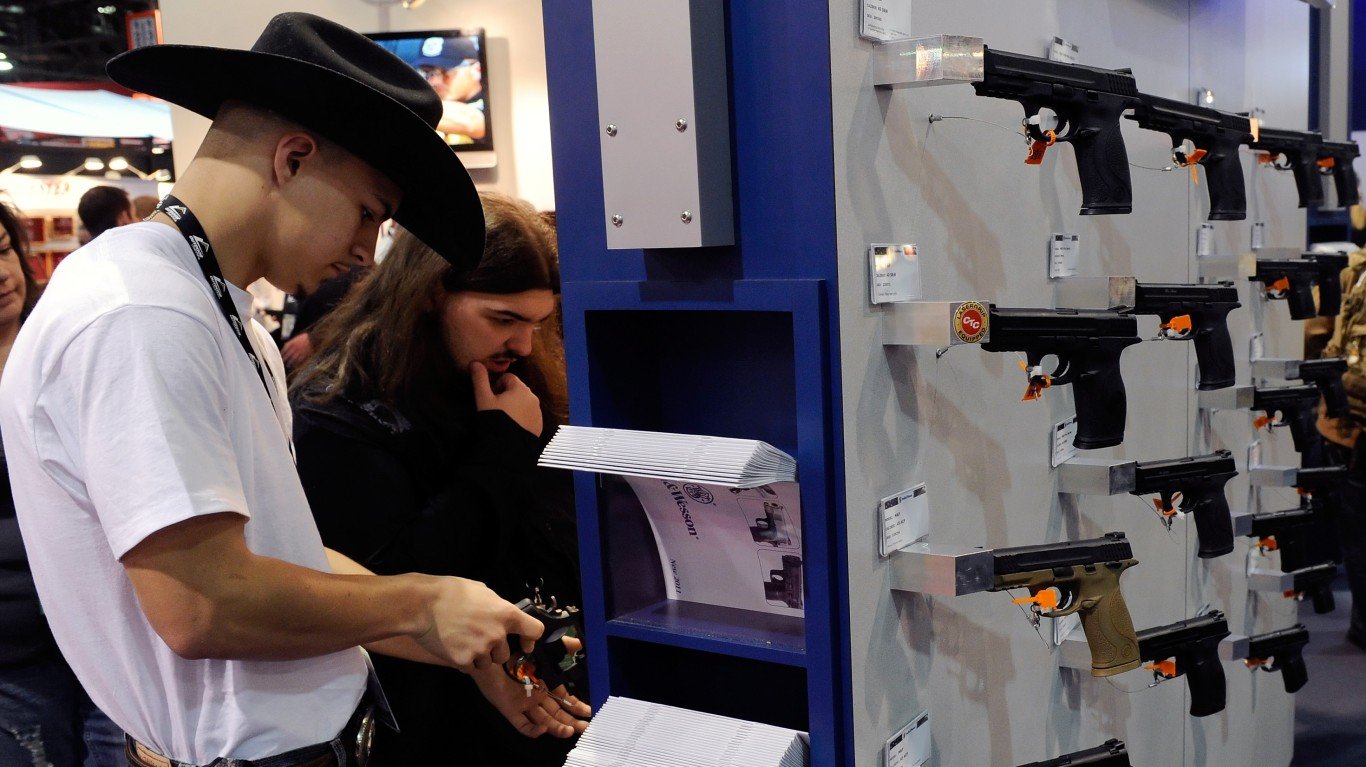
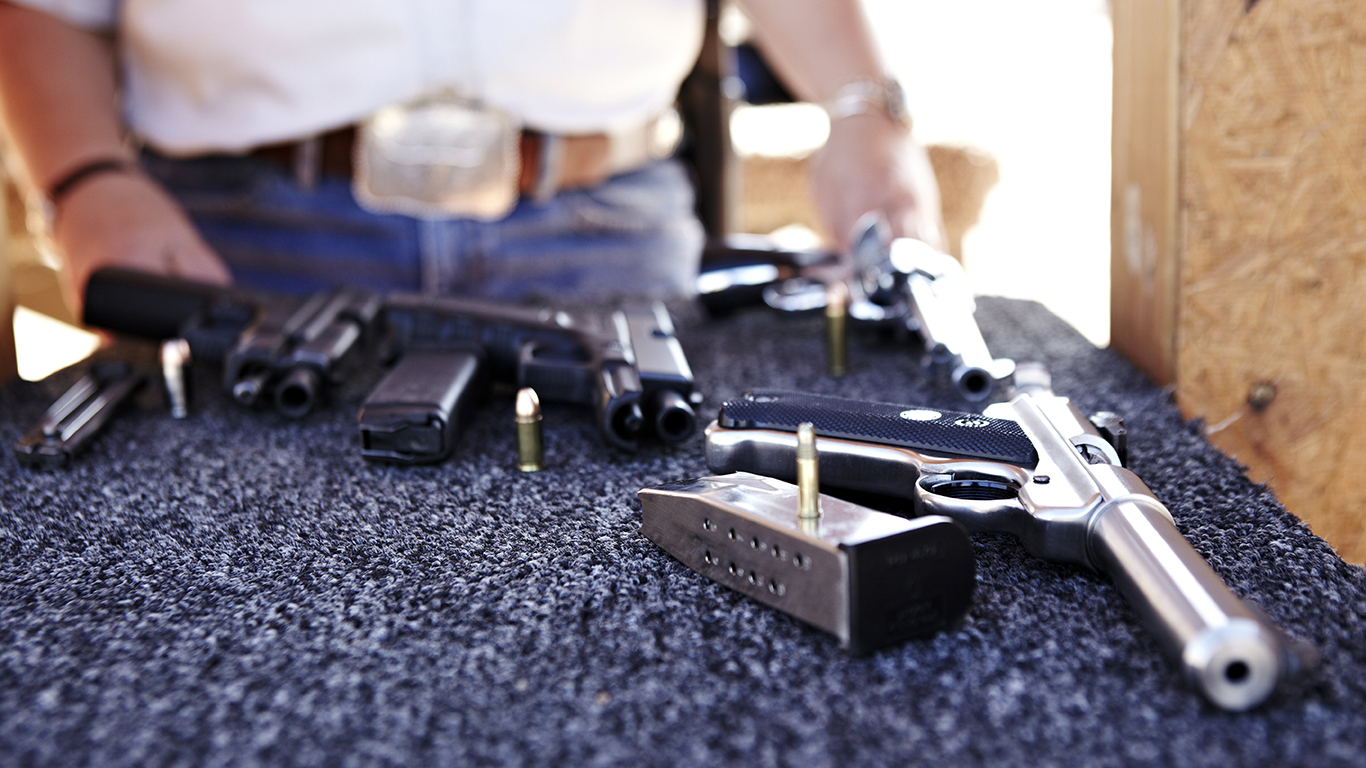
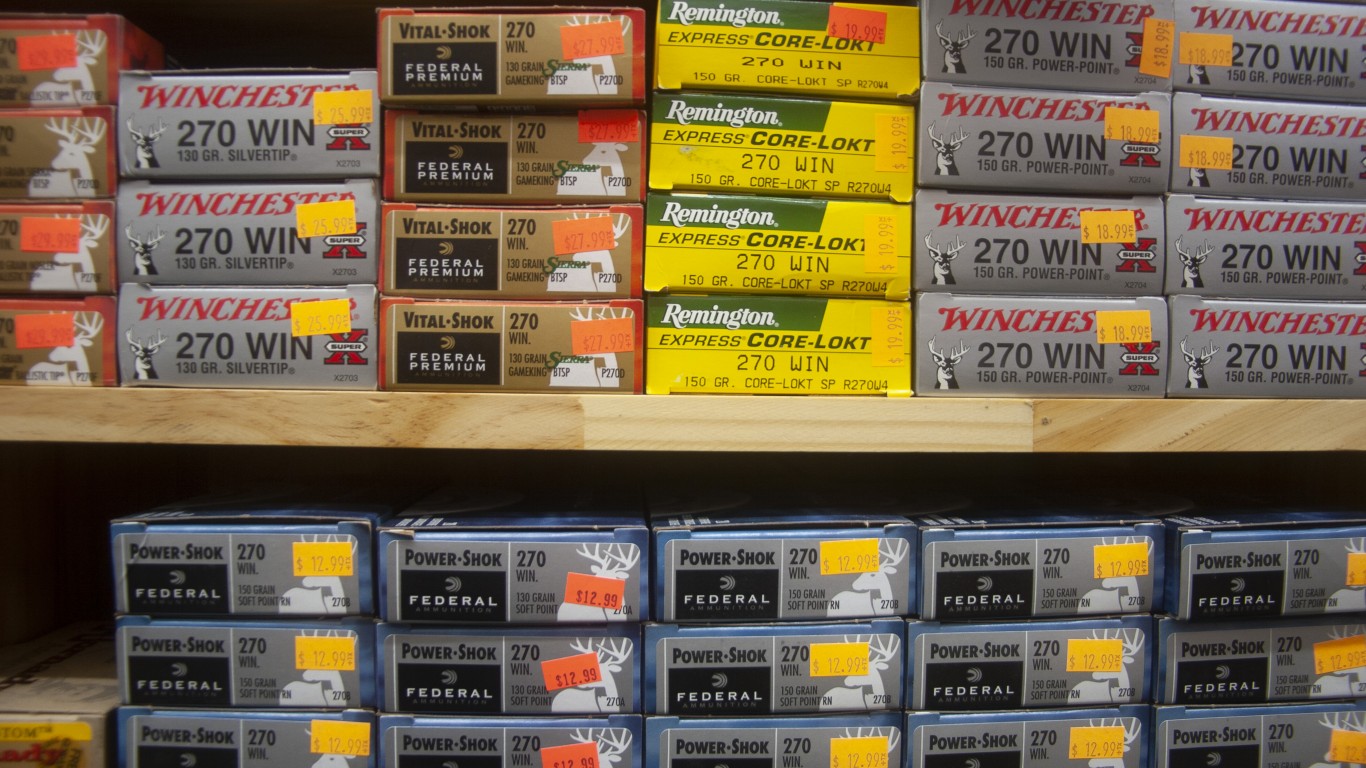
Because there is no official, publicly accessible firearm sales database, FBI background checks — while not an exact reflection — are the best approximation of gun sales in the United States, especially of trends. There were just over 2 million background checks initiated for the sale of a firearm in July 2023 — the fewest in more than four years. (Also read: states where the most people have bought guns so far in 2023.)
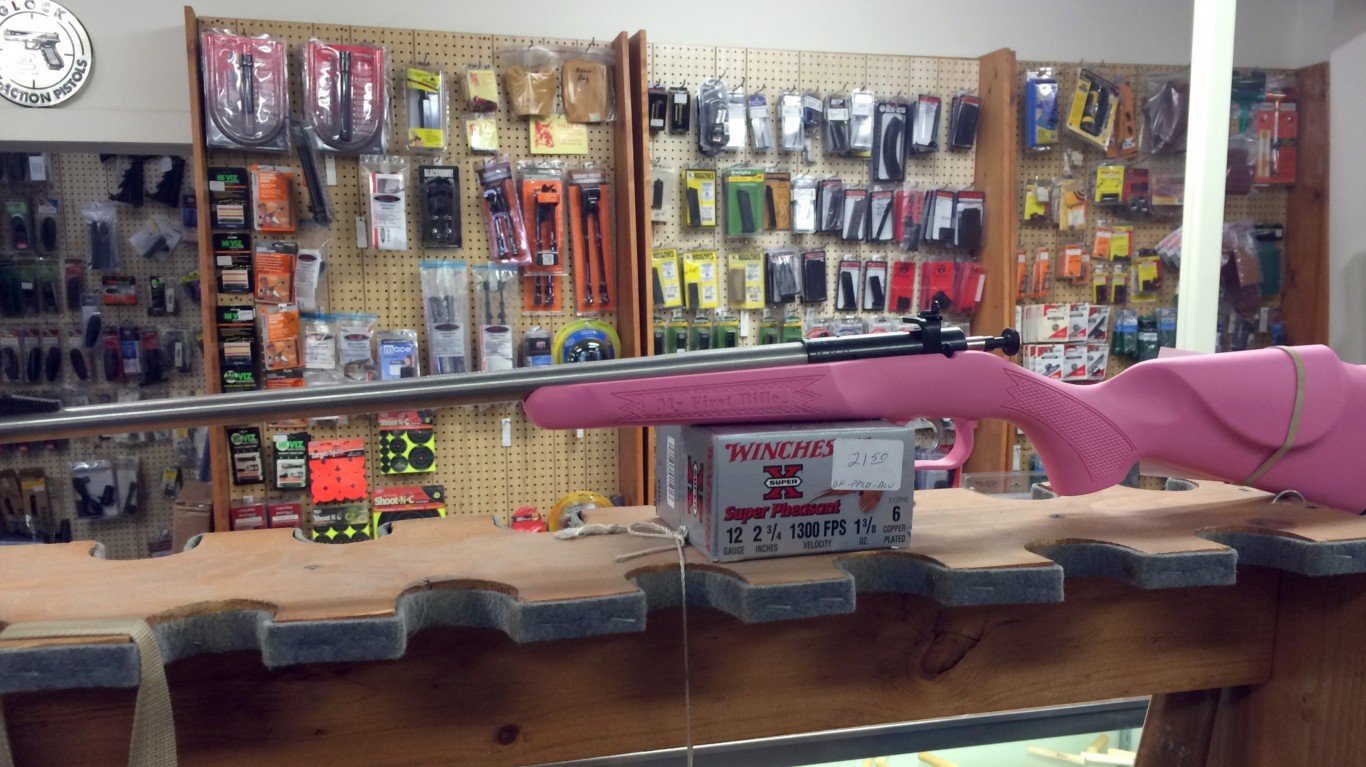
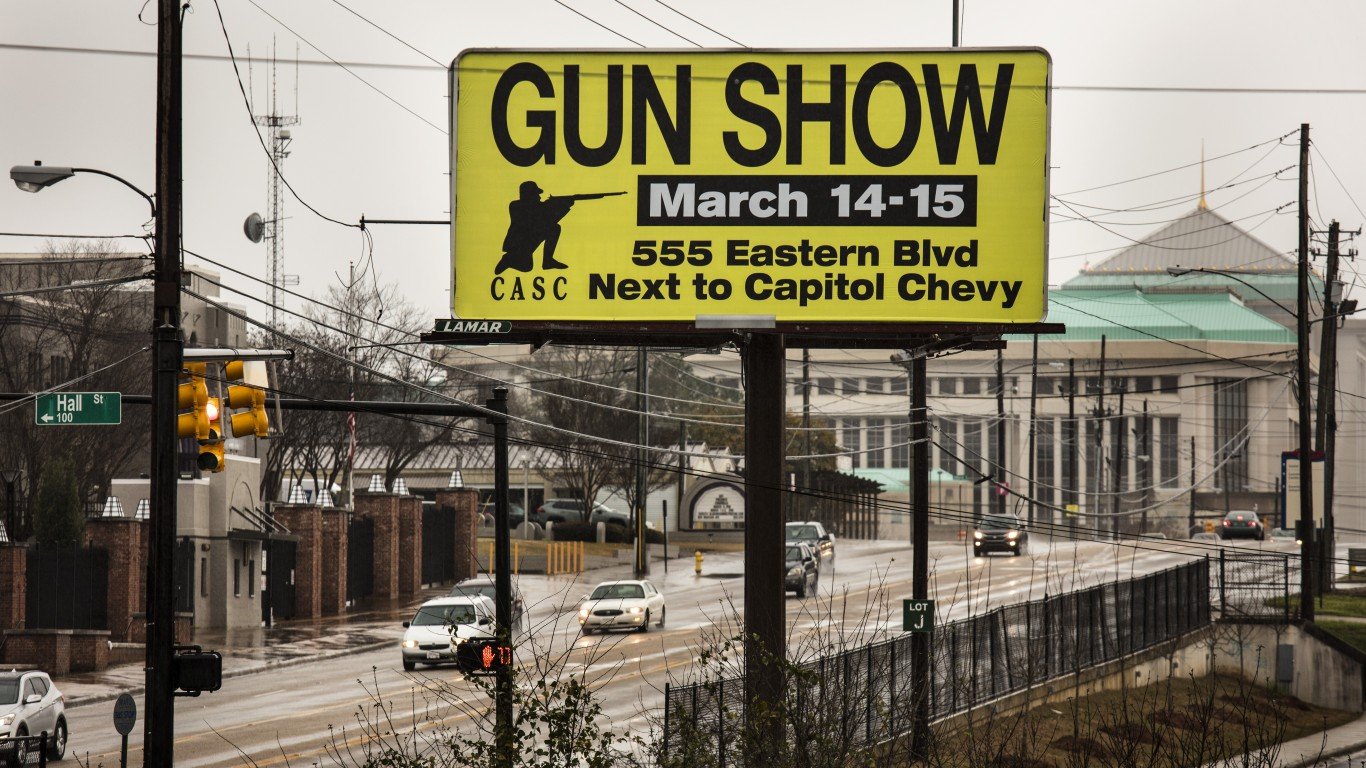
In the past few years, in addition to the federal policies pushed by the Biden administration, a number of states have implemented stricter gun control laws, many of which intended to increase the incidence of background checks. Whether or not new regulations contributed to the decline in gun sales (as estimated by background checks) remains unclear.
To identify the states where gun sales are decreasing fastest, 24/7 Wall St. used data from the FBI’s National Instant Criminal Background Check System, looking at the states with the largest percentage decrease in adjusted-firearm background checks from July 2022 to July 2023. To reach a more accurate approximation of gun sales, we adjusted background check figures by excluding checks for such categories as pawn shop transactions, returns, rentals, and rechecks (which are conducted periodically by some states on existing permit holders).
Nationwide, adjusted background checks declined by 17% from July 2022 to July 2023. Of the 50 states, 48 reported a year-over-year decline in sales in July. We listed the states from those with the largest percent increase to those with the highest decrease. (Also check out: states where gun deaths are increasing fastest.)
Several of the states reporting the largest apparent declines in gun sales were already relatively unpopular places to buy them. New York, New Jersey, and Hawaii, which were the three states with the fewest background checks per capita last July, each reported more than a 20% decline over the past year, remaining the three states with the fewest checks. All three states have relatively strict gun control laws, with each ranking in the top five for gun law strength, according to the Giffords Law Center’s annual scorecard.
Not all the states reporting steep declines in background checks are unpopular places for guns. In July 2022, Alabama reported over 50,000 background checks likely tied to a gun sale, which came to 10 checks per 1,000 state residents, the most of any state. This July, Alabama only reported 36,000 checks, a 27% decline, moving it from first to fifth in checks per capita. (These are the states where the most people bought guns last month.)
Click here to see where gun sales fell the fastest last month, all 50 states ranked.
Click here to read our detailed methodology.
50. North Carolina
> Change in background checks, July 2022-July 2023: +14.2% (+5,795 — the largest increase)
> Firearm background checks, July 2023: 46,480 — 7th most
> Firearm background checks, July 2022: 40,685 — 14th most
> Firearm background checks per 1,000 residents, July 2023: 4.3 — 25th fewest
> Firearm background checks per 1,000 residents, July 2022: 3.8 — 13th fewest
> Most common type of firearm check, July 2023: Handguns
> 2022 population: 10.7 million — 9th largest
[in-text-ad]

49. Nebraska
> Change in background checks, July 2022-July 2023: +0.9% (+43 — the smallest increase)
> Firearm background checks, July 2023: 4,720 — 8th fewest
> Firearm background checks, July 2022: 4,677 — 5th fewest
> Firearm background checks per 1,000 residents, July 2023: 2.4 — 6th fewest
> Firearm background checks per 1,000 residents, July 2022: 2.4 — 5th fewest
> Most common type of firearm check, July 2023: Long guns
> 2022 population: 2.0 million — 14th smallest
[recirclink id=1302834]
48. Idaho
> Change in background checks, July 2022-July 2023: -2.3% (-410 — 3rd smallest decrease)
> Firearm background checks, July 2023: 17,284 — 25th fewest
> Firearm background checks, July 2022: 17,694 — 22nd fewest
> Firearm background checks per 1,000 residents, July 2023: 8.9 — the most
> Firearm background checks per 1,000 residents, July 2022: 9.1 — 2nd most
> Most common type of firearm check, July 2023: Handguns
> 2022 population: 1.9 million — 13th smallest
47. Utah
> Change in background checks, July 2022-July 2023: -3.3% (-682 — 6th smallest decrease)
> Firearm background checks, July 2023: 19,834 — 25th most
> Firearm background checks, July 2022: 20,516 — 25th fewest
> Firearm background checks per 1,000 residents, July 2023: 5.9 — 11th most
> Firearm background checks per 1,000 residents, July 2022: 6.1 — 18th most
> Most common type of firearm check, July 2023: Handguns
> 2022 population: 3.4 million — 21st smallest
[in-text-ad-2]
46. Delaware
> Change in background checks, July 2022-July 2023: -4.2% (-149 — the smallest decrease)
> Firearm background checks, July 2023: 3,410 — 4th fewest
> Firearm background checks, July 2022: 3,559 — 4th fewest
> Firearm background checks per 1,000 residents, July 2023: 3.3 — 13th fewest
> Firearm background checks per 1,000 residents, July 2022: 3.5 — 10th fewest
> Most common type of firearm check, July 2023: Handguns
> 2022 population: 1.0 million — 6th smallest
45. Arkansas
> Change in background checks, July 2022-July 2023: -5.2% (-739 — 7th smallest decrease)
> Firearm background checks, July 2023: 13,363 — 21st fewest
> Firearm background checks, July 2022: 14,102 — 18th fewest
> Firearm background checks per 1,000 residents, July 2023: 4.4 — 25th most
> Firearm background checks per 1,000 residents, July 2022: 4.6 — 18th fewest
> Most common type of firearm check, July 2023: Handguns
> 2022 population: 3.0 million — 18th smallest
[in-text-ad]
44. Kansas
> Change in background checks, July 2022-July 2023: -6.3% (-820 — 8th smallest decrease)
> Firearm background checks, July 2023: 12,157 — 18th fewest
> Firearm background checks, July 2022: 12,977 — 17th fewest
> Firearm background checks per 1,000 residents, July 2023: 4.1 — 21st fewest
> Firearm background checks per 1,000 residents, July 2022: 4.4 — 17th fewest
> Most common type of firearm check, July 2023: Handguns
> 2022 population: 2.9 million — 16th smallest
[recirclink id=1302769]

43. Maryland
> Change in background checks, July 2022-July 2023: -6.7% (-1,418 — 16th smallest decrease)
> Firearm background checks, July 2023: 19,903 — 24th most
> Firearm background checks, July 2022: 21,321 — 25th most
> Firearm background checks per 1,000 residents, July 2023: 3.2 — 10th fewest
> Firearm background checks per 1,000 residents, July 2022: 3.5 — 9th fewest
> Most common type of firearm check, July 2023: Handguns
> 2022 population: 6.2 million — 19th largest

42. Montana
> Change in background checks, July 2022-July 2023: -9.1% (-880 — 9th smallest decrease)
> Firearm background checks, July 2023: 8,835 — 12th fewest
> Firearm background checks, July 2022: 9,715 — 12th fewest
> Firearm background checks per 1,000 residents, July 2023: 7.9 — 2nd most
> Firearm background checks per 1,000 residents, July 2022: 8.7 — 4th most
> Most common type of firearm check, July 2023: Handguns
> 2022 population: 1.1 million — 8th smallest
[in-text-ad-2]
41. California
> Change in background checks, July 2022-July 2023: -10.5% (-11,070 — 9th largest decrease)
> Firearm background checks, July 2023: 94,115 — 3rd most
> Firearm background checks, July 2022: 105,185 — 3rd most
> Firearm background checks per 1,000 residents, July 2023: 2.4 — 7th fewest
> Firearm background checks per 1,000 residents, July 2022: 2.7 — 7th fewest
> Most common type of firearm check, July 2023: Handguns
> 2022 population: 39.0 million — the largest

40. Massachusetts
> Change in background checks, July 2022-July 2023: -10.5% (-2,006 — 21st smallest decrease)
> Firearm background checks, July 2023: 17,024 — 24th fewest
> Firearm background checks, July 2022: 19,030 — 24th fewest
> Firearm background checks per 1,000 residents, July 2023: 2.4 — 8th fewest
> Firearm background checks per 1,000 residents, July 2022: 2.7 — 8th fewest
> Most common type of firearm check, July 2023: Handguns
> 2022 population: 7.0 million — 16th largest
[in-text-ad]
39. Nevada
> Change in background checks, July 2022-July 2023: -10.8% (-1,285 — 14th smallest decrease)
> Firearm background checks, July 2023: 10,611 — 14th fewest
> Firearm background checks, July 2022: 11,896 — 14th fewest
> Firearm background checks per 1,000 residents, July 2023: 3.3 — 12th fewest
> Firearm background checks per 1,000 residents, July 2022: 3.7 — 12th fewest
> Most common type of firearm check, July 2023: Handguns
> 2022 population: 3.2 million — 19th smallest
[recirclink id=1301559]
38. Ohio
> Change in background checks, July 2022-July 2023: -11.2% (-5,235 — 17th largest decrease)
> Firearm background checks, July 2023: 41,446 — 9th most
> Firearm background checks, July 2022: 46,681 — 10th most
> Firearm background checks per 1,000 residents, July 2023: 3.5 — 15th fewest
> Firearm background checks per 1,000 residents, July 2022: 4.0 — 14th fewest
> Most common type of firearm check, July 2023: Handguns
> 2022 population: 11.8 million — 7th largest

37. New Mexico
> Change in background checks, July 2022-July 2023: -11.3% (-1,388 — 15th smallest decrease)
> Firearm background checks, July 2023: 10,930 — 17th fewest
> Firearm background checks, July 2022: 12,318 — 16th fewest
> Firearm background checks per 1,000 residents, July 2023: 5.2 — 16th most
> Firearm background checks per 1,000 residents, July 2022: 5.8 — 20th most
> Most common type of firearm check, July 2023: Handguns
> 2022 population: 2.1 million — 15th smallest
[in-text-ad-2]

36. Colorado
> Change in background checks, July 2022-July 2023: -11.5% (-4,686 — 20th largest decrease)
> Firearm background checks, July 2023: 36,007 — 11th most
> Firearm background checks, July 2022: 40,693 — 13th most
> Firearm background checks per 1,000 residents, July 2023: 6.2 — 8th most
> Firearm background checks per 1,000 residents, July 2022: 7.0 — 13th most
> Most common type of firearm check, July 2023: Handguns
> 2022 population: 5.8 million — 21st largest
35. New Hampshire
> Change in background checks, July 2022-July 2023: -12.3% (-1,258 — 13th smallest decrease)
> Firearm background checks, July 2023: 9,003 — 13th fewest
> Firearm background checks, July 2022: 10,261 — 13th fewest
> Firearm background checks per 1,000 residents, July 2023: 6.5 — 7th most
> Firearm background checks per 1,000 residents, July 2022: 7.4 — 8th most
> Most common type of firearm check, July 2023: Handguns
> 2022 population: 1.4 million — 10th smallest
[in-text-ad]
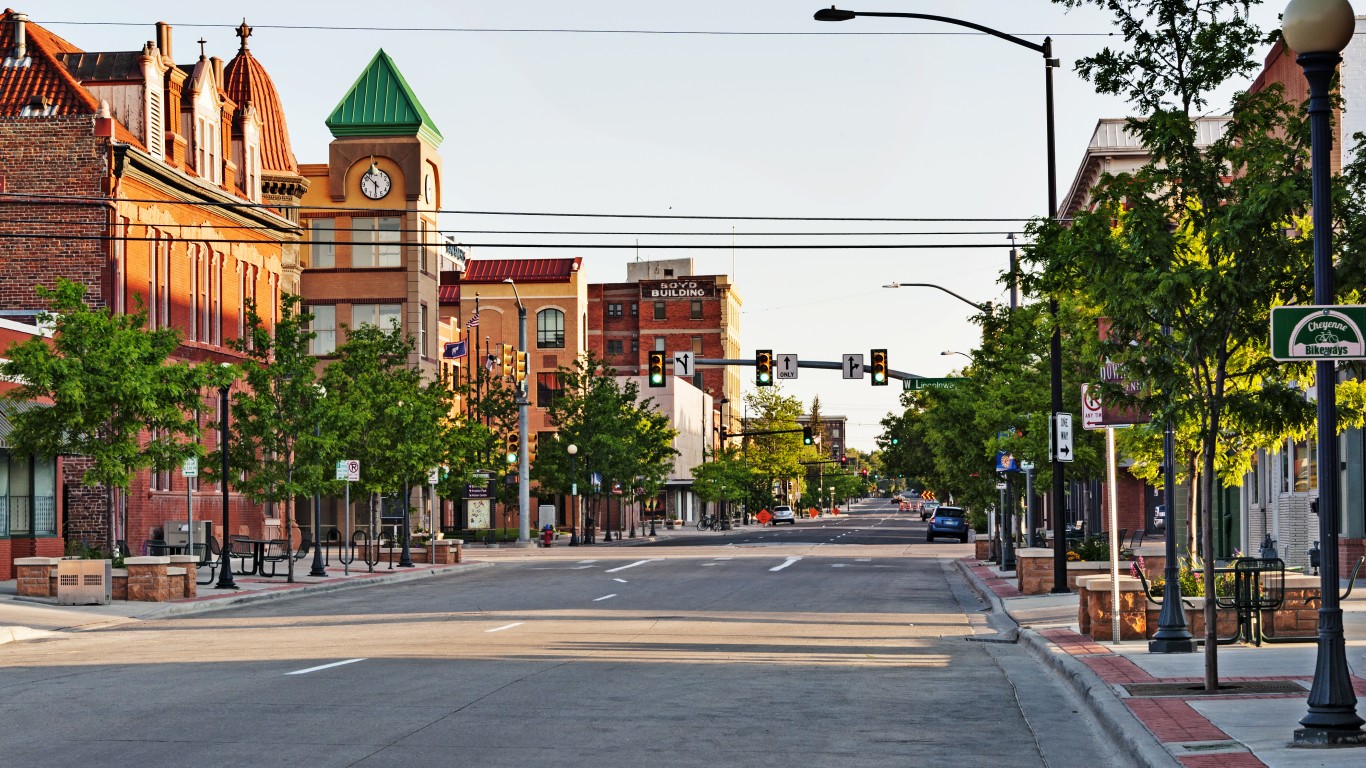
34. Wyoming
> Change in background checks, July 2022-July 2023: -12.7% (-621 — 5th smallest decrease)
> Firearm background checks, July 2023: 4,261 — 6th fewest
> Firearm background checks, July 2022: 4,882 — 6th fewest
> Firearm background checks per 1,000 residents, July 2023: 7.3 — 4th most
> Firearm background checks per 1,000 residents, July 2022: 8.4 — 6th most
> Most common type of firearm check, July 2023: Handguns
> 2022 population: 581,381 — the smallest
[recirclink id=1301069]
33. Arizona
> Change in background checks, July 2022-July 2023: -12.9% (-5,047 — 19th largest decrease)
> Firearm background checks, July 2023: 34,097 — 13th most
> Firearm background checks, July 2022: 39,144 — 16th most
> Firearm background checks per 1,000 residents, July 2023: 4.6 — 20th most
> Firearm background checks per 1,000 residents, July 2022: 5.3 — 24th most
> Most common type of firearm check, July 2023: Handguns
> 2022 population: 7.4 million — 14th largest

32. Georgia
> Change in background checks, July 2022-July 2023: -13.1% (-5,095 — 18th largest decrease)
> Firearm background checks, July 2023: 33,824 — 14th most
> Firearm background checks, July 2022: 38,919 — 17th most
> Firearm background checks per 1,000 residents, July 2023: 3.1 — 9th fewest
> Firearm background checks per 1,000 residents, July 2022: 3.6 — 11th fewest
> Most common type of firearm check, July 2023: Handguns
> 2022 population: 10.9 million — 8th largest
[in-text-ad-2]
31. West Virginia
> Change in background checks, July 2022-July 2023: -13.2% (-1,625 — 19th smallest decrease)
> Firearm background checks, July 2023: 10,691 — 15th fewest
> Firearm background checks, July 2022: 12,316 — 15th fewest
> Firearm background checks per 1,000 residents, July 2023: 6.0 — 10th most
> Firearm background checks per 1,000 residents, July 2022: 6.9 — 14th most
> Most common type of firearm check, July 2023: Handguns
> 2022 population: 1.8 million — 12th smallest
30. Michigan
> Change in background checks, July 2022-July 2023: -13.8% (-7,285 — 13th largest decrease)
> Firearm background checks, July 2023: 45,320 — 8th most
> Firearm background checks, July 2022: 52,605 — 8th most
> Firearm background checks per 1,000 residents, July 2023: 4.5 — 22nd most
> Firearm background checks per 1,000 residents, July 2022: 5.2 — 25th fewest
> Most common type of firearm check, July 2023: Handguns
> 2022 population: 10.0 million — 10th largest
[in-text-ad]

29. Oregon
> Change in background checks, July 2022-July 2023: -13.9% (-4,166 — 22nd largest decrease)
> Firearm background checks, July 2023: 25,884 — 20th most
> Firearm background checks, July 2022: 30,050 — 21st most
> Firearm background checks per 1,000 residents, July 2023: 6.1 — 9th most
> Firearm background checks per 1,000 residents, July 2022: 7.1 — 10th most
> Most common type of firearm check, July 2023: Handguns
> 2022 population: 4.2 million — 24th smallest
[recirclink id=1302834]
28. Alaska
> Change in background checks, July 2022-July 2023: -14.2% (-897 — 10th smallest decrease)
> Firearm background checks, July 2023: 5,427 — 9th fewest
> Firearm background checks, July 2022: 6,324 — 9th fewest
> Firearm background checks per 1,000 residents, July 2023: 7.4 — 3rd most
> Firearm background checks per 1,000 residents, July 2022: 8.6 — 5th most
> Most common type of firearm check, July 2023: Handguns
> 2022 population: 733,583 — 3rd smallest

27. Iowa
> Change in background checks, July 2022-July 2023: -14.4% (-1,170 — 12th smallest decrease)
> Firearm background checks, July 2023: 6,976 — 11th fewest
> Firearm background checks, July 2022: 8,146 — 10th fewest
> Firearm background checks per 1,000 residents, July 2023: 2.2 — 5th fewest
> Firearm background checks per 1,000 residents, July 2022: 2.5 — 6th fewest
> Most common type of firearm check, July 2023: Handguns
> 2022 population: 3.2 million — 20th smallest
[in-text-ad-2]

26. Oklahoma
> Change in background checks, July 2022-July 2023: -15.3% (-3,793 — 23rd largest decrease)
> Firearm background checks, July 2023: 21,063 — 23rd most
> Firearm background checks, July 2022: 24,856 — 23rd most
> Firearm background checks per 1,000 residents, July 2023: 5.2 — 14th most
> Firearm background checks per 1,000 residents, July 2022: 6.2 — 16th most
> Most common type of firearm check, July 2023: Handguns
> 2022 population: 4.0 million — 23rd smallest
25. South Carolina
> Change in background checks, July 2022-July 2023: -15.3% (-4,274 — 21st largest decrease)
> Firearm background checks, July 2023: 23,683 — 21st most
> Firearm background checks, July 2022: 27,957 — 22nd most
> Firearm background checks per 1,000 residents, July 2023: 4.5 — 24th most
> Firearm background checks per 1,000 residents, July 2022: 5.3 — 25th most
> Most common type of firearm check, July 2023: Handguns
> 2022 population: 5.3 million — 23rd largest
[in-text-ad]
24. Kentucky
> Change in background checks, July 2022-July 2023: -16.5% (-3,111 — 23rd smallest decrease)
> Firearm background checks, July 2023: 15,736 — 22nd fewest
> Firearm background checks, July 2022: 18,847 — 23rd fewest
> Firearm background checks per 1,000 residents, July 2023: 3.5 — 14th fewest
> Firearm background checks per 1,000 residents, July 2022: 4.2 — 15th fewest
> Most common type of firearm check, July 2023: Handguns
> 2022 population: 4.5 million — 25th smallest
[recirclink id=1302834]

23. Virginia
> Change in background checks, July 2022-July 2023: -16.7% (-7,196 — 14th largest decrease)
> Firearm background checks, July 2023: 36,002 — 12th most
> Firearm background checks, July 2022: 43,198 — 12th most
> Firearm background checks per 1,000 residents, July 2023: 4.1 — 23rd fewest
> Firearm background checks per 1,000 residents, July 2022: 5.0 — 22nd fewest
> Most common type of firearm check, July 2023: Handguns
> 2022 population: 8.7 million — 12th largest
22. Minnesota
> Change in background checks, July 2022-July 2023: -16.9% (-5,380 — 16th largest decrease)
> Firearm background checks, July 2023: 26,448 — 19th most
> Firearm background checks, July 2022: 31,828 — 20th most
> Firearm background checks per 1,000 residents, July 2023: 4.6 — 21st most
> Firearm background checks per 1,000 residents, July 2022: 5.6 — 22nd most
> Most common type of firearm check, July 2023: Handguns
> 2022 population: 5.7 million — 22nd largest
[in-text-ad-2]

21. Rhode Island
> Change in background checks, July 2022-July 2023: -17.1% (-326 — 2nd smallest decrease)
> Firearm background checks, July 2023: 1,580 — 2nd fewest
> Firearm background checks, July 2022: 1,906 — 2nd fewest
> Firearm background checks per 1,000 residents, July 2023: 1.4 — 4th fewest
> Firearm background checks per 1,000 residents, July 2022: 1.7 — 4th fewest
> Most common type of firearm check, July 2023: Handguns
> 2022 population: 1.1 million — 7th smallest

20. Florida
> Change in background checks, July 2022-July 2023: -17.1% (-19,583 — 3rd largest decrease)
> Firearm background checks, July 2023: 94,704 — 2nd most
> Firearm background checks, July 2022: 114,287 — 2nd most
> Firearm background checks per 1,000 residents, July 2023: 4.3 — 24th fewest
> Firearm background checks per 1,000 residents, July 2022: 5.1 — 24th fewest
> Most common type of firearm check, July 2023: Handguns
> 2022 population: 22.2 million — 3rd largest
[in-text-ad]

19. Pennsylvania
> Change in background checks, July 2022-July 2023: -18.7% (-17,376 — 4th largest decrease)
> Firearm background checks, July 2023: 75,778 — 4th most
> Firearm background checks, July 2022: 93,154 — 4th most
> Firearm background checks per 1,000 residents, July 2023: 5.8 — 12th most
> Firearm background checks per 1,000 residents, July 2022: 7.2 — 9th most
> Most common type of firearm check, July 2023: Handguns
> 2022 population: 13.0 million — 5th largest
[recirclink id=1302769]

18. Mississippi
> Change in background checks, July 2022-July 2023: -19.0% (-3,096 — 22nd smallest decrease)
> Firearm background checks, July 2023: 13,213 — 20th fewest
> Firearm background checks, July 2022: 16,309 — 20th fewest
> Firearm background checks per 1,000 residents, July 2023: 4.5 — 23rd most
> Firearm background checks per 1,000 residents, July 2022: 5.5 — 23rd most
> Most common type of firearm check, July 2023: Handguns
> 2022 population: 2.9 million — 17th smallest
17. Missouri
> Change in background checks, July 2022-July 2023: -19.8% (-7,324 — 12th largest decrease)
> Firearm background checks, July 2023: 29,659 — 17th most
> Firearm background checks, July 2022: 36,983 — 18th most
> Firearm background checks per 1,000 residents, July 2023: 4.8 — 19th most
> Firearm background checks per 1,000 residents, July 2022: 6.0 — 19th most
> Most common type of firearm check, July 2023: Handguns
> 2022 population: 6.2 million — 18th largest
[in-text-ad-2]
16. Maine
> Change in background checks, July 2022-July 2023: -20.2% (-1,726 — 20th smallest decrease)
> Firearm background checks, July 2023: 6,809 — 10th fewest
> Firearm background checks, July 2022: 8,535 — 11th fewest
> Firearm background checks per 1,000 residents, July 2023: 4.9 — 17th most
> Firearm background checks per 1,000 residents, July 2022: 6.2 — 17th most
> Most common type of firearm check, July 2023: Handguns
> 2022 population: 1.4 million — 9th smallest
15. Texas
> Change in background checks, July 2022-July 2023: -20.5% (-25,763 — the largest decrease)
> Firearm background checks, July 2023: 99,885 — the most
> Firearm background checks, July 2022: 125,648 — the most
> Firearm background checks per 1,000 residents, July 2023: 3.3 — 11th fewest
> Firearm background checks per 1,000 residents, July 2022: 4.2 — 16th fewest
> Most common type of firearm check, July 2023: Handguns
> 2022 population: 30.0 million — 2nd largest
[in-text-ad]
14. Illinois
> Change in background checks, July 2022-July 2023: -20.6% (-12,130 — 7th largest decrease)
> Firearm background checks, July 2023: 46,805 — 6th most
> Firearm background checks, July 2022: 58,935 — 6th most
> Firearm background checks per 1,000 residents, July 2023: 3.7 — 19th fewest
> Firearm background checks per 1,000 residents, July 2022: 4.7 — 20th fewest
> Most common type of firearm check, July 2023: Handguns
> 2022 population: 12.6 million — 6th largest
[recirclink id=1301559]
13. Tennessee
> Change in background checks, July 2022-July 2023: -20.7% (-13,106 — 6th largest decrease)
> Firearm background checks, July 2023: 50,092 — 5th most
> Firearm background checks, July 2022: 63,198 — 5th most
> Firearm background checks per 1,000 residents, July 2023: 7.1 — 6th most
> Firearm background checks per 1,000 residents, July 2022: 9.0 — 3rd most
> Most common type of firearm check, July 2023: Handguns
> 2022 population: 7.1 million — 15th largest

12. Connecticut
> Change in background checks, July 2022-July 2023: -22.3% (-3,741 — 24th largest decrease)
> Firearm background checks, July 2023: 13,062 — 19th fewest
> Firearm background checks, July 2022: 16,803 — 21st fewest
> Firearm background checks per 1,000 residents, July 2023: 3.6 — 17th fewest
> Firearm background checks per 1,000 residents, July 2022: 4.6 — 19th fewest
> Most common type of firearm check, July 2023: Handguns
> 2022 population: 3.6 million — 22nd smallest
[in-text-ad-2]
11. New Jersey
> Change in background checks, July 2022-July 2023: -24.6% (-3,559 — 24th smallest decrease)
> Firearm background checks, July 2023: 10,927 — 16th fewest
> Firearm background checks, July 2022: 14,486 — 19th fewest
> Firearm background checks per 1,000 residents, July 2023: 1.2 — 2nd fewest
> Firearm background checks per 1,000 residents, July 2022: 1.6 — 2nd fewest
> Most common type of firearm check, July 2023: Handguns
> 2022 population: 9.3 million — 11th largest
10. Wisconsin
> Change in background checks, July 2022-July 2023: -24.6% (-10,991 — 10th largest decrease)
> Firearm background checks, July 2023: 33,724 — 15th most
> Firearm background checks, July 2022: 44,715 — 11th most
> Firearm background checks per 1,000 residents, July 2023: 5.7 — 13th most
> Firearm background checks per 1,000 residents, July 2022: 7.6 — 7th most
> Most common type of firearm check, July 2023: Handguns
> 2022 population: 5.9 million — 20th largest
[in-text-ad]

9. Louisiana
> Change in background checks, July 2022-July 2023: -25.4% (-5,717 — 15th largest decrease)
> Firearm background checks, July 2023: 16,749 — 23rd fewest
> Firearm background checks, July 2022: 22,466 — 24th most
> Firearm background checks per 1,000 residents, July 2023: 3.6 — 18th fewest
> Firearm background checks per 1,000 residents, July 2022: 4.9 — 21st fewest
> Most common type of firearm check, July 2023: Handguns
> 2022 population: 4.6 million — 25th largest
[recirclink id=1301069]
8. South Dakota
> Change in background checks, July 2022-July 2023: -25.7% (-1,531 — 18th smallest decrease)
> Firearm background checks, July 2023: 4,422 — 7th fewest
> Firearm background checks, July 2022: 5,953 — 8th fewest
> Firearm background checks per 1,000 residents, July 2023: 4.9 — 18th most
> Firearm background checks per 1,000 residents, July 2022: 6.5 — 15th most
> Most common type of firearm check, July 2023: Long guns
> 2022 population: 909,824 — 5th smallest
7. North Dakota
> Change in background checks, July 2022-July 2023: -25.9% (-1,421 — 17th smallest decrease)
> Firearm background checks, July 2023: 4,062 — 5th fewest
> Firearm background checks, July 2022: 5,483 — 7th fewest
> Firearm background checks per 1,000 residents, July 2023: 5.2 — 15th most
> Firearm background checks per 1,000 residents, July 2022: 7.0 — 12th most
> Most common type of firearm check, July 2023: Long guns
> 2022 population: 779,261 — 4th smallest
[in-text-ad-2]
6. Hawaii
> Change in background checks, July 2022-July 2023: -26.8% (-490 — 4th smallest decrease)
> Firearm background checks, July 2023: 1,337 — the fewest
> Firearm background checks, July 2022: 1,827 — the fewest
> Firearm background checks per 1,000 residents, July 2023: 0.9 — the fewest
> Firearm background checks per 1,000 residents, July 2022: 1.3 — the fewest
> Most common type of firearm check, July 2023: No data available
> 2022 population: 1.4 million — 11th smallest
5. Alabama
> Change in background checks, July 2022-July 2023: -27.1% (-13,708 — 5th largest decrease)
> Firearm background checks, July 2023: 36,824 — 10th most
> Firearm background checks, July 2022: 50,532 — 9th most
> Firearm background checks per 1,000 residents, July 2023: 7.3 — 5th most
> Firearm background checks per 1,000 residents, July 2022: 10.0 — the most
> Most common type of firearm check, July 2023: Handguns
> 2022 population: 5.1 million — 24th largest
[in-text-ad]
4. Indiana
> Change in background checks, July 2022-July 2023: -28.6% (-11,275 — 8th largest decrease)
> Firearm background checks, July 2023: 28,215 — 18th most
> Firearm background checks, July 2022: 39,490 — 15th most
> Firearm background checks per 1,000 residents, July 2023: 4.1 — 20th fewest
> Firearm background checks per 1,000 residents, July 2022: 5.8 — 21st most
> Most common type of firearm check, July 2023: Handguns
> 2022 population: 6.8 million — 17th largest
[recirclink id=1302834]
3. Vermont
> Change in background checks, July 2022-July 2023: -30.1% (-999 — 11th smallest decrease)
> Firearm background checks, July 2023: 2,318 — 3rd fewest
> Firearm background checks, July 2022: 3,317 — 3rd fewest
> Firearm background checks per 1,000 residents, July 2023: 3.6 — 16th fewest
> Firearm background checks per 1,000 residents, July 2022: 5.1 — 23rd fewest
> Most common type of firearm check, July 2023: Long guns
> 2022 population: 647,064 — 2nd smallest
2. New York
> Change in background checks, July 2022-July 2023: -30.7% (-10,463 — 11th largest decrease)
> Firearm background checks, July 2023: 23,584 — 22nd most
> Firearm background checks, July 2022: 34,047 — 19th most
> Firearm background checks per 1,000 residents, July 2023: 1.2 — 3rd fewest
> Firearm background checks per 1,000 residents, July 2022: 1.7 — 3rd fewest
> Most common type of firearm check, July 2023: Handguns
> 2022 population: 19.7 million — 4th largest
[in-text-ad-2]
1. Washington
> Change in background checks, July 2022-July 2023: -41.5% (-22,858 — 2nd largest decrease)
> Firearm background checks, July 2023: 32,234 — 16th most
> Firearm background checks, July 2022: 55,092 — 7th most
> Firearm background checks per 1,000 residents, July 2023: 4.1 — 22nd fewest
> Firearm background checks per 1,000 residents, July 2022: 7.1 — 11th most
> Most common type of firearm check, July 2023: Handguns
> 2022 population: 7.8 million — 13th largest
Methodology
To identify the states where gun sales are decreasing fastest, 24/7 Wall St. used data from the FBI’s National Instant Criminal Background Check System, looking at the states with the largest percentage decrease in adjusted-firearm background checks from July 2022 to 2023. To reach a more accurate approximation of gun sales, we excluded checks for such categories as pawn shop transactions, returns, rentals, and rechecks (which are conducted periodically by some states on existing permit holders).
Even after removing some types of checks that are clearly unrelated to a new firearm purchase, background checks still serve only as a rough approximation, because every state has different background checks laws and accounting practices.
The most glaring example of this is Illinois, which alone accounted for about half of the background checks in the country after excluding the aforementioned categories of checks. Illinois no longer breaks down background checks separately, but did so from July 2016 through July 2021. During the four full years of data, an average of 9.2% of Illinois’s non-private sale or gun-specific permit checks were non-rechecks. We applied that average to the most recent state figures to estimate Illinois’ count. This was done only because Illinois is such a glaring example of inconsistency and because there was historical data to produce an estimate.
There are likely other states for which the background check figures listed are inflated or underestimated proxies for gun sales.
Population data came from the U.S. Census Bureau’s Population and Housing Unit Estimates Program, and are for July of 2022, the most recent data available.
Contact [email protected] for any questions or corrections.