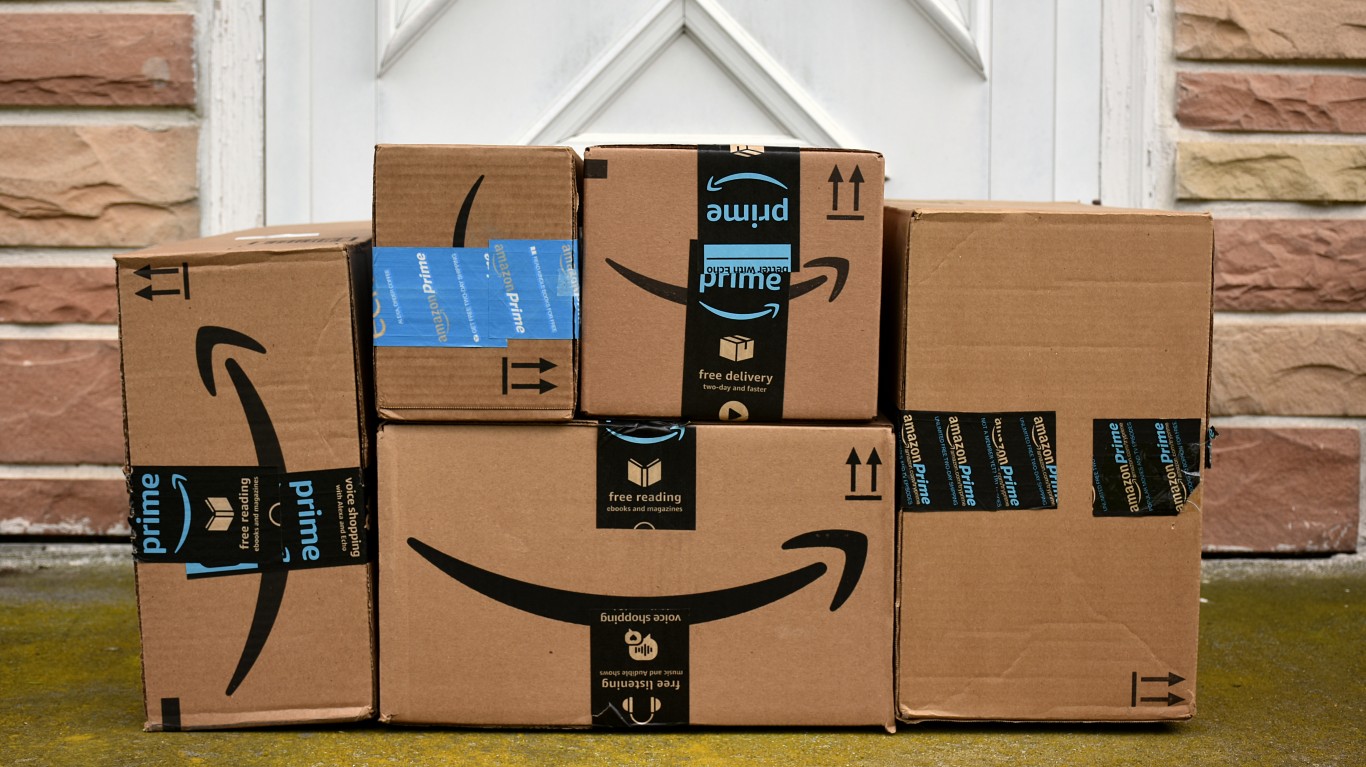
The holiday season is here, and many people are buying gifts online and having them delivered to their homes. Often, this means packages are left out in areas that are visible to passersby, and vulnerable to thieves willing to walk up and grab them.
To compile a list of the U.S. cities with the most porch pirates, 24/7 Tempo reviewed a report by Circuit Package Tracker, a free tracking tool. It used Google Adwords data over the last five years related to missing and stolen packages to identify cities that had the most people searching for their missing packages.
According to online safety guide SafeWise, an estimated 260 million packages were stolen from residents of the U.S. this year, up from 210 million last year. The holidays can be an especially dangerous time for porch piracy as thieves know people will be receiving valuable gifts. (These are the most popular gifts of the century)
Some 35% of Americans have had at least one package stolen, but only 17% of those have reported it to police, according to LendingTree. Instead, they were much more likely to make a claim with the seller or the shipping company. Among those who pursued this route, 55% reported receiving all their money back and 29% reported receiving nothing.
To combat front-step theft, many Americans now have some sort of security camera aimed at their porch. However, these don’t appear to be a big deterrent; 60% of Americans who reported having a delivery stolen had at least one security camera.
Many customers have taken extra measures to make sure their packages are safe including using tracking notifications and setting up a delivery time. Package recipients can also purchase secure package delivery boxes to put on their porches or use services like Amazon’s delivery lockers. (There are greater threats than porch pirates: These are the best deterrents to protect your home from burglars.)
To combat porch piracy there is even a trend of YouTubers creating fake bait packages filled with stink bombs, glitter bombs and tracking devices.
Click here to see the cities with the most porch pirates
To compile a list of the U.S. with the most porch pirates, 24/7 Tempo reviewed a report by Circuit Package Tracker, a free tracking tool. It used Google Adwords data over the last five years related to missing and stolen packages to identify cities that had the most people searching for their missing packages.

28. Glendale, California
> Pirates in the last 5 years: 897
> Median household income: $79,633
> Population: 192,376
[in-text-ad]

27. Madison, Wisconsin
> Pirates in the last 5 years: 898
> Median household income: $67,270
> Population: 269,162
[recirclink id=1189197]

26. Tacoma, Washington
> Pirates in the last 5 years: 924
> Median household income: $77,141
> Population: 219,203

25. Vancouver, Washington
> Pirates in the last 5 years: 930
> Median household income: $69,993
> Population: 192,176
[in-text-ad-2]

24. Birmingham, Alabama
> Pirates in the last 5 years: 941
> Median household income: $36,614
> Population: 196,410

23. Garden Grove, California
> Pirates in the last 5 years: 947
> Median household income: $74,109
> Population: 170,492
[in-text-ad]

22. Tempe, Arizona
> Pirates in the last 5 years: 947
> Median household income: $68,662
> Population: 184,109
[recirclink id=1145186]

21. Thornton, Colorado
> Pirates in the last 5 years: 961
> Median household income: $93,873
> Population: 142,599

20. Pittsburgh, Pennsylvania
> Pirates in the last 5 years: 969
> Median household income: $57,821
> Population: 300,454
[in-text-ad-2]

19. Round Rock, Texas
> Pirates in the last 5 years: 973
> Median household income: $79,649
> Population: 127,130

18. Arlington, Virginia
> Pirates in the last 5 years: 981
> Median household income: $125,651
> Population: 232,965
[in-text-ad]

17. Grand Rapids, Michigan
> Pirates in the last 5 years: 982
> Median household income: $59,596
> Population: 197,423
[recirclink id=1189185]

16. St. Louis, Missouri
> Pirates in the last 5 years: 990
> Median household income: $49,965
> Population: 293,310

15. Jersey City, New Jersey
> Pirates in the last 5 years: 993
> Median household income: $81,958
> Population: 283,943
[in-text-ad-2]

14. Orlando, Florida
> Pirates in the last 5 years: 1,007
> Median household income: $54,167
> Population: 309,193

13. Hollywood, Florida
> Pirates in the last 5 years: 1,031
> Median household income: $60,490
> Population: 152,139
[in-text-ad]

12. Richmond, Virginia
> Pirates in the last 5 years: 1,034
> Median household income: $51,770
> Population: 226,604
[recirclink id=1183010]

11. Providence, Rhode Island
> Pirates in the last 5 years: 1,039
> Median household income: $60,970
> Population: 189,697

10. Knoxville, Tennessee
> Pirates in the last 5 years: 1,046
> Median household income: $45,700
> Population: 192,657
[in-text-ad-2]

9. Rochester, New York
> Pirates in the last 5 years: 1,060
> Median household income: $40,083
> Population: 210,606

8. Lakewood, Colorado
> Pirates in the last 5 years: 1,070
> Median household income: $77,122
> Population: 156,612
[in-text-ad]

7. Fort Lauderdale, Florida
> Pirates in the last 5 years: 1,074
> Median household income: $64,912
> Population: 181,666
[recirclink id=1189197]

6. Pomona, California
> Pirates in the last 5 years: 1,093
> Median household income: $70,494
> Population: 148,339

5. Hayward, California
> Pirates in the last 5 years: 1,098
> Median household income: $96,386
> Population: 159,839
[in-text-ad-2]

4. Alexandria, Virginia
> Pirates in the last 5 years: 1,259
> Median household income: $101,162
> Population: 154,706

3. Salt Lake City, Utah
> Pirates in the last 5 years: 1,368
> Median household income: $66,658
> Population: 200,475
[in-text-ad]

2. Bellevue, Washington
> Pirates in the last 5 years: 1,439
> Median household income: $144,274
> Population: 149,429
[recirclink id=1145186]

1. Sunnyvale, California
> Pirates in the last 5 years: 1,536
> Median household income: $156,059
> Population: 152,258
Contact [email protected] for any questions or corrections.