The rising cost of shelter has been one of the major components contributing to the current surge in inflation that began around the middle of 2021. According to the recent consumer price index summary from the Bureau of Labor Statistics, Americans were paying 8.2% more to keep a roof over their heads compared to March last year.
Only transportation services, electricity, and food prices have increased at a higher rate over this 12-month period, well over the 5% increase in the all items CPI, a list that includes a 17% decrease in gasoline prices, an 11% decline in used car and truck prices, a 3% increase in apparel prices, and a nearly 4% rise in the prices of medical commodities, such as over-the-counter and prescription drugs and medical equipment and supplies. (These are the prices that spiked the most compared to this time last year.)
The Wall Street Journal reported in April that local home prices and rental costs are heavily influenced by migration patterns, and as Ameircans relocate from high-cost metropolitan areas like Los Angeles and New York to lower-cost destinations like Tampa and Dallas, they bring up shelter inflation. In some cases, these cities end up with the highest inflation in the country, pushed up by rising demand for shelter.
To find the U.S. metropolitan areas with the highest shelter inflation, 24/7 Wall St. reviewed consumer price index data from the BLS by geography. The BLS only has recent CPI data for 23 metro areas, and included here are the 11 metros where the shelter CPI increased faster than the 8.2% increase nationwide. The shelter CPI for most metros is either for March or February 2023 and is compared to March or February 2022, respectively. All other data came from the Census Bureau 2021 American Community Survey.
Eleven popular U.S. metro areas are confronting shelter inflation that’s above the 8.2% national average, including seven with double-digit increases of between 10.6% in and around San Diego and 17.2% in Miami-Fort Lauderdale-West Palm Beach.
Median monthly rent in these 11 metropolitan areas ranges from $1,190 in the Houston metro area to $1,908 in San Diego-Carlsbad. Median home value among these metro areas starts at $252,300 in Houston-The Woodlands-Sugar Land up to $722,200 in San Diego-Carlsbad. These areas are home to about 56.5 million people, or about 17% of the country’s population. (Here are American cities where renting is least affordable.)
Here are the U.S. metro areas with the highest increase in housing costs.
Click here to see our detailed methodology.
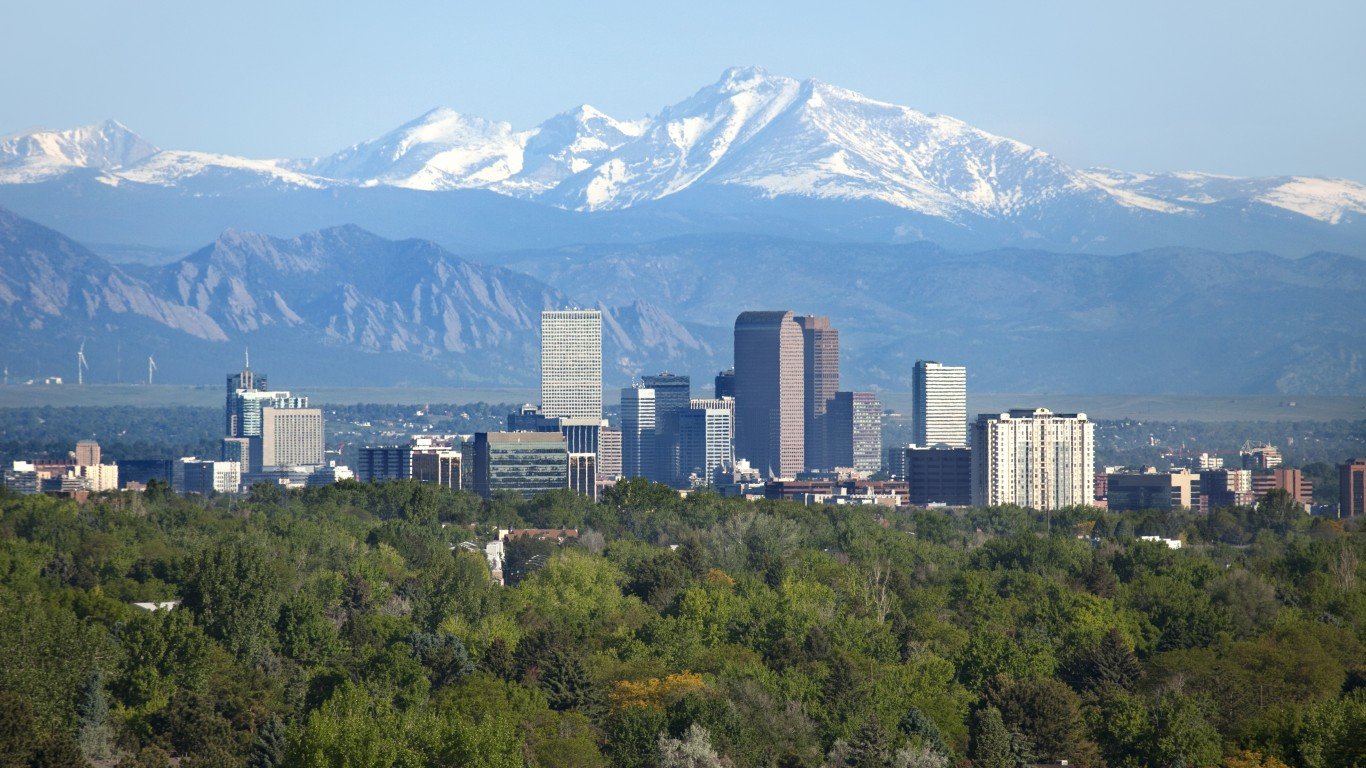
11. Denver-Aurora-Lakewood, CO
> Shelter CPI, March 23, YoY chg.: 8.3%
> Median gross rent, 2021: $1,605 – #19 highest of 386 metros
> Median home value, 2021: $519,600 – #20 highest of 386 metros
> Population, 2021: 2,972,567 – #19 highest of 386 metros
[in-text-ad]

10. Riverside-San Bernardino-Ontario, CA
> Shelter CPI, March 23, YoY chg.: 8.7%
> Median gross rent, 2021: $1,552 – #24 highest of 386 metros
> Median home value, 2021: $453,000 – #33 highest of 386 metros
> Population, 2021: 4,653,105 – #12 highest of 386 metros
[recirclink id=1223790]

9. Philadelphia-Camden-Wilmington, PA-NJ-DE-MD
> Shelter CPI, Feb 23, YoY chg.: 9.2%
> Median gross rent, 2021: $1,258 – #65 highest of 386 metros
> Median home value, 2021: $300,300 – #102 highest of 386 metros
> Population, 2021: 6,228,601 – #7 highest of 386 metros
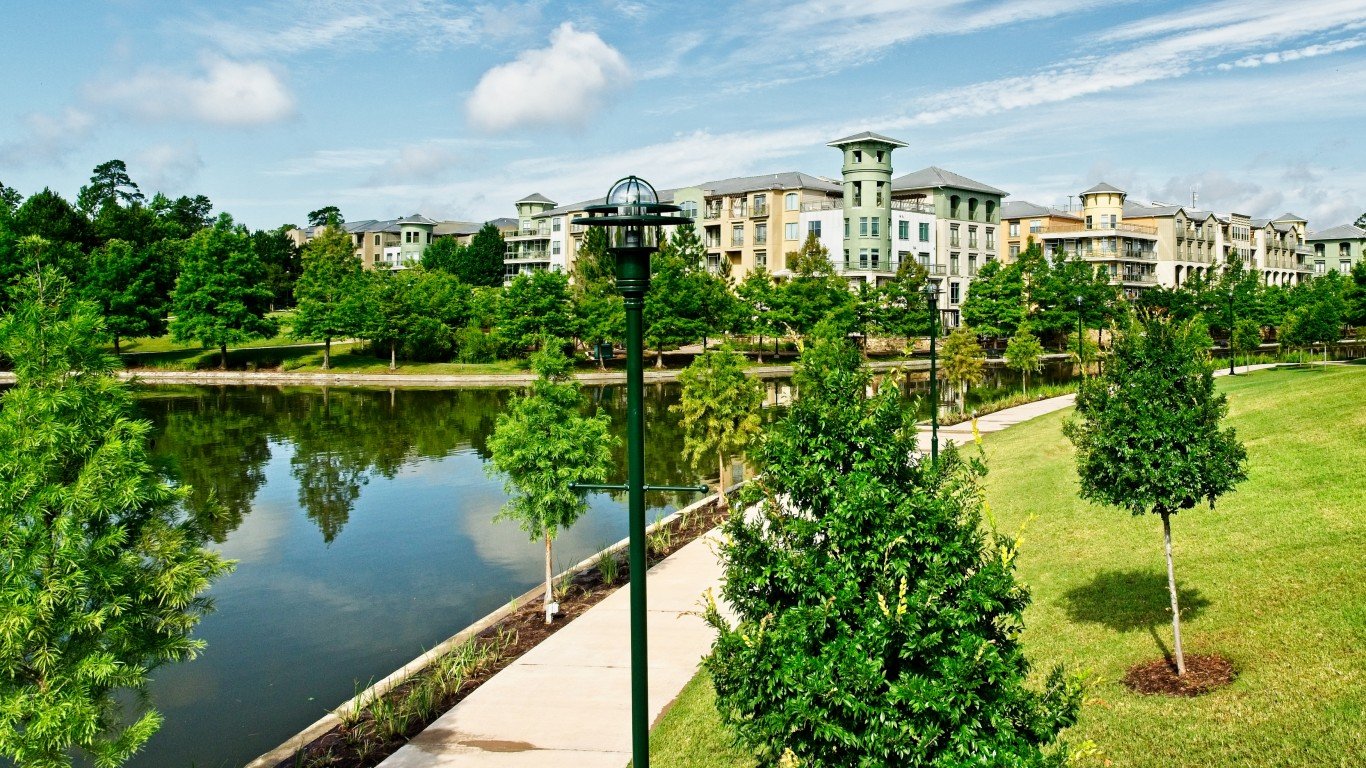
8. Houston-The Woodlands-Sugar Land, TX
> Shelter CPI, Feb 23, YoY chg.: 9.6%
> Median gross rent, 2021: $1,190 – #87 highest of 386 metros
> Median home value, 2021: $252,300 – #150 highest of 386 metros
> Population, 2021: 7,206,841 – #5 highest of 386 metros
[in-text-ad-2]

6. San Diego-Carlsbad, CA
> Shelter CPI, March 23, YoY chg.: 10.6%
> Median gross rent, 2021: $1,908 – #5 highest of 386 metros
> Median home value, 2021: $722,200 – #8 highest of 386 metros
> Population, 2021: 3,286,069 – #17 highest of 386 metros
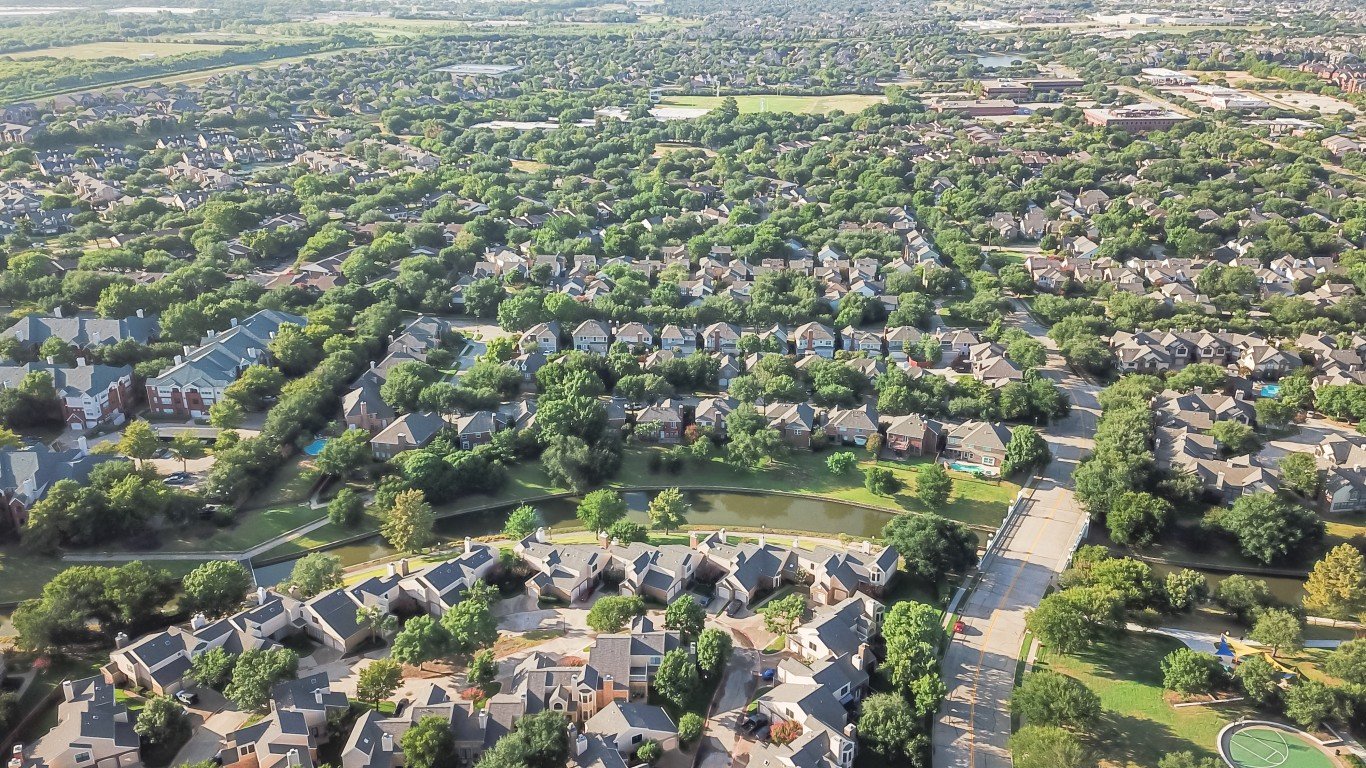
6. Dallas-Fort Worth-Arlington, TX
> Shelter CPI, March 23, YoY chg.: 10.6%
> Median gross rent, 2021: $1,304 – #57 highest of 386 metros
> Median home value, 2021: $294,900 – #107 highest of 386 metros
> Population, 2021: 7,759,615 – #4 highest of 386 metros
[in-text-ad]

5. Seattle-Tacoma-Bellevue, WA
> Shelter CPI, Feb 23, YoY chg.: 11.0%
> Median gross rent, 2021: $1,730 – #15 highest of 386 metros
> Median home value, 2021: $638,400 – #15 highest of 386 metros
> Population, 2021: 4,011,553 – #15 highest of 386 metros
[recirclink id=1219705]

4. Atlanta-Sandy Springs-Roswell, GA
> Shelter CPI, Feb 23, YoY chg.: 12.1%
> Median gross rent, 2021: $1,370 – #41 highest of 386 metros
> Median home value, 2021: $300,000 – #103 highest of 386 metros
> Population, 2021: 6,144,970 – #8 highest of 386 metros
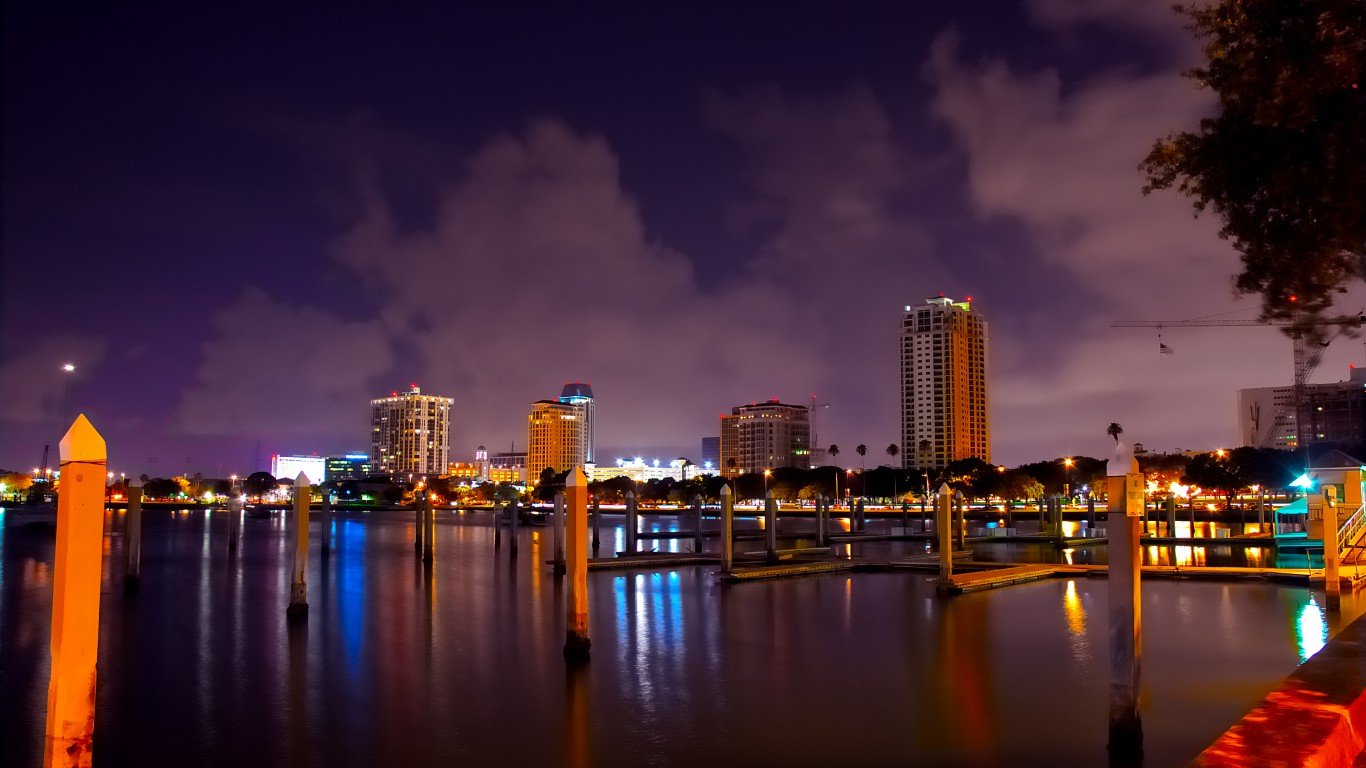
3. Tampa-St. Petersburg-Clearwater, FL
> Shelter CPI, March 23, YoY chg.: 15.1%
> Median gross rent, 2021: $1,286 – #59 highest of 386 metros
> Median home value, 2021: $279,600 – #121 highest of 386 metros
> Population, 2021: 3,219,514 – #18 highest of 386 metros
[in-text-ad-2]

2. Phoenix-Mesa-Scottsdale, AZ
> Shelter CPI, Feb 23, YoY chg.: 16.1%
> Median gross rent, 2021: $1,384 – #40 highest of 386 metros
> Median home value, 2021: $374,100 – #50 highest of 386 metros
> Population, 2021: 4,946,145 – #10 highest of 386 metros
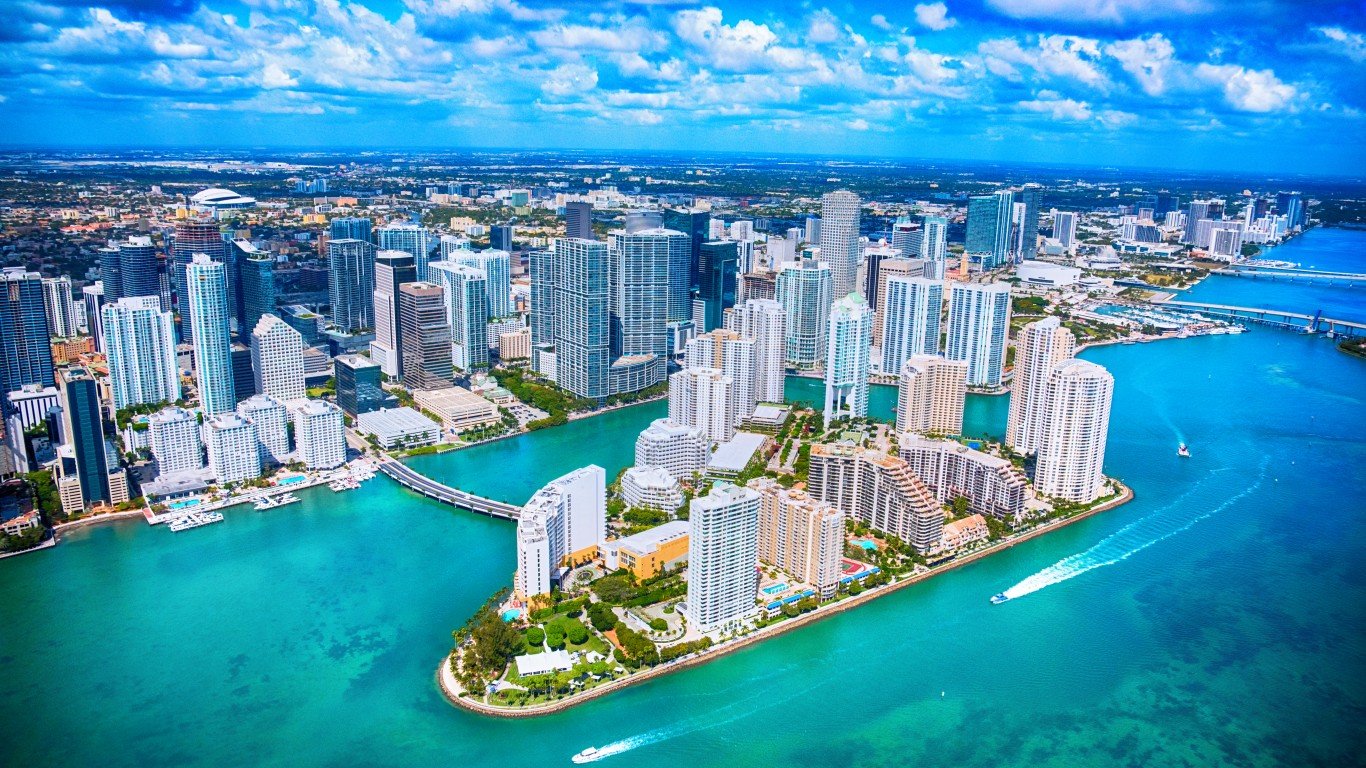
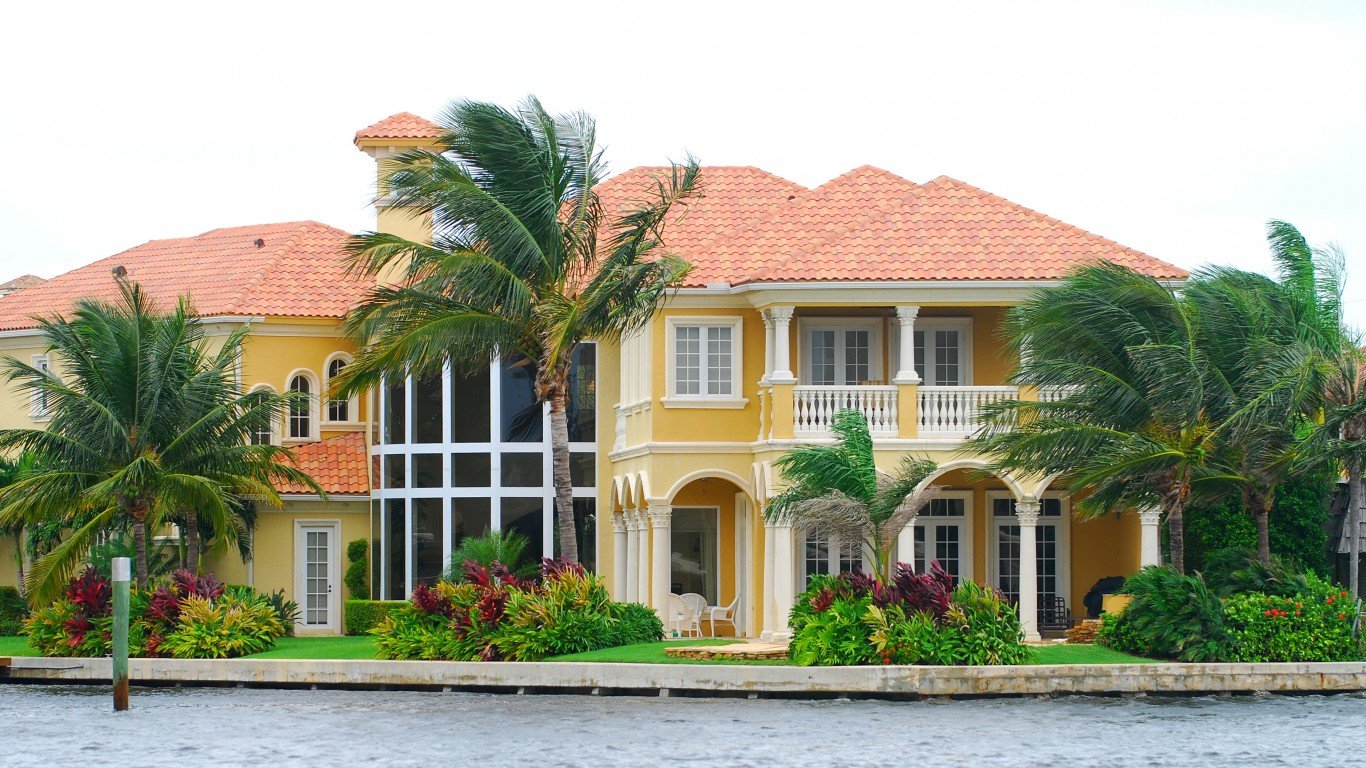
1. Miami-Fort Lauderdale-West Palm Beach, FL
> Shelter CPI, Dec 23, YoY chg.: 17.2%
> Median gross rent, 2021: $1,519 – #25 highest of 386 metros
> Median home value, 2021: $362,500 – #60 highest of 386 metros
> Population, 2021: 6,091,747 – #9 highest of 386 metros
Methodology
To find the U.S. metropolitan areas with the highest shelter inflation, 24/7 Wall St. reviewed consumer price index data from the Bureau of Labor Statistics by geography. The BLS only has recent CPI data for 23 metro areas, and included here are the 11 metros where the shelter CPI increased faster than the 8.2% increase nationwide. The shelter CPI for each metro is either for March or February 2023 and is compared to March or February 2022, respectively. Only the Miami area figures are for December 2022. All other data came from the Census Bureau 2021 American Community Survey.
Four metro areas are slightly different in the BLS and the ACS – San Diego-Carlsbad, CA in the BLS vs San Diego-Chula Vista-Carlsbad, CA in the ACS; Atlanta-Sandy Springs-Roswell, GA vs Atlanta-Sandy Springs-Alpharetta, GA; Phoenix-Mesa-Scottsdale, AZ vs Phoenix-Mesa-Chandler, AZ; and Miami-Fort Lauderdale-West Palm Beach, FL vs Miami-Fort Lauderdale-Pompano Beach, FL.
Contact [email protected] for any questions or corrections.