
Violent crime has been trending downward in the United States for decades. According to the FBI, the U.S. violent crime rate — a population-adjusted measure that includes incidents of robbery, homicide, and aggravated assault — fell by nearly 90% between the mid-1990s and mid-2010s. Though a historic surge in homicides helped drive the violent crime rate up in 2020, the U.S. remains far safer than it was at any point in the 1990s.
Over the 26 year period of comprehensive FBI data, beginning in 1995 and going through 2020, the number of violent crimes reported annually in the U.S. ranged from about 1.8 million, down to less than 1.2 million. Over the same period, the violent crime rate peaked at 684 incidents for every 100,000 people in 1995, and hit a multi-decade low of 362 per 100,000 in 2014.
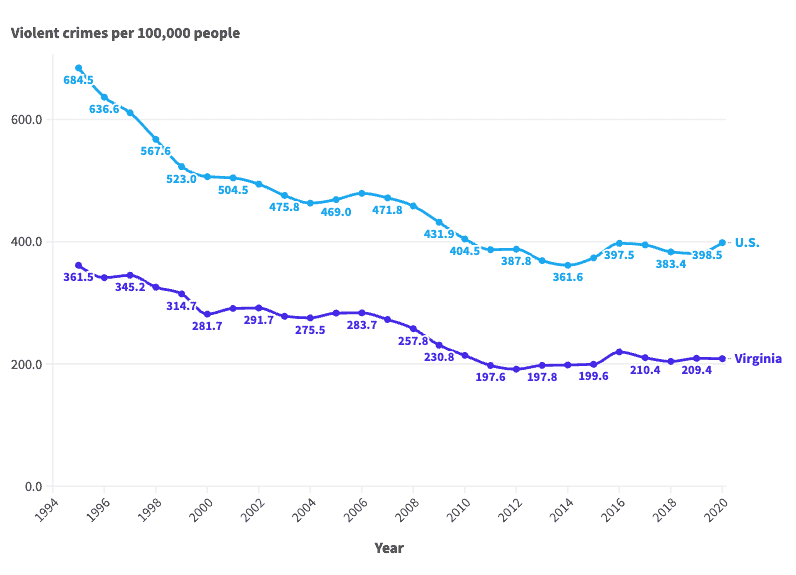
The FBI also tracks violent crime rates at the state level, and Virginia has been safer than the U.S. as a whole for over two and a half decades. Every year between 1995 and 2020, the violent crime rate in Virginia has been lower than the national rate, often by a wide margin.
Like the U.S. as a whole, the violent crime rate in Virginia has improved substantially since the 1990s. As of 2020, Virginia’s violent crime rate was 42% lower than it was in 1995 — and in each of the last 14 years, Virginia has ranked among the 10 safest states in the country.
While some factors that led to the reduction of criminal violence remain unknown, experts have identified several likely underlying causes. According to a report from the Brennan Center for Justice, a non-profit policy institute, these include an aging population, declining alcohol use, increased policing and incarceration, and several economic conditions related to inflation, unemployment, and consumer confidence.
While homicide is the most serious violent offense in the FBI’s hierarchy of violent offenses, it is also the least common. In the last 26 years, homicides have never accounted for more than 3% of all violent crimes reported in Virginia. In contrast, aggravated assault has accounted for at least half of all violent offenses reported in Virginia every year.
1995: 361.5 violent crimes per 100,000 people

- Virginia’s violent crime rate in 1995: 361.5 per 100,000 people (15th lowest among the 50 states)
- U.S. violent crime rate in 1995: 684.5 per 100,000 people
- Total violent crimes reported in Virginia in 1995: 23,921
- Total violent crimes reported in U.S. in 1995: 1,798,792
1996: 341.3 violent crimes per 100,000 people

- Virginia’s violent crime rate in 1996: 341.3 per 100,000 people (16th lowest among the 50 states)
- U.S. violent crime rate in 1996: 636.6 per 100,000 people
- Total violent crimes reported in Virginia in 1996: 22,782
- Total violent crimes reported in U.S. in 1996: 1,688,540
1997: 345.2 violent crimes per 100,000 people

- Virginia’s violent crime rate in 1997: 345.2 per 100,000 people (17th lowest among the 50 states)
- U.S. violent crime rate in 1997: 611.0 per 100,000 people
- Total violent crimes reported in Virginia in 1997: 23,249
- Total violent crimes reported in U.S. in 1997: 1,636,099
1998: 325.7 violent crimes per 100,000 people

- Virginia’s violent crime rate in 1998: 325.7 per 100,000 people (16th lowest among the 50 states)
- U.S. violent crime rate in 1998: 567.6 per 100,000 people
- Total violent crimes reported in Virginia in 1998: 22,115
- Total violent crimes reported in U.S. in 1998: 1,533,887
1999: 314.7 violent crimes per 100,000 people

- Virginia’s violent crime rate in 1999: 314.7 per 100,000 people (16th lowest among the 50 states)
- U.S. violent crime rate in 1999: 523.0 per 100,000 people
- Total violent crimes reported in Virginia in 1999: 21,626
- Total violent crimes reported in U.S. in 1999: 1,426,044
2000: 281.7 violent crimes per 100,000 people

- Virginia’s violent crime rate in 2000: 281.7 per 100,000 people (13th lowest among the 50 states)
- U.S. violent crime rate in 2000: 506.5 per 100,000 people
- Total violent crimes reported in Virginia in 2000: 19,943
- Total violent crimes reported in U.S. in 2000: 1,425,486
2001: 291.0 violent crimes per 100,000 people

- Virginia’s violent crime rate in 2001: 291.0 per 100,000 people (15th lowest among the 50 states)
- U.S. violent crime rate in 2001: 504.5 per 100,000 people
- Total violent crimes reported in Virginia in 2001: 20,939
- Total violent crimes reported in U.S. in 2001: 1,439,480
2002: 291.7 violent crimes per 100,000 people

- Virginia’s violent crime rate in 2002: 291.7 per 100,000 people (16th lowest among the 50 states)
- U.S. violent crime rate in 2002: 494.4 per 100,000 people
- Total violent crimes reported in Virginia in 2002: 21,256
- Total violent crimes reported in U.S. in 2002: 1,423,677
2003: 278.2 violent crimes per 100,000 people
- Virginia’s violent crime rate in 2003: 278.2 per 100,000 people (15th lowest among the 50 states)
- U.S. violent crime rate in 2003: 475.8 per 100,000 people
- Total violent crimes reported in Virginia in 2003: 20,490
- Total violent crimes reported in U.S. in 2003: 1,383,676
2004: 275.5 violent crimes per 100,000 people
- Virginia’s violent crime rate in 2004: 275.5 per 100,000 people (14th lowest among the 50 states)
- U.S. violent crime rate in 2004: 463.2 per 100,000 people
- Total violent crimes reported in Virginia in 2004: 20,608
- Total violent crimes reported in U.S. in 2004: 1,360,088
2005: 283.4 violent crimes per 100,000 people
- Virginia’s violent crime rate in 2005: 283.4 per 100,000 people (17th lowest among the 50 states)
- U.S. violent crime rate in 2005: 469.0 per 100,000 people
- Total violent crimes reported in Virginia in 2005: 21,434
- Total violent crimes reported in U.S. in 2005: 1,390,745
2006: 283.7 violent crimes per 100,000 people
- Virginia’s violent crime rate in 2006: 283.7 per 100,000 people (13th lowest among the 50 states)
- U.S. violent crime rate in 2006: 479.3 per 100,000 people
- Total violent crimes reported in Virginia in 2006: 21,683
- Total violent crimes reported in U.S. in 2006: 1,435,123
2007: 272.8 violent crimes per 100,000 people
- Virginia’s violent crime rate in 2007: 272.8 per 100,000 people (10th lowest among the 50 states)
- U.S. violent crime rate in 2007: 471.8 per 100,000 people
- Total violent crimes reported in Virginia in 2007: 21,035
- Total violent crimes reported in U.S. in 2007: 1,422,970
2008: 257.8 violent crimes per 100,000 people
- Virginia’s violent crime rate in 2008: 257.8 per 100,000 people (9th lowest among the 50 states)
- U.S. violent crime rate in 2008: 458.6 per 100,000 people
- Total violent crimes reported in Virginia in 2008: 20,031
- Total violent crimes reported in U.S. in 2008: 1,394,461
2009: 230.8 violent crimes per 100,000 people
- Virginia’s violent crime rate in 2009: 230.8 per 100,000 people (7th lowest among the 50 states)
- U.S. violent crime rate in 2009: 431.9 per 100,000 people
- Total violent crimes reported in Virginia in 2009: 18,195
- Total violent crimes reported in U.S. in 2009: 1,325,896
2010: 214.2 violent crimes per 100,000 people
- Virginia’s violent crime rate in 2010: 214.2 per 100,000 people (6th lowest among the 50 states)
- U.S. violent crime rate in 2010: 404.5 per 100,000 people
- Total violent crimes reported in Virginia in 2010: 17,184
- Total violent crimes reported in U.S. in 2010: 1,251,248
2011: 197.6 violent crimes per 100,000 people
- Virginia’s violent crime rate in 2011: 197.6 per 100,000 people (4th lowest among the 50 states)
- U.S. violent crime rate in 2011: 387.1 per 100,000 people
- Total violent crimes reported in Virginia in 2011: 16,014
- Total violent crimes reported in U.S. in 2011: 1,206,031
2012: 191.5 violent crimes per 100,000 people
- Virginia’s violent crime rate in 2012: 191.5 per 100,000 people (3rd lowest among the 50 states)
- U.S. violent crime rate in 2012: 387.8 per 100,000 people
- Total violent crimes reported in Virginia in 2012: 15,676
- Total violent crimes reported in U.S. in 2012: 1,217,057
2013: 197.8 violent crimes per 100,000 people
- Virginia’s violent crime rate in 2013: 197.8 per 100,000 people (3rd lowest among the 50 states)
- U.S. violent crime rate in 2013: 369.1 per 100,000 people
- Total violent crimes reported in Virginia in 2013: 16,355
- Total violent crimes reported in U.S. in 2013: 1,168,298
2014: 198.4 violent crimes per 100,000 people
- Virginia’s violent crime rate in 2014: 198.4 per 100,000 people (5th lowest among the 50 states)
- U.S. violent crime rate in 2014: 361.6 per 100,000 people
- Total violent crimes reported in Virginia in 2014: 16,522
- Total violent crimes reported in U.S. in 2014: 1,153,022
2015: 199.6 violent crimes per 100,000 people
- Virginia’s violent crime rate in 2015: 199.6 per 100,000 people (3rd lowest among the 50 states)
- U.S. violent crime rate in 2015: 373.7 per 100,000 people
- Total violent crimes reported in Virginia in 2015: 16,705
- Total violent crimes reported in U.S. in 2015: 1,199,310
2016: 219.8 violent crimes per 100,000 people
- Virginia’s violent crime rate in 2016: 219.8 per 100,000 people (4th lowest among the 50 states)
- U.S. violent crime rate in 2016: 397.5 per 100,000 people
- Total violent crimes reported in Virginia in 2016: 18,495
- Total violent crimes reported in U.S. in 2016: 1,285,606
2017: 210.4 violent crimes per 100,000 people
- Virginia’s violent crime rate in 2017: 210.4 per 100,000 people (4th lowest among the 50 states)
- U.S. violent crime rate in 2017: 394.9 per 100,000 people
- Total violent crimes reported in Virginia in 2017: 17,811
- Total violent crimes reported in U.S. in 2017: 1,283,875
2018: 204.2 violent crimes per 100,000 people
- Virginia’s violent crime rate in 2018: 204.2 per 100,000 people (4th lowest among the 50 states)
- U.S. violent crime rate in 2018: 383.4 per 100,000 people
- Total violent crimes reported in Virginia in 2018: 17,357
- Total violent crimes reported in U.S. in 2018: 1,252,399
2019: 209.4 violent crimes per 100,000 people
- Virginia’s violent crime rate in 2019: 209.4 per 100,000 people (6th lowest among the 50 states)
- U.S. violent crime rate in 2019: 380.8 per 100,000 people
- Total violent crimes reported in Virginia in 2019: 17,916
- Total violent crimes reported in U.S. in 2019: 1,250,393
2020: 208.7 violent crimes per 100,000 people
- Virginia’s violent crime rate in 2020: 208.7 per 100,000 people (6th lowest among the 50 states)
- U.S. violent crime rate in 2020: 398.5 per 100,000 people
- Total violent crimes reported in Virginia in 2020: 17,925
- Total violent crimes reported in U.S. in 2020: 1,313,105
| Year | Violent crimes per 100,000 people in Virginia | Violent crimes per 100,000 people in the U.S. | Total violent crimes in Virginia | Total violent crimes in U.S. |
|---|---|---|---|---|
| 2020 | 208.7 | 398.5 | 17,925 | 1,313,105 |
| 2019 | 209.4 | 380.8 | 17,916 | 1,250,393 |
| 2018 | 204.2 | 383.4 | 17,357 | 1,252,399 |
| 2017 | 210.4 | 394.9 | 17,811 | 1,283,875 |
| 2016 | 219.8 | 397.5 | 18,495 | 1,285,606 |
| 2015 | 199.6 | 373.7 | 16,705 | 1,199,310 |
| 2014 | 198.4 | 361.6 | 16,522 | 1,153,022 |
| 2013 | 197.8 | 369.1 | 16,355 | 1,168,298 |
| 2012 | 191.5 | 387.8 | 15,676 | 1,217,057 |
| 2011 | 197.6 | 387.1 | 16,014 | 1,206,031 |
| 2010 | 214.2 | 404.5 | 17,184 | 1,251,248 |
| 2009 | 230.8 | 431.9 | 18,195 | 1,325,896 |
| 2008 | 257.8 | 458.6 | 20,031 | 1,394,461 |
| 2007 | 272.8 | 471.8 | 21,035 | 1,422,970 |
| 2006 | 283.7 | 479.3 | 21,683 | 1,435,123 |
| 2005 | 283.4 | 469.0 | 21,434 | 1,390,745 |
| 2004 | 275.5 | 463.2 | 20,608 | 1,360,088 |
| 2003 | 278.2 | 475.8 | 20,490 | 1,383,676 |
| 2002 | 291.7 | 494.4 | 21,256 | 1,423,677 |
| 2001 | 291.0 | 504.5 | 20,939 | 1,439,480 |
| 2000 | 281.7 | 506.5 | 19,943 | 1,425,486 |
| 1999 | 314.7 | 523.0 | 21,626 | 1,426,044 |
| 1998 | 325.7 | 567.6 | 22,115 | 1,533,887 |
| 1997 | 345.2 | 611.0 | 23,249 | 1,636,099 |
| 1996 | 341.3 | 636.6 | 22,782 | 1,688,540 |
| 1995 | 361.5 | 684.5 | 23,921 | 1,798,792 |
Contact [email protected] for any questions or corrections.