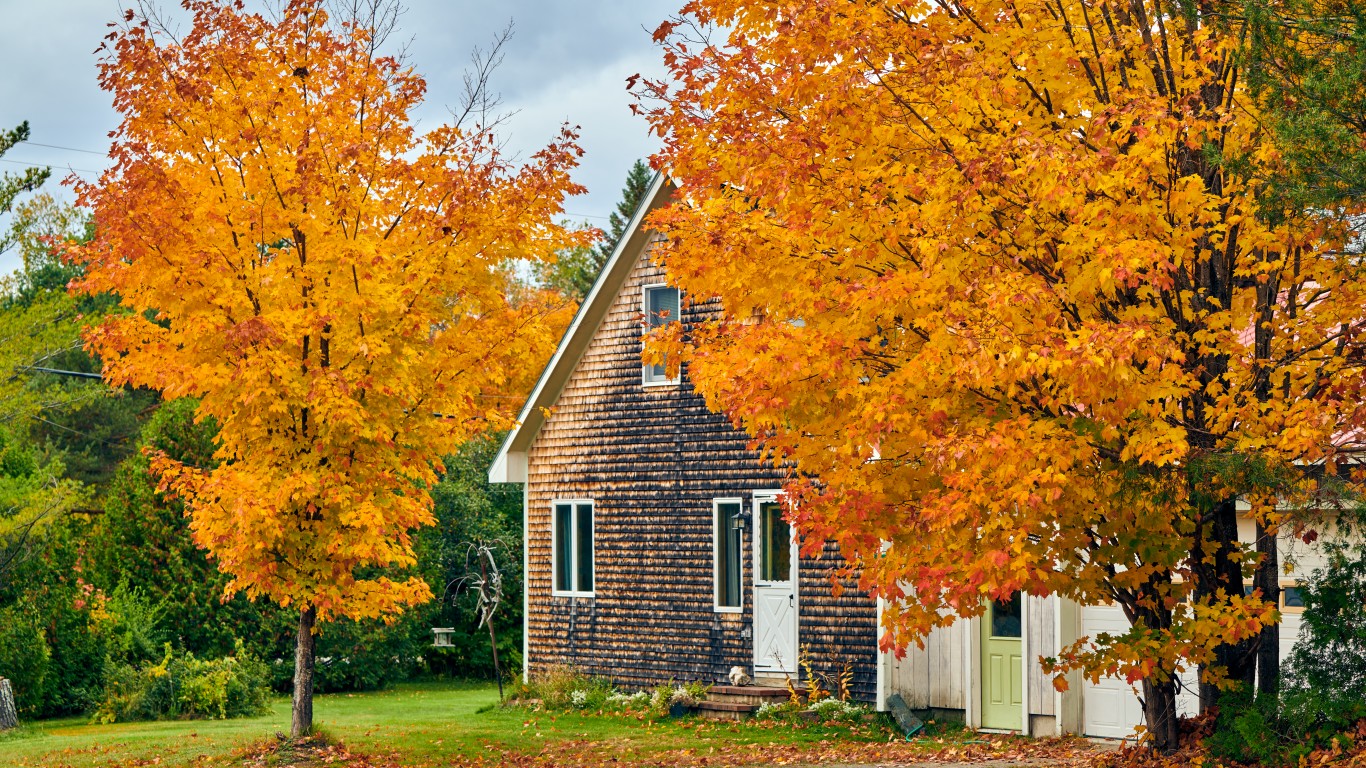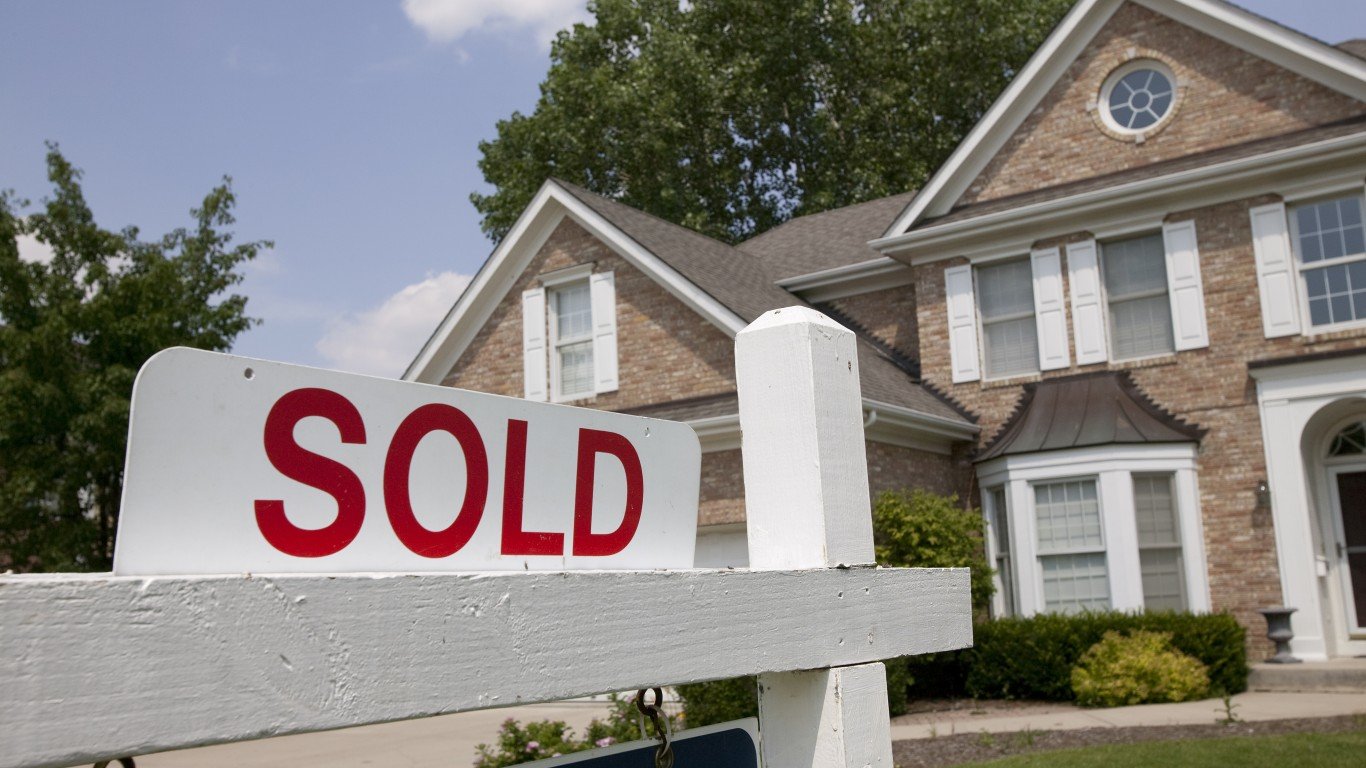
Homeownership is a longstanding aspiration for millions of Americans. According to a Gallup poll, more than nine in every 10 American investors consider owning a home to be either an essential or important component of the American dream. Homeownership can also be one of the best and most practical ways to build wealth — both through appreciation of equity and tax deductions.
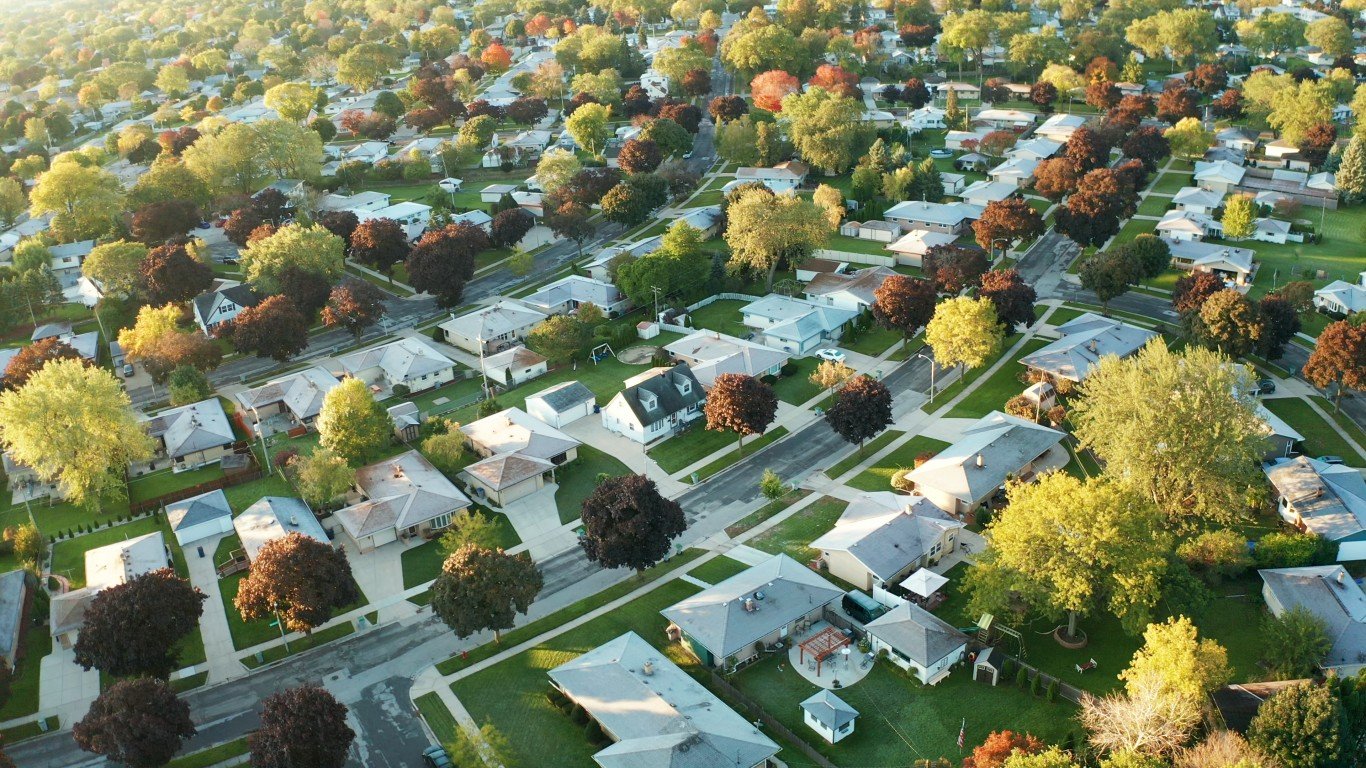
The past year has been historic for the American housing market. A surge in demand, fueled by the COVID-19 pandemic and record-low mortgage rates, helped push the national homeownership rate — or the share of housing units occupied by their owners — to 67.9% in the second quarter of 2020, its highest level in over a decade.
Still, homeownership rates vary considerably in the U.S., and in some parts of the country, people are far more likely to own their homes than in others.
According to the U.S. Census Bureau’s American Community Survey for 2019, the most recent year of available state level data, Washington has the 10th lowest homeownership rate among states, at 63.1%. For reference, the national homeownership that year stood at 64.1%.
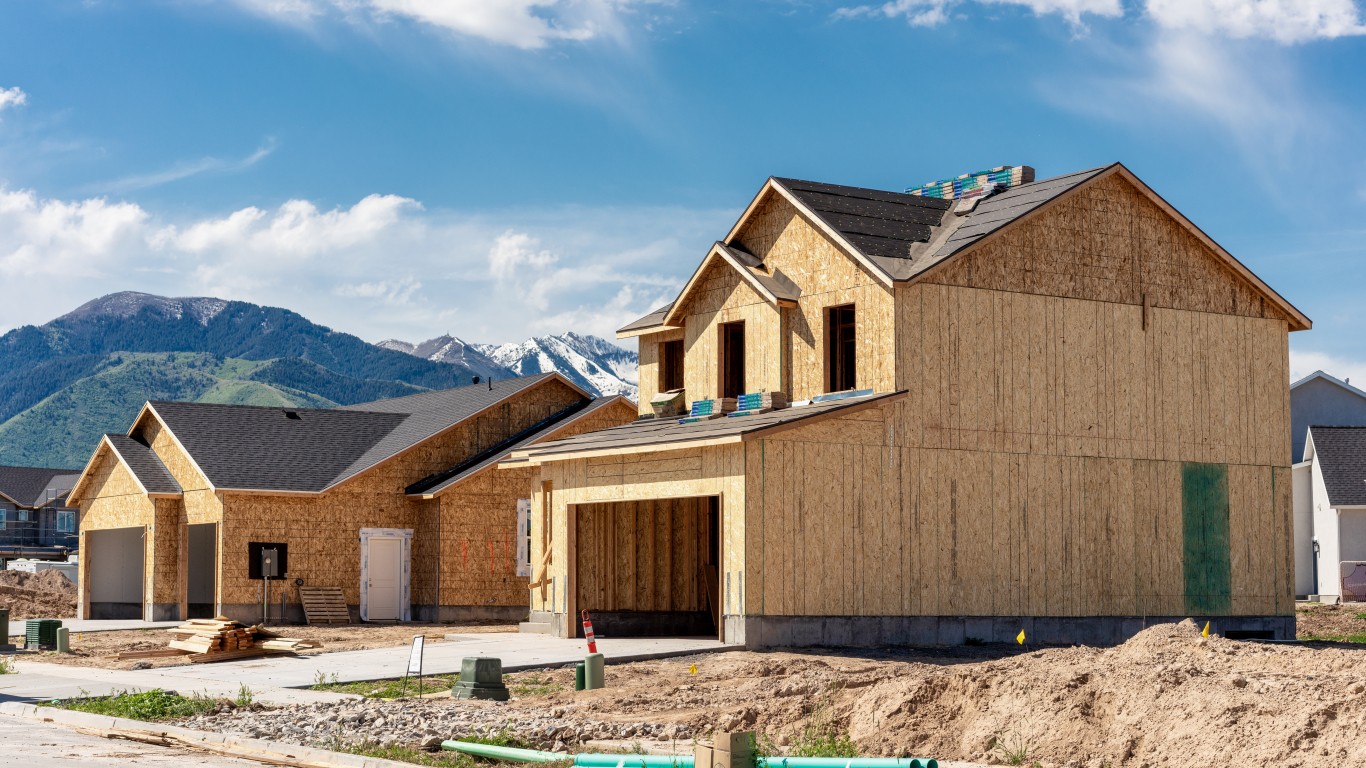
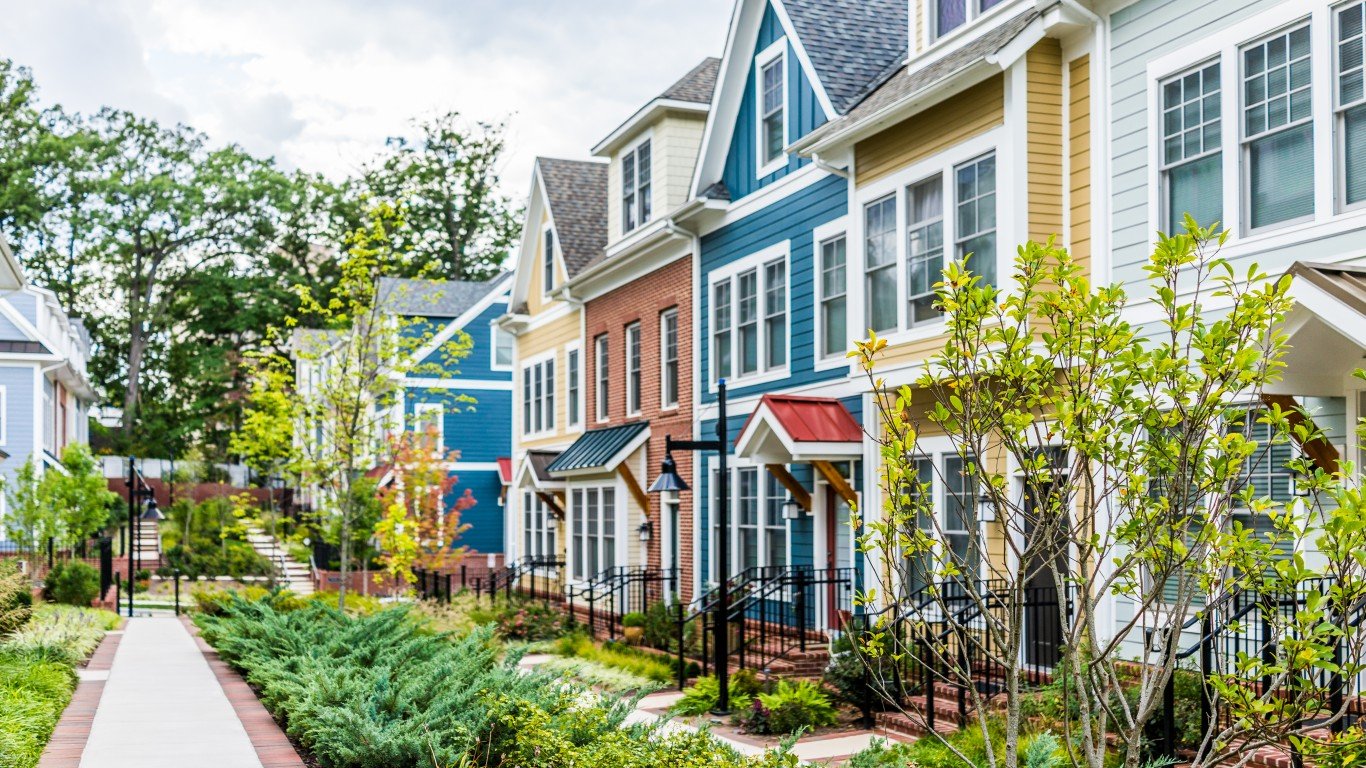
Homeownership rates in different parts of the country are impacted by many factors, and one of them is housing costs. Though it is not always the case, states where real estate is more expensive often have lower than average homeownership rates, while areas where home prices are lower often have high homeownership.
In Washington, the typical home is worth an estimated $387,600, more than the national median of $240,500. The high median home price also likely helps explain why homeowners are more likely than average to be paying down a mortgage. An estimated 67.7% of owner-occupied housing units in the state have a standing mortgage, compared to 61.7% nationwide.
All data used in this story, including supplemental data on the median home value of owner-occupied homes and the percentage of housing units with a mortgage, are from the 2019 ACS. States were ranked based on the number of owner-occupied units as a share of all occupied housing units.
| Rank | State | Homeownership rate (%) | Median home value ($) | Owner-occupied homes with a mortgage (%) |
|---|---|---|---|---|
| 1 | West Virginia | 73.4 | 124,600 | 46.4 |
| 2 | Maine | 72.2 | 200,500 | 60.5 |
| 3 | Minnesota | 71.9 | 246,700 | 65.1 |
| 4 | Wyoming | 71.9 | 235,200 | 59.2 |
| 5 | Michigan | 71.6 | 169,600 | 59.3 |
| 6 | Idaho | 71.6 | 255,200 | 64.3 |
| 7 | New Hampshire | 71.0 | 281,400 | 64.9 |
| 8 | Vermont | 70.9 | 233,200 | 61.7 |
| 9 | Utah | 70.6 | 330,300 | 70.1 |
| 10 | Iowa | 70.5 | 158,900 | 59.9 |
| 11 | Delaware | 70.3 | 261,700 | 65.5 |
| 12 | South Carolina | 70.3 | 179,800 | 58.0 |
| 13 | Indiana | 69.3 | 156,000 | 65.2 |
| 14 | Montana | 68.9 | 253,600 | 55.4 |
| 15 | Alabama | 68.8 | 154,000 | 55.3 |
| 16 | Pennsylvania | 68.4 | 192,600 | 59.1 |
| 17 | New Mexico | 68.1 | 180,900 | 52.9 |
| 18 | South Dakota | 67.8 | 185,000 | 55.6 |
| 19 | Mississippi | 67.3 | 128,200 | 49.1 |
| 20 | Wisconsin | 67.2 | 197,200 | 62.7 |
| 21 | Missouri | 67.1 | 168,000 | 60.2 |
| 22 | Kentucky | 67.0 | 151,700 | 56.9 |
| 23 | Maryland | 66.8 | 332,500 | 71.9 |
| 24 | Tennessee | 66.5 | 191,900 | 58.2 |
| 25 | Louisiana | 66.5 | 172,100 | 51.7 |
| 26 | Kansas | 66.5 | 163,200 | 57.9 |
| 27 | Nebraska | 66.3 | 172,700 | 59.5 |
| 28 | Florida | 66.2 | 245,100 | 56.3 |
| 29 | Virginia | 66.1 | 288,800 | 67.7 |
| 30 | Ohio | 66.0 | 157,200 | 62.1 |
| 31 | Illinois | 66.0 | 209,100 | 62.4 |
| 32 | Colorado | 65.9 | 394,600 | 70.8 |
| 33 | Oklahoma | 65.5 | 147,000 | 54.4 |
| 34 | Arkansas | 65.5 | 136,200 | 53.0 |
| 35 | North Carolina | 65.3 | 193,200 | 63.2 |
| 36 | Arizona | 65.3 | 255,900 | 62.4 |
| 37 | Connecticut | 65.0 | 280,700 | 66.2 |
| 38 | Alaska | 64.7 | 281,200 | 60.8 |
| 39 | Georgia | 64.1 | 202,500 | 64.2 |
| 40 | New Jersey | 63.3 | 348,800 | 65.6 |
| 41 | Washington | 63.1 | 387,600 | 67.7 |
| 42 | Oregon | 62.9 | 354,600 | 66.1 |
| 43 | Massachusetts | 62.2 | 418,600 | 68.3 |
| 44 | Texas | 61.9 | 200,400 | 56.1 |
| 45 | Rhode Island | 61.7 | 283,000 | 66.3 |
| 46 | North Dakota | 61.3 | 205,400 | 52.1 |
| 47 | Hawaii | 60.2 | 669,200 | 64.4 |
| 48 | Nevada | 56.6 | 317,800 | 67.4 |
| 49 | California | 54.9 | 568,500 | 69.0 |
| 50 | New York | 53.5 | 338,700 | 59.6 |