Maryland Has a Gun Trafficking Problem
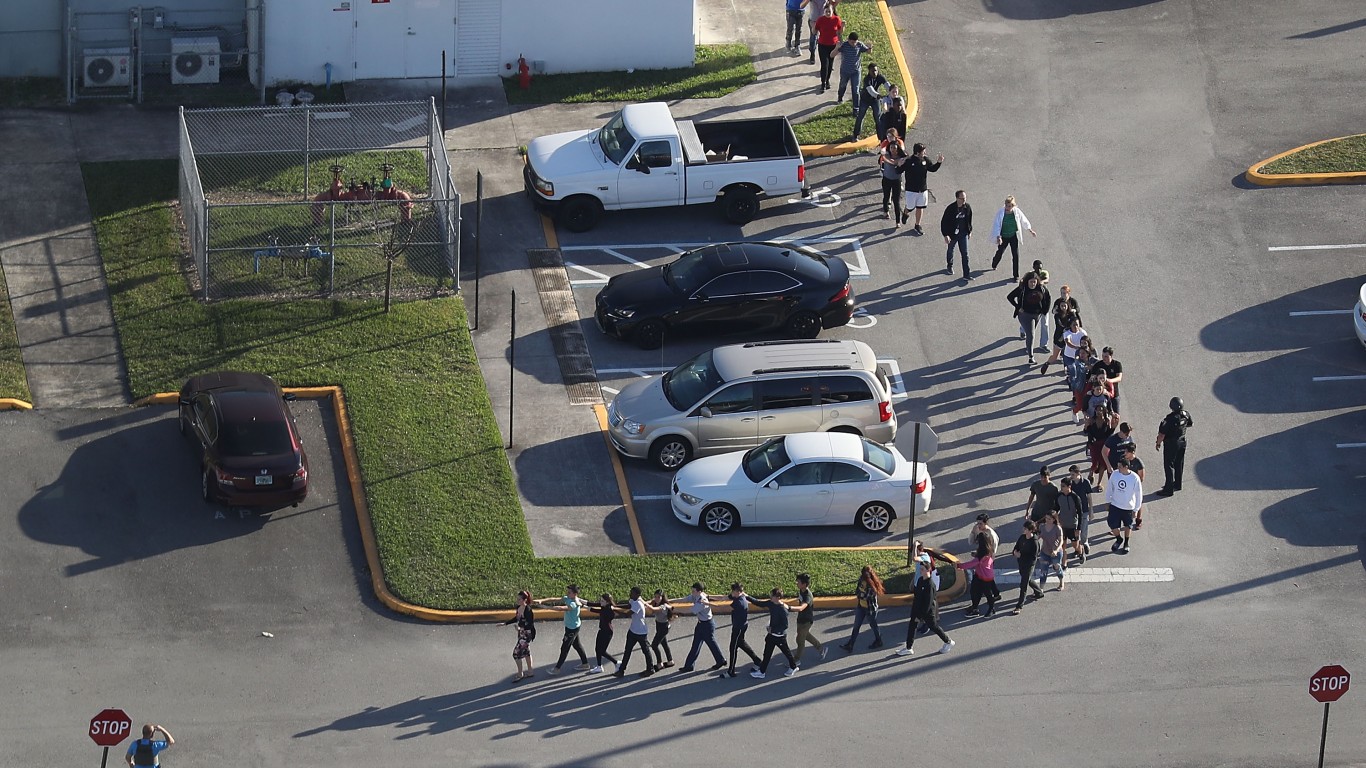
Gun violence is a growing problem in the United States. Active shooter incidents surged by over 50% in 2021 compared to the previous year, and the share of violent crimes involving firearms climbed by over 30%, according to the FBI.…

Gun violence is a growing problem in the United States. Active shooter incidents surged by over 50% in 2021 compared to the previous year, and the share of violent crimes involving firearms climbed by over 30%, according to the FBI. While the right to gun ownership is enshrined in the Constitution, keeping guns out of the wrong hands is a persistent challenge – and one that some states appear to be taking more seriously than others. (These are the firearm calibers used the most to commit crimes in the U.S.)
Several states, largely concentrated in the Northeast and along the West Coast, have relatively tight gun restrictions. These can include, but are not limited to, mandatory waiting periods, universal background checks, and restrictions on certain types of firearms and ammunition.
In most of the rest of the country, however, gun control laws are considerably more lax. The resulting patchwork of regulations has helped create a thriving black market for gun trafficking. Each year, thousands of firearms that were purchased in states with virtually no gun control laws end up in the hands of criminals in states with tight firearm restrictions.
According to 2021 data from the Bureau of Alcohol, Tobacco, Firearms, and Explosives, 56.2% of traced guns in Maryland were sold by an out-of-state retailer – the sixth largest share in the country. Firearms traced by the ATF typically have been used, or are suspected to have been used, to commit a crime.
Of all guns traced in Maryland, 16.8% came from Virginia, the largest out-of-state source. Georgia and Pennsylvania accounted for the second and third largest shares, at 5.6% and 4.8% respectively.
All data in this story is from the ATF and is for 2021. It is important to note that not all guns determined to have come from out of state were necessarily trafficked.
| Rank | State | Pct. of guns from out-of-state, 2021 (%) | 2021 Traced guns from out-of-state | Top feeder state | 2nd-ranked feeder state | 3rd-ranked feeder state |
|---|---|---|---|---|---|---|
| 15 | Minnesota | 30.0 | 1,158 | Wisconsin | Florida | North Dakota |
| 14 | North Dakota | 31.5 | 196 | Minnesota | Texas | Montana |
| 13 | Delaware | 31.5 | 422 | Pennsylvania | Virginia | Georgia |
| 12 | Idaho | 33.0 | 376 | Washington | Oregon | Montana |
| 11 | Nebraska | 36.1 | 645 | Iowa | Texas | Missouri |
| 10 | Wyoming | 41.0 | 94 | Colorado | Montana | Idaho |
| 9 | Rhode Island | 46.1 | 237 | Massachusetts | Florida | New Hampshire |
| 8 | California | 50.4 | 15,942 | Arizona | Nevada | Texas |
| 7 | Illinois | 53.0 | 7,837 | Indiana | Missouri | Wisconsin |
| 6 | Maryland | 56.2 | 3,776 | Virginia | Georgia | Pennsylvania |
| 5 | Connecticut | 56.7 | 648 | Florida | Georgia | South Carolina |
| 4 | Massachusetts | 69.1 | 1,461 | New Hampshire | Georgia | Maine |
| 3 | Hawaii | 78.9 | 45 | Alaska | California | Florida |
| 2 | New Jersey | 83.8 | 2,682 | Pennsylvania | Georgia | South Carolina |
| 1 | New York | 84.6 | 5,835 | Georgia | Virginia | South Carolina |
Sam Stebbins is a writer at 247WallSt.com where his primary focus is on government policy, politics, companies, and broad social and economic trends. Sam has been writing in the money and news verticals for over 8 years and holds a bachelor's degree from Hobart College, which he earned in 2010. Sam resides in upstate New York and enjoys hiking, biking, canoeing, and skiing in the Adirondack Mountains and across the Northeast.