This Is How Many People Are Refusing the COVID-19 Vaccine in Washington
As the U.S. braces for winter and flu season, the national COVID-19 vaccination effort is as urgent as it ever has been. Still, many Americans remain hesitant. According to a recent survey conducted by the U.S. Census Bureau, 26,870,000 Americans…

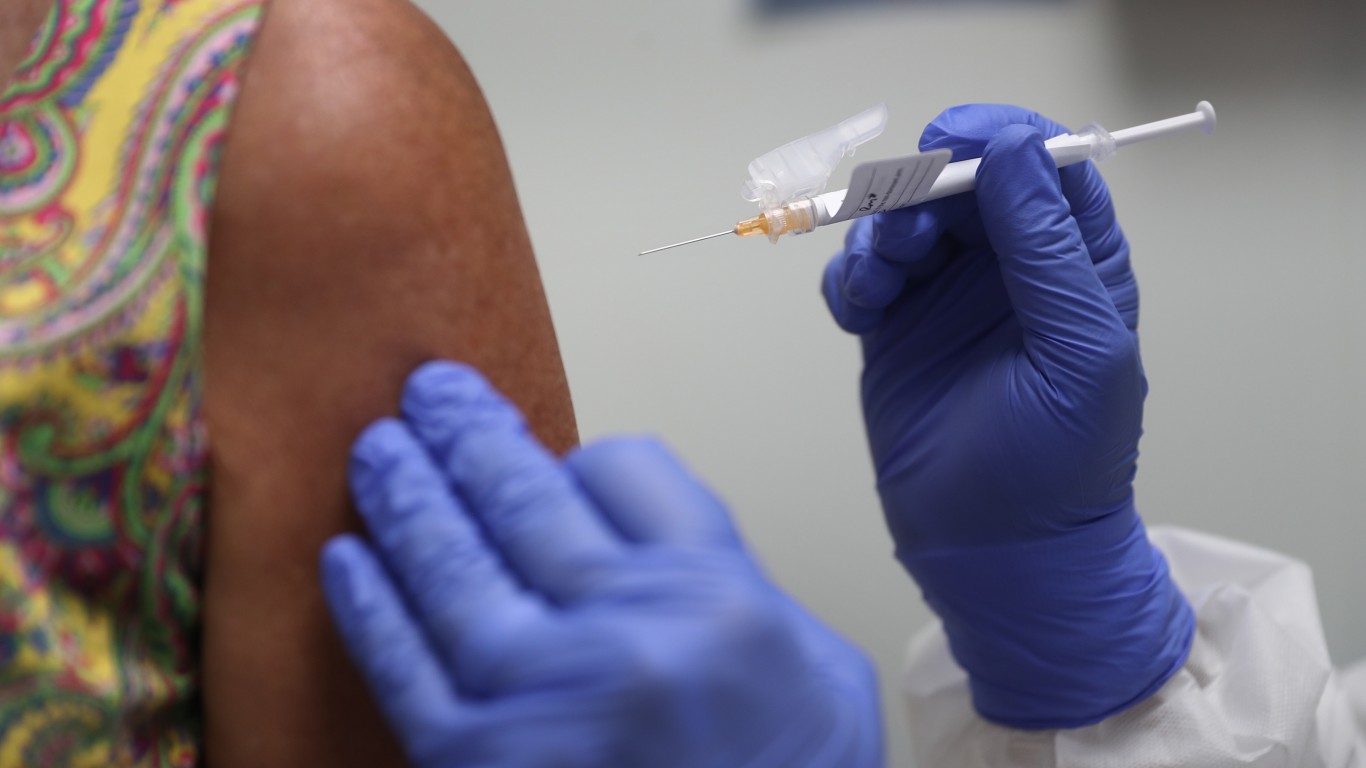
As the U.S. braces for winter and flu season, the national COVID-19 vaccination effort is as urgent as it ever has been. Still, many Americans remain hesitant.
According to a recent survey conducted by the U.S. Census Bureau, 26,870,000 Americans — or 10.8% of the 18 and older population — say they will either probably or definitely not get the vaccination.
Many Americans who have yet to be vaccinated cite one of three reasons: either they are concerned about possible side effects, or they want to wait to see if it is safe, or it is difficult for them to obtain a vaccination. Others cite different reasons.
Nationwide, 17,000,000 people, 6.8% of the adult population, do not trust the COVID-19 vaccines, and another 9,970,000, or 4.0%, do not think COVID-19 is a big threat. Additionally, 15,250,000 American adults, or 6.1% of the 18 and older population, have not been vaccinated because they do not trust the government.
In Washington, an estimated 418,300 adults, or 7.1%, say they will likely refuse the vaccine. Of all adults in the state, 4.1% will refuse because they do not trust the COVID-19 vaccine specifically, 3.5% because they do not think COVID-19 is a big threat, and 5.1% because they distrust the government.
Despite pockets of resistance, Washington is doing a better job at vaccinating its population quickly than most states. So far, 64.5% of Washington’s population are fully vaccinated, compared to 59.2% of all Americans.
Meanwhile, the virus continues to spread. Since the beginning of the pandemic, there have been 733,535 confirmed cases of the virus in the Washington, and a total of 8,727 residents have died as a result.
All survey data used in this story was published by the Census on Oct. 20, 2021. All data related to COVID-19 infections, fatalities, and vaccinations is current as of Nov. 5, 2021.
| State | Share adult pop. of who will likely refuse vaccination | Pop. currently fully vaccinated | Total COVID-19 infections to date | Total COVID-19 deaths to date |
|---|---|---|---|---|
| Alabama | 15.5% | 45.2% | 834,582 | 15,734 |
| Alaska | 13.6% | 52.5% | 135,325 | 711 |
| Arizona | 11.3% | 54.3% | 1,175,520 | 21,273 |
| Arkansas | 13.7% | 48.4% | 514,539 | 8,434 |
| California | 7.9% | 61.7% | 4,919,465 | 71,646 |
| Colorado | 8.6% | 62.7% | 752,998 | 8,308 |
| Connecticut | 6.0% | 70.9% | 404,218 | 8,776 |
| Delaware | 9.7% | 60.6% | 144,755 | 2,096 |
| Florida | 11.7% | 60.6% | 3,656,010 | 59,499 |
| Georgia | 12.0% | 49.1% | 1,638,606 | 29,310 |
| Hawaii | 11.9% | 59.9% | 81,850 | 911 |
| Idaho | 14.9% | 45.1% | 294,485 | 3,600 |
| Illinois | 13.5% | 60.6% | 1,705,777 | 28,772 |
| Indiana | 11.0% | 50.4% | 1,025,957 | 16,841 |
| Iowa | 14.7% | 55.8% | 491,463 | 7,069 |
| Kansas | 14.0% | 53.6% | 438,196 | 6,448 |
| Kentucky | 13.2% | 51.1% | 748,202 | 9,856 |
| Louisiana | 16.4% | 47.9% | 760,691 | 14,585 |
| Maine | 10.4% | 71.3% | 106,469 | 1,197 |
| Maryland | 4.7% | 66.3% | 563,696 | 10,939 |
| Massachusetts | 7.0% | 69.9% | 857,959 | 19,046 |
| Michigan | 15.1% | 53.7% | 1,297,496 | 23,879 |
| Minnesota | 10.6% | 61.9% | 807,956 | 8,885 |
| Mississippi | 12.5% | 45.9% | 505,661 | 10,134 |
| Missouri | 15.5% | 50.2% | 858,900 | 12,213 |
| Montana | 18.0% | 51.2% | 178,980 | 2,396 |
| Nebraska | 14.9% | 56.7% | 288,257 | 2,988 |
| Nevada | 12.7% | 54.2% | 453,297 | 7,677 |
| New Hampshire | 6.8% | 63.5% | 137,778 | 1,581 |
| New Jersey | 5.4% | 66.6% | 1,202,251 | 28,011 |
| New Mexico | 8.1% | 62.5% | 279,670 | 5,085 |
| New York | 5.9% | 66.9% | 2,571,790 | 56,116 |
| North Carolina | 11.4% | 53.7% | 1,485,455 | 18,191 |
| North Dakota | 17.8% | 48.0% | 150,467 | 1,784 |
| Ohio | 13.6% | 52.2% | 1,556,208 | 24,763 |
| Oklahoma | 16.4% | 50.7% | 647,637 | 10,929 |
| Oregon | 11.0% | 63.6% | 369,815 | 4,469 |
| Pennsylvania | 13.9% | 61.1% | 1,575,184 | 31,711 |
| Rhode Island | 7.9% | 71.5% | 180,488 | 2,881 |
| South Carolina | 14.8% | 51.0% | 900,464 | 13,802 |
| South Dakota | 18.2% | 53.4% | 156,123 | 2,253 |
| Tennessee | 13.1% | 48.4% | 1,284,527 | 16,450 |
| Texas | 10.0% | 54.2% | 4,233,278 | 70,293 |
| Utah | 14.3% | 54.9% | 556,463 | 3,262 |
| Vermont | 4.2% | 71.4% | 37,783 | 357 |
| Virginia | 5.6% | 63.7% | 932,173 | 14,089 |
| Washington | 7.1% | 64.5% | 733,535 | 8,727 |
| West Virginia | 14.8% | 40.8% | 274,508 | 4,490 |
| Wisconsin | 14.9% | 58.7% | 893,028 | 9,495 |
| Wyoming | 25.0% | 44.4% | 104,403 | 1,243 |