One of the most prosperous countries in the world, the United States has built a reputation as the land of opportunity. While this may be an oversimplification, many affluent areas across the country serve as a testament to Americans’ continued ability to build wealth and financial stability.
In every state, there are counties or county equivalents where the median annual household income is well above the $62,843 national median. In over half of all states there is at least one county where the median annual household income is greater than $85,000. Using five-year estimates from the 2019 American Community Survey from the Census, 24/7 Wall St. identified the richest county in every state.
While there are several notable exceptions, many of the wealthiest counties in each state are part of, or in close proximity to, a major metropolitan area. Large metropolitan areas are often hubs of economic activity.
Hamilton County is located in central Indiana, just north of Indianapolis. By far the wealthiest county in the state, the median household income of $98,173 in Hamilton County is about $15,000 higher than the median income in Boone County, Indiana’s second wealthiest county, and $41,900 higher than the state median.
Many of the wealthiest counties nationwide are in close proximity to major cities, which serve as regional economic hubs. With access to jobs in Indianapolis, the unemployment rate in Hamilton County is just 3.3%, well below the comparable 4.9% state and 6.4% national jobless rates.
| State | Poorest County | Largest Place in County | Median Household Income | State Median Household Income | Poverty Rate | State Poverty Rate | Adult Bachelor’s Attainment Rate | State Adult Bachelor’s Attainment Rate | Unemployment, Nov. 2020 | State Unemployment |
|---|---|---|---|---|---|---|---|---|---|---|
| Alabama | Shelby County | Hoover | $77,799 | $50,536 | 7.5% | 16.7% | 42.9% | 25.5% | 2.5% | 4.0% |
| Alaska | Juneau City and Borough | Juneau | $88,390 | $77,640 | 7.7% | 10.7% | 38.4% | 29.6% | 6.5% | 8.1% |
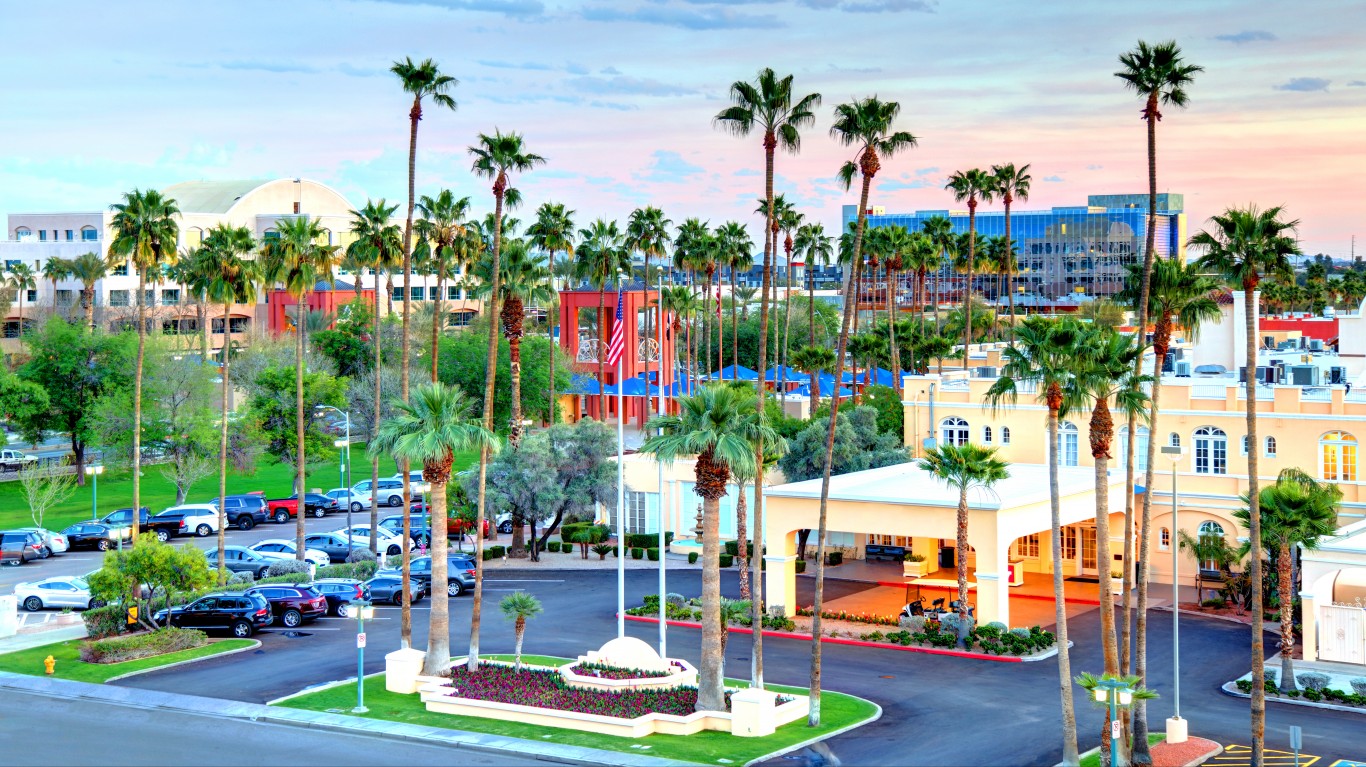
| Arizona | Maricopa County | Phoenix | $64,468 | $58,945 | 13.8% | 15.1% | 32.7% | 29.5% | 7.2% | 7.6% |
| Arkansas | Benton County | Rogers | $66,362 | $47,597 | 9.4% | 17.0% | 33.4% | 23.0% | 4.2% | 5.7% |
| California | Santa Clara County | San Jose | $124,055 | $75,235 | 7.5% | 13.4% | 52.4% | 33.9% | 5.1% | 7.9% |
| Colorado | Douglas County | Highlands Ranch | $119,730 | $72,331 | 3.1% | 10.3% | 58.0% | 40.9% | 4.6% | 6.2% |
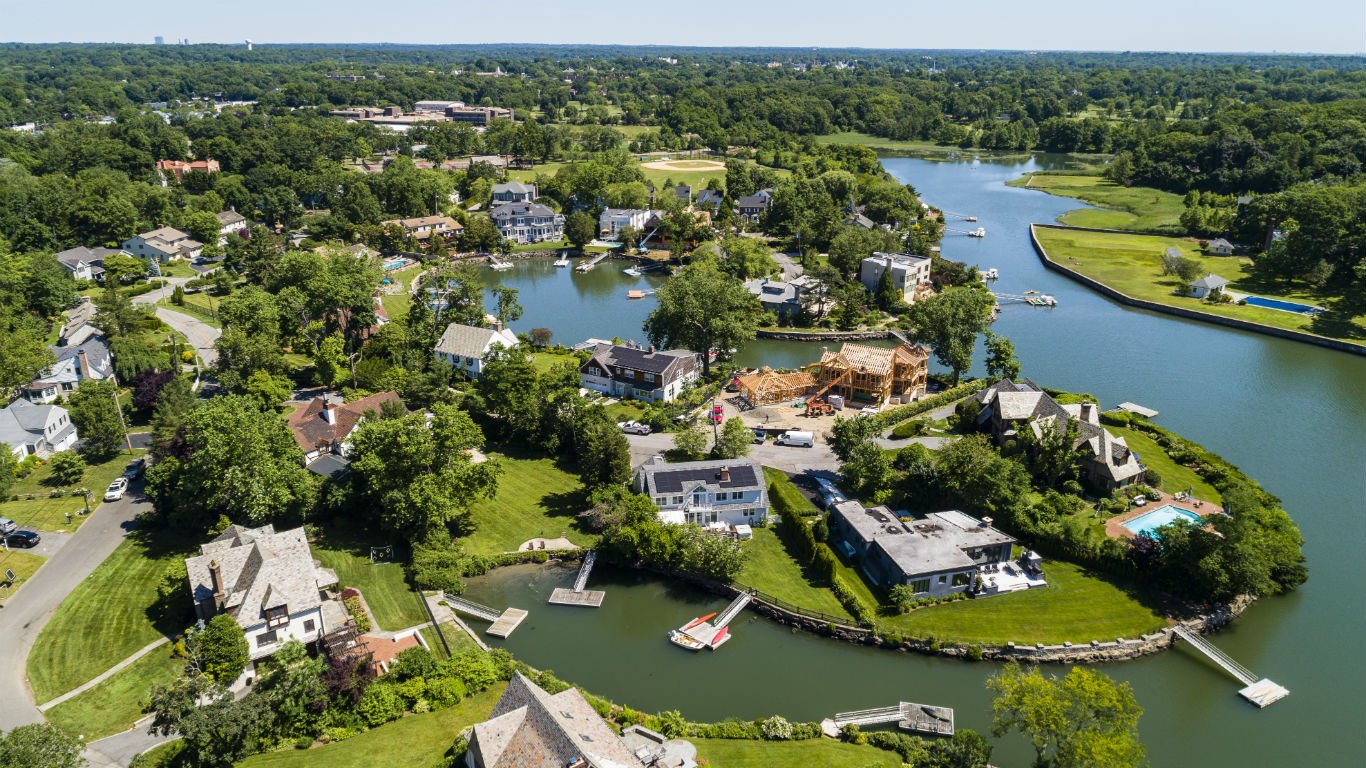
| Connecticut | Fairfield County | Bridgeport | $95,645 | $78,444 | 8.9% | 9.9% | 47.9% | 39.3% | 7.7% | 7.7% |
| Delaware | New Castle County | Wilmington | $73,892 | $68,287 | 11.4% | 11.8% | 36.2% | 32.0% | 4.8% | 4.7% |
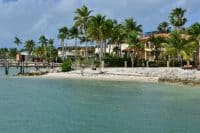
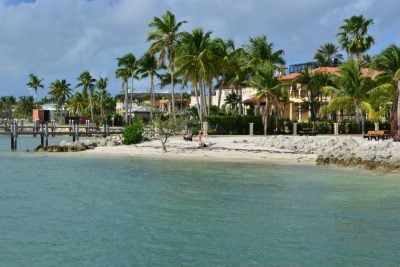
| Florida | St. Johns County | Fruit Cove | $82,252 | $55,660 | 8.2% | 14.0% | 44.7% | 29.9% | 4.0% | 6.3% |
| Georgia | Forsyth County | Cumming | $107,218 | $58,700 | 5.7% | 15.1% | 53.1% | 31.3% | 3.3% | 5.4% |
| Hawaii | Honolulu County | Honolulu | $85,857 | $81,275 | 8.3% | 9.4% | 35.0% | 33.0% | 8.8% | 10.1% |
| Idaho | Teton County | Victor | $74,216 | $55,785 | 4.5% | 13.1% | 41.0% | 27.6% | 5.8% | 4.8% |
| Illinois | Kendall County | Oswego | $96,563 | $65,886 | 4.5% | 12.5% | 36.2% | 34.7% | 5.3% | 6.5% |
| Indiana | Hamilton County | Carmel | $98,173 | $56,303 | 4.6% | 13.4% | 59.3% | 26.5% | 3.3% | 4.9% |
| Iowa | Dallas County | Waukee | $88,479 | $60,523 | 5.2% | 11.5% | 50.4% | 28.6% | 2.2% | 3.1% |
| Kansas | Johnson County | Overland Park | $89,087 | $59,597 | 5.4% | 12.0% | 56.0% | 33.4% | 4.8% | 5.3% |
| Kentucky | Oldham County | La Grange | $99,128 | $50,589 | 5.9% | 17.3% | 42.4% | 24.2% | 3.5% | 5.1% |
| Louisiana | Ascension Parish | Gonzales | $80,527 | $49,469 | 10.6% | 19.2% | 26.4% | 24.1% | 6.2% | 8.1% |
| Maine | Cumberland County | Portland | $73,072 | $57,918 | 9.0% | 11.8% | 47.6% | 31.8% | 4.3% | 4.7% |
| Maryland | Howard County | Columbia | $121,160 | $84,805 | 5.0% | 9.2% | 62.6% | 40.2% | 4.9% | 6.6% |
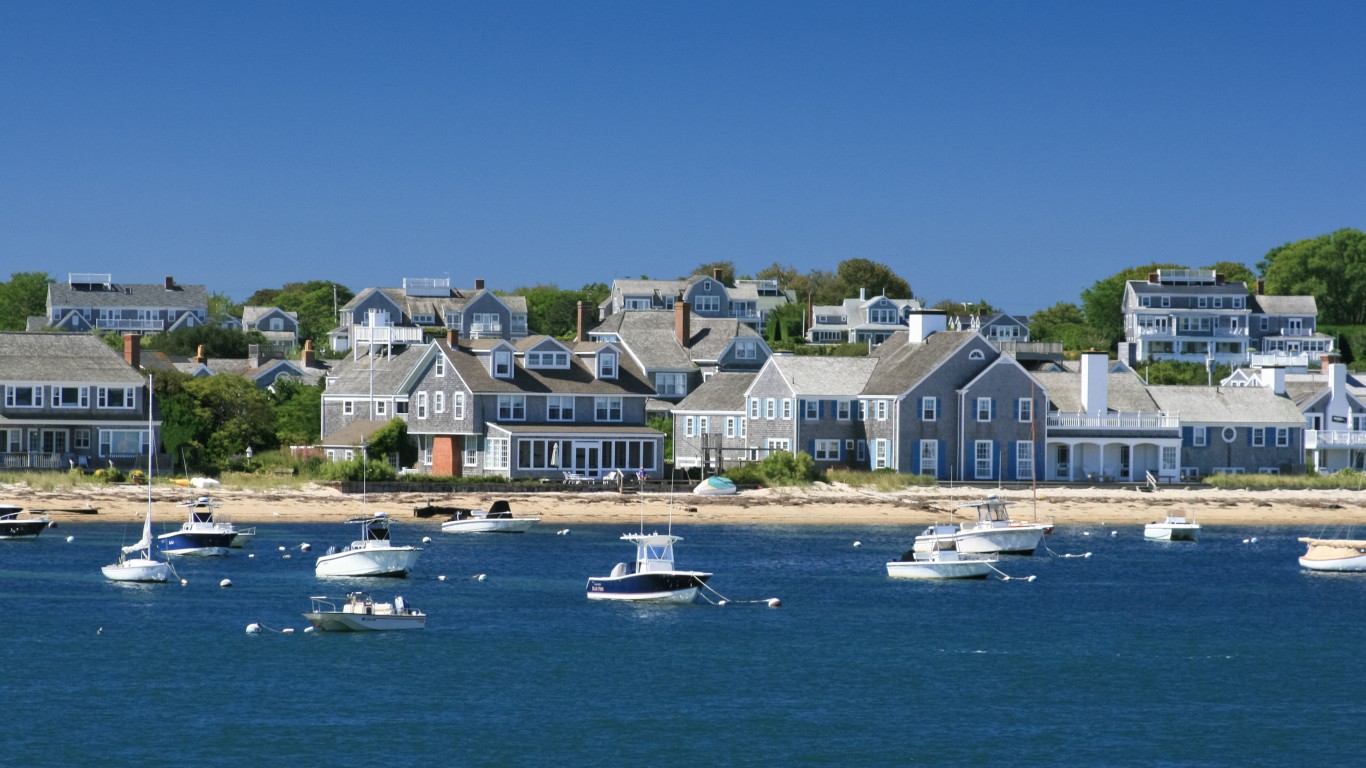
| Massachusetts | Nantucket County | Nantucket | $107,717 | $81,215 | 8.7% | 10.3% | 52.8% | 43.7% | 6.6% | 6.2% |
| Michigan | Livingston County | Howell | $84,221 | $57,144 | 5.2% | 14.4% | 35.4% | 29.1% | 5.9% | 6.3% |
| Minnesota | Scott County | Shakopee | $102,152 | $71,306 | 5.5% | 9.7% | 39.9% | 36.1% | 3.4% | 3.9% |
| Mississippi | Madison County | Madison | $71,824 | $45,081 | 9.6% | 20.3% | 48.4% | 22.0% | 4.4% | 6.0% |
| Missouri | St. Charles County | St. Charles | $84,978 | $55,461 | 5.2% | 13.7% | 38.9% | 29.2% | 3.1% | 3.9% |
| Montana | Jefferson County | Montana City | $69,646 | $54,970 | 7.8% | 13.1% | 35.0% | 32.0% | 3.7% | 4.3% |
| Nebraska | Sarpy County | Bellevue | $82,032 | $61,439 | 5.9% | 11.1% | 39.8% | 31.9% | 2.4% | 2.7% |
| Nevada | Elko County | Elko | $81,232 | $60,365 | 11.7% | 13.1% | 16.6% | 24.7% | 3.8% | 9.9% |
| New Hampshire | Rockingham County | Derry | $93,756 | $76,768 | 4.6% | 7.6% | 41.4% | 37.0% | 3.6% | 3.5% |
| New Jersey | Morris County | Morristown | $115,527 | $82,545 | 4.8% | 10.0% | 54.1% | 39.7% | 8.1% | 9.9% |
| New Mexico | Los Alamos County | Los Alamos | $121,324 | $49,754 | 4.4% | 19.1% | 67.4% | 27.3% | 3.2% | 7.3% |
| New York | Nassau County | Hempstead | $116,100 | $68,486 | 5.6% | 14.1% | 46.0% | 36.6% | 5.5% | 8.1% |
| North Carolina | Wake County | Raleigh | $80,591 | $54,602 | 9.1% | 14.7% | 52.8% | 31.3% | 5.2% | 6.1% |
| North Dakota | Williams County | Williston | $87,161 | $64,894 | 6.1% | 10.7% | 23.6% | 30.0% | 10.7% | 4.1% |
| Ohio | Delaware County | Delaware | $106,908 | $56,602 | 4.8% | 14.0% | 54.3% | 28.3% | 3.6% | 5.2% |
| Oklahoma | Canadian County | Oklahoma City | $72,056 | $52,919 | 8.2% | 15.7% | 27.4% | 25.5% | 5.1% | 5.8% |
| Oregon | Washington County | Hillsboro | $82,215 | $62,818 | 8.9% | 13.2% | 44.4% | 33.7% | 4.8% | 5.5% |
| Pennsylvania | Chester County | West Chester | $100,214 | $61,744 | 6.4% | 12.4% | 53.0% | 31.4% | 4.1% | 6.1% |
| Rhode Island | Washington County | Westerly | $85,531 | $67,167 | 8.6% | 12.4% | 46.1% | 34.2% | 5.8% | 7.0% |
| South Carolina | Beaufort County | Hilton Head Island | $68,377 | $53,199 | 10.2% | 15.2% | 41.2% | 28.1% | 3.3% | 4.1% |
| South Dakota | Lincoln County | Sioux Falls | $82,473 | $58,275 | 4.1% | 13.1% | 37.6% | 28.8% | 2.6% | 3.3% |
| Tennessee | Williamson County | Franklin | $112,962 | $53,320 | 4.4% | 15.2% | 59.8% | 27.3% | 3.3% | 5.0% |
| Texas | Rockwall County | Rowlett | $100,920 | $61,874 | 4.7% | 14.7% | 40.7% | 29.9% | 6.0% | 8.0% |
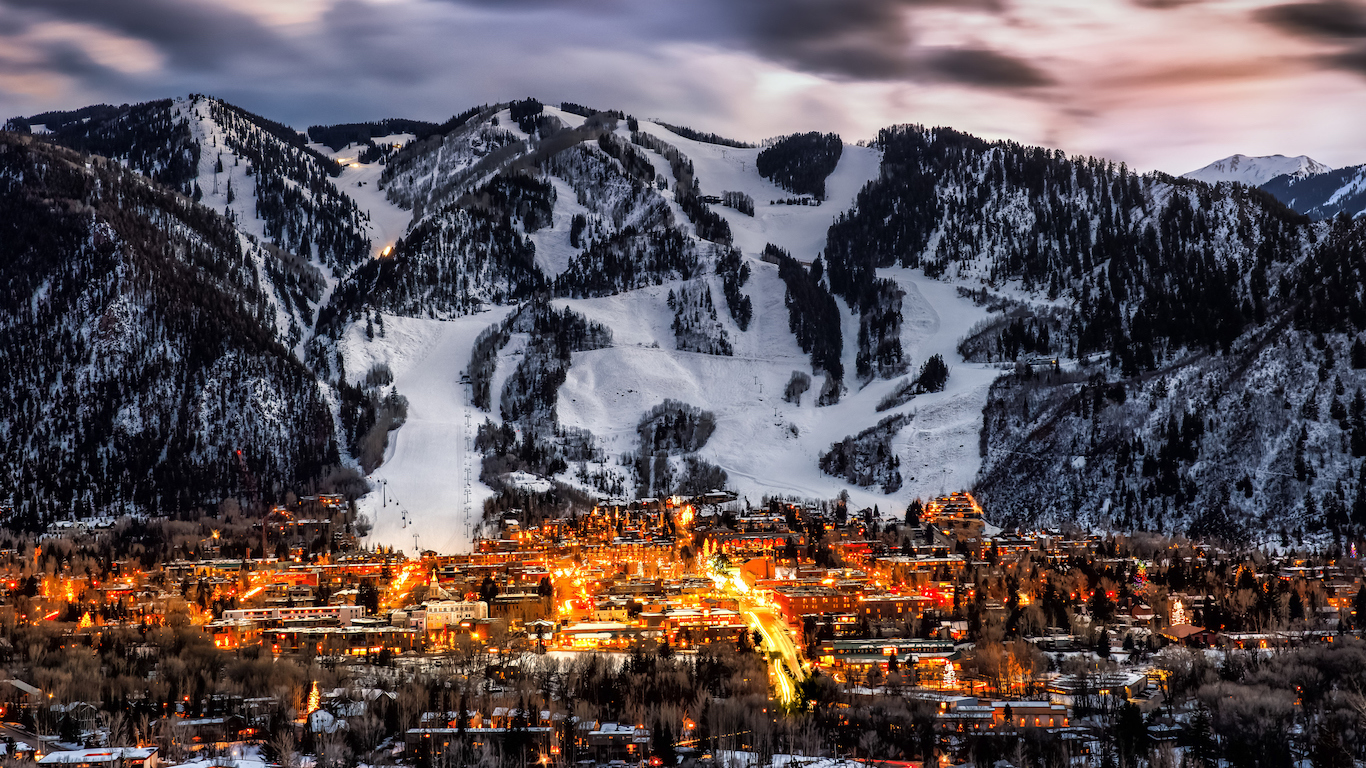
| Utah | Summit County | Park City | $102,958 | $71,621 | 5.6% | 9.8% | 55.0% | 34.0% | 5.6% | 3.9% |
| Vermont | Chittenden County | Burlington | $73,647 | $61,973 | 12.1% | 10.9% | 51.3% | 38.0% | 2.5% | 2.8% |
| Virginia | Loudoun County | Leesburg | $142,299 | $74,222 | 3.4% | 10.6% | 61.3% | 38.8% | 3.9% | 4.6% |
| Washington | King County | Seattle | $94,974 | $73,775 | 8.9% | 10.8% | 52.5% | 36.0% | 4.3% | 5.9% |
| West Virginia | Jefferson County | Corporation of Ranson | $80,430 | $46,711 | 9.7% | 17.6% | 31.8% | 20.6% | 4.0% | 5.7% |
| Wisconsin | Waukesha County | Waukesha | $87,277 | $61,747 | 4.8% | 11.3% | 44.5% | 30.1% | 4.0% | 4.5% |
| Wyoming | Teton County | Jackson | $84,678 | $64,049 | 6.1% | 11.0% | 57.0% | 27.4% | 5.8% | 4.9% |