Many technology stocks have soared in 2020 as the lock-down economy and work from home theme seems to be a completely different work experience now. Companies which make some of the more commoditized components rather than the highly specialized components have not enjoyed a fabulous year. One stock that has been trying to remedy that lack of massive upside is Micron Technology, Inc. (NASDAQ: MU | MU Price Prediction).
It is important to understand that Micron has already reported earnings. That report was viewed with a mixed reaction, but it also seems that the bar was set rather low for an industry that is expected to start working through inventory, supply and technical hiccups in the coming months. With other positive forecasts being shown by semiconductor plays, Micron might be a large beneficiary of earnings season even though it has already issued its report.
Unlike most of the technology companies announcing earnings in the next two to three weeks, Micron already reported earnings at the end of September. Analysts on Wall Street gave it a mixed view, but some analysts are still quite positive and optimistic about Micron’s valuations now that 2021 is closer. Micron’s stock chart is also showing some serious indications that it may be on the verge of a breakout to the upside.
[nativounit]
24/7 Wall St. would never recommend using any one analyst call as a sole basis to buy or sell a stock. That said, it’s always interesting to see what happens when analysts issue ratings and target price changes after key events when the opinions vary greatly.
On October 13, a analyst upgrade came from Deutsche Bank, with the firm raising the rating to Buy from Hold and raising the price target to $60 from $51 in the call. What is interesting about the new upgrade is that Deutsche Bank had maintained as Hold rating and raised its target price to $51 from $48 right after earnings.
On September 30, multiple analysts maintained and/or reiterated their ratings with price target changes:
- CFRA (Hold) target to $53 from $55.
- Cowen (Outperform) target to $57 from $60.
- Mizuho (Buy) target to $56 from $58.
- Needham (Buy) target to $65 from $70.
- Piper Sandler (Neutral) target to $45 from $51.
- RBC Capital Markets (Outperform) target to $57 from $60.
- UBS (Buy) target to $61 from $63.
One of the more cautious reports after earnings came from Wedbush Securities. The firm maintained its Neutral and its $55 price target. Its report suggested that Micron’s gross margin projections were disappointing, and the firm noted that average selling price declines would be exacerbated by mix effects that negatively impact production cost reductions. The firm further noted that Micron has indicated Huawei is a singular revenue drag with no real offsetting positive impact from better orders ahead of US export restrictions.
After earnings, BofA Securities reiterate its Buy and $67 price objective due to DRAM (high margin), free cash flow and a nearly being worth its book value for value investors. BofA further pointed to its quarterly guidance as conservative but able to see decent upside, although BofA also acknowledged that Samsung was showing relatively better momentum versus Micron for the time being.
Credit Suisse is the biggest bull of them all in Micron. The firm has an Outperform rating and has a $90 price target. The firm did note a disappointment in Micron’s gross margin and guidance reflecting company-specific cost items and a product mix, but the firm believes the negative memory cycle is bottoming. There is also likely to be more capital spending ahead after the capital spending reductions over the last year.
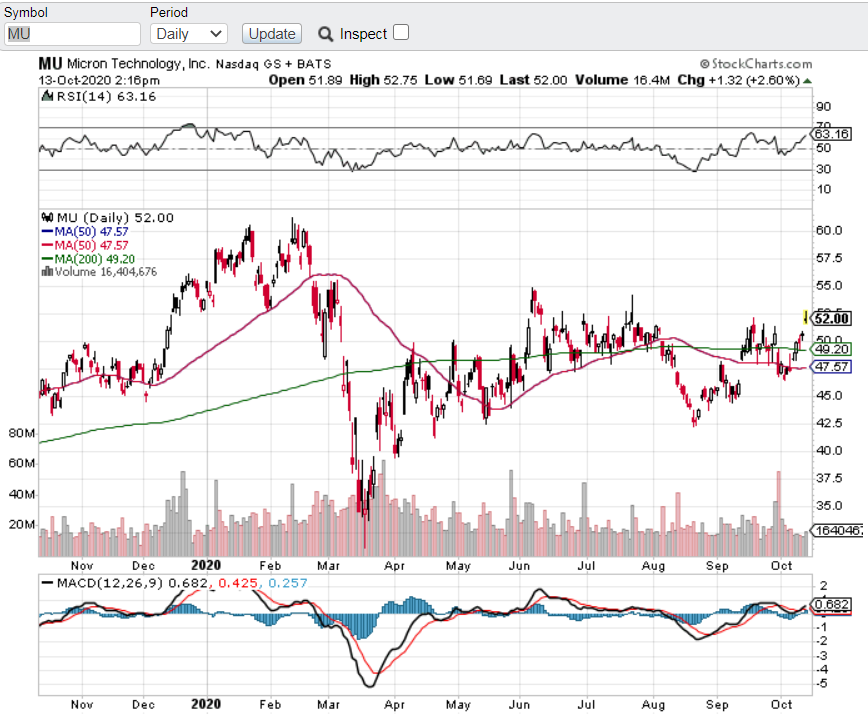
Where Micron gets interesting is on the stock chart with a look-back to its earnings date. Micron’s closing price of $50.71 turned into a post-earnings price of $46.96 on September 30. Its stock has not traded up in a straight line, but after 9 trading sessions the stock is now back up at $51.95.
After dropping under the 200-day and 50-day moving averages after earnings, Micron is now back above both levels handily. Its 200-day moving average is $49.20 and its 50-day is down at $47.57. The chart from stockcharts.com below will also show that the current share price is the highest price since mid-July, and the real resistance on that chart appears to be at the overhanging level nearing $55. That $55 level was also where Micron was before the coronavirus turned into the COVID-19 pandemic.
Investors may be a bit concerned that the overall stock market strength has become a tad too strong around more stimulus hopes. A formal stimulus package approval also seems to be based more on hope than on the public action and dialogue from Washington, D.C.
With its shares close to $52.00 on last look, Micron’s consensus analyst price target was $63.12 and its 52-week range is $31.13 to $61.19.
[wallst_email_signup]
Contact [email protected] for any questions or corrections.