Of the 28.7 million black Americans living in the nation’s largest metropolitan areas, nearly one-quarter reside in segregated neighborhoods — where at least 80% of residents are black. People living in urban areas are even more likely to be isolated, with 44.4% living in homogeneous neighborhoods, where the vast majority of residents have the same skin color or ethnicity.
Nearly 14% of U.S. residents are African American. Therefore, if 14% of each community were black, the United States would be perfectly integrated. For the 100 largest metropolitan areas, this is never the case. 24/7 Wall St. reviewed large U.S. metro areas containing at least one census tract — small statistical areas — where at least 80% of the population is African American. The most segregated metro areas have the largest percentage of black area residents living in these racially homogenous communities.
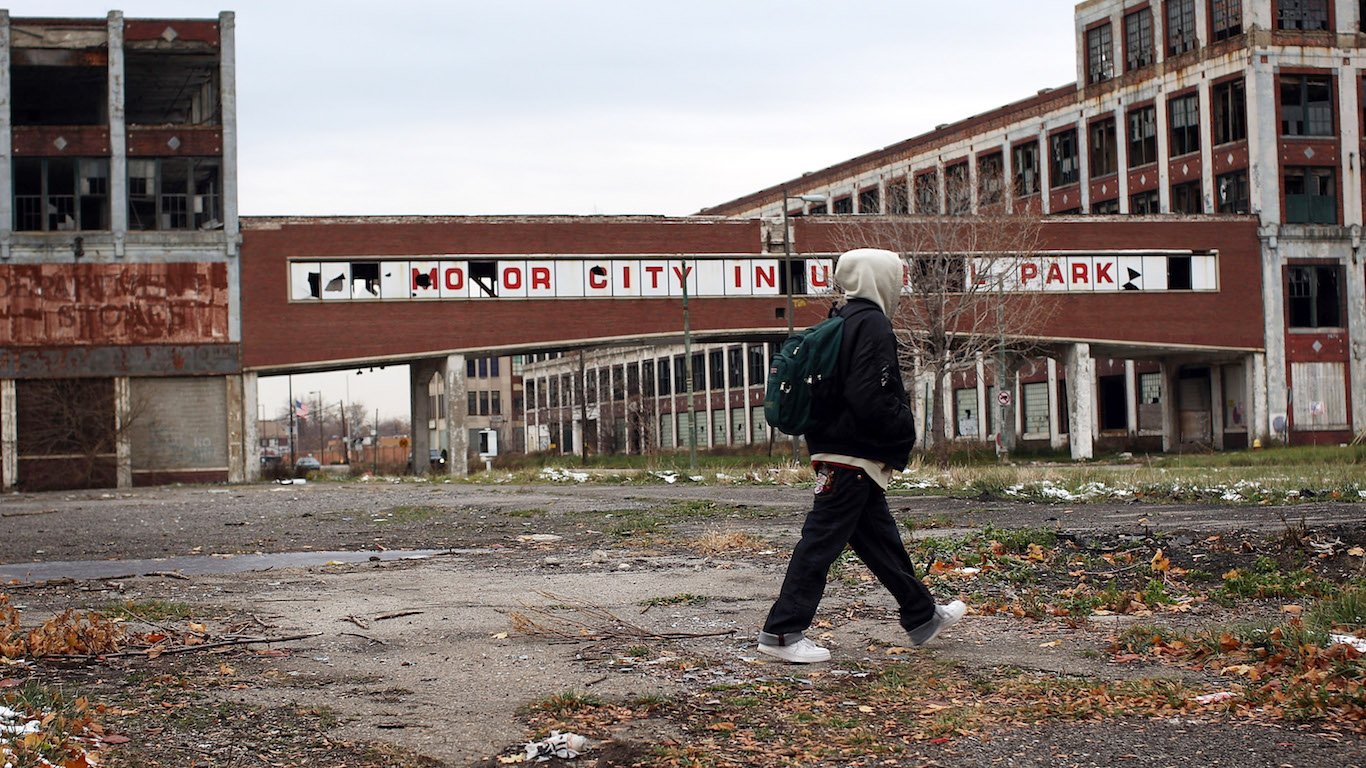
Detroit is the most segregated metro area in the United States. Among the city’s 962,000 black residents, 57.7% live in predominately black neighborhoods.
Click here to see America’s most segregated cities.
Click here to read our methodology.
Richard Rothstein is a senior researcher and segregation expert at the Economic Policy Institute, a left-leaning think tank. In an interview with 24/7 Wall St., Rothstein said there is a distinction between segregation and ethnic and racial homogeneity, which unlike most isolated African American communities, could be related to immigration patterns, grouping due to shared language, and so forth. “Only African Americans were segregated by a century of explicit federal state and local policy,” Rothstein said.
The United States has a long and troubling history of race-based housing segregation. Until the fair housing act was passed in 1968, municipalities and private realtors were able to legally force African Americans to live in separate neighborhoods. The long-term consequences of these policies, coupled with the continuing trend of white flight, has entrenched segregation and the resulting inequalities in U.S. metropolitan areas.
Not all racial segregation can be blamed on discriminatory housing policies. The path towards integration is not set, and while activists and lawmakers struck a blow against segregation during the Civil Rights movement of the 1950’s and 60’s, it persists in different, perhaps more subtle forms to this day. One such example is the process of gentrification taking place in many urban U.S. areas. Rothstein noted that gentrification is often mistaken for integration. In neighborhoods where the population was “once all black, and now they’re mixed, but in 10 years they’re going to be all white, that’s a misleading indicator of integration,” he said.
One of the most serious and observable long-term consequences of residential segregation can be seen in the public school system. School funding is largely determined by property tax revenues. In metropolitan areas characterized by wealthy white neighborhoods and low-income black neighborhoods, therefore, schools in white neighborhoods are much better funded. Consequently, white children are much more likely to succeed than black children in a nearby neighborhood, even as they are attending classes often just a mile or two away.
While a range of factors affect disparities in educational attainment on a racial level, the effects of segregated housing on learning outcomes are evident. Among white adults nationwide, 89.1% have a high school diploma and 34.9% have a bachelor’s degree. For black residents 25 and older, the corresponding educational attainment rates are 84.9% and 21.0%. In many of the most segregated metropolitan areas, the differences are much larger. For example, in Milwaukee — one of the more segregated U.S. metros — educational attainment rates of white residents are comparable to national figures, but just 80% of black adults have graduated from high school and just 12.4% have a four-year college degree.
Speaking to the Cleveland Plain Dealer, Marjory Givens, associate scientist with the University of Wisconsin Population Health Institute said “Highly segregated neighborhoods tend to have environmental hazards, often elevated crime levels, and segregated residents in general have fewer opportunities for good education or a job that pays a living wage, or access to health care and healthy food.”
These are America’s most segregated cities.
16. Dayton, OH
> Black ppl. in black neighborhoods: 28.7%
> Black population: 15.5%
> Black poverty rate: 33.0%
> White poverty rate: 13.3%
All metro areas are segregated to some degree. Dayton Ohio is one of the most segregated communities in the country. Of the city’s 124,000 black residents, 28.7% live in 
live in predominantly black neighborhoods.
Segregation in communities can determine the quality of schools and medical facilities, access to public transportation, and residents’ positions in the labor market. The segregation present in Dayton may explain the unequal outcomes that occur along racial lines in the metro area. Roughly 18% of the area’s black people are unemployed, compared to 6.8% of Dayton’s white residents.
Click image to enlarge
15. Washington-Arlington-Alexandria, DC-VA-MD-WV
> Black ppl. in black neighborhoods: 29.3%
> Black population: 24.9%
> Black poverty rate: 13.4%
> White poverty rate: 5.6%
Our nation’s capital is one of the most segregated metropolitan areas in the United States. Slightly less than 30% of the city’s black residents live in predominately black neighborhoods. The metro area is effectively split in half, with 
While segregation has led to a variety of poor outcomes in the D.C. area, the social disparities between white and black residents is not always as extreme as in many cities. Nearly 90% of the area’s African American adults have graduated high school compared to 92.9% of the area’s white residents. Similarly, 31.3% of black residents have a college degree compared to 35.3% of white residents. Nationwide, the college attainment rate is 21.0% for black adults and 34.9% for white adults.
Click image to enlarge
[nativounit]
14. Baton Rouge, LA
> Black ppl. in black neighborhoods: 30.6%
> Black population: 35.4%
> Black poverty rate: 27.8%
> White poverty rate: 11.3%
The Baton Rouge metropolitan area has one of the largest black populations. About 35% of the Louisiana capital’s 814,000 residents are African American, among the largest proportions nationwide. Of these 288,000 black residents, 30.6% live in neighborhoods that are predominately black. As is the case nationwide, black neighborhoods in Baton Rouge are far more likely to be low-income neighborhoods, usually in stark contrast with wealthier white neighborhoods. The poverty rate among black area residents, at 27.8%, dwarfs that of whites, at 11.3%.
A recent development that points to the deep racial divide in Baton Rouge is a movement by a predominantly upper-middle class white neighborhood that sought to break off from the east Baton Rouge school district to start its own municipality. The petition nearly acquired enough signatures. The move would have left the remaining poor black schools with even fewer resources.
Click image to enlarge
13. Atlanta-Sandy Springs-Roswell, GA
> Black ppl. in black neighborhoods: 31.2%
> Black population: 32.3%
> Black poverty rate: 21.9%
> White poverty rate: 10.9%
More affluent — often white — residents often move from the inner cities to the suburbs, leaving poorer — often black and other minority — residents in urban areas. In Atlanta, many white residents have continued this pattern of outward migration, filling more rural areas further from the city center. Consequently, black families have moved into the vacated neighborhoods, and as of 2010 87% of Atlanta’s black families lived in Suburbs. While suburban living is not often associated with inequality, in cities such as Atlanta it is. Predominantly black Atlanta suburbs still face the problems that arise from segregation, including relatively low home values and relatively poor funding and achievement in local schools.
Still, Atlanta has been referred to as the “mecca of the black middle class” — and with good reason. Nearly one-third of the metropolitan area’s 5.5 million residents are black, and the typical black household’s income of $42,975 is in the top 15 incomes for black households among metro areas reviewed. About half of all black families and individuals live in a home they own. While these measures are high compared to black households nationwide, they are still well below the equivalent values for white Atlanta residents.
Click image to enlarge
12. Philadelphia-Camden-Wilmington, PA-NJ-DE-MD
> Black ppl. in black neighborhoods: 34.5%
> Black population: 20.2%
> Black poverty rate: 25.2%
> White poverty rate: 8.2%
About 44% of the Philadelphia metropolitan area’s population lives in a neighborhood where at least 80% of residents share the person’s race, compared to 31.4% of the nation’s residents. The vast majority of the predominantly black neighborhoods are located near the city’s urban center, while homogenous white neighborhoods are closer to the outskirts of the metropolitan area.
Housing segregation in Philadelphia is just one type of racial inequality present in the area. For example, just 8.2% of the area’s white residents live in poverty compared to more than 25% of the area’s black residents. The median household income of white Philadelphians is $72,526 a year, nearly double the median household income of black households of $37,018 a year.
Click image to enlarge
[recirclink id=350603]
11. Milwaukee-Waukesha-West Allis, WI
> Black ppl. in black neighborhoods: 35.0%
> Black population: 16.3%
> Black poverty rate: 38.8%
> White poverty rate: 9.2%
There are numerous ways to calculate segregation levels. One standard measure, which indicates the proportion of black residents who would have to relocate to match the
distribution of whites, pegs the Milwaukee area as the most segregated city in the nation. More than three-quarters of white area residents live in predominantly white 
All of the metro’s predominantly black neighborhoods are in Milwaukee County, while whites are far more likely to live in Waukesha and Ozaukee. Residential segregation almost always accompanies stark economic disparities. The area’s highest poverty rates — some exceeding 60% — are disproportionately in black neighborhoods, while all of the lowest poverty rates are in predominantly white census tracts.
Click image to enlarge
10. New Orleans-Metairie, LA
> Black ppl. in black neighborhoods: 40.1%
> Black population: 34.3%
> Black poverty rate: 31.4%
> White poverty rate: 11.0%
About 420,000 of the New Orleans metropolitan area’s 1.2 million residents, or nearly 35%, are African Americans — the fifth-largest proportion among all metropolitan areas. Still, housing segregation in the Big Easy limits racial interaction. On average, 71% of the people a white person in New Orleans encounters on a daily basis are white, while 64% of the people a black person encounters are also black. More than 40% of New Orleans’ black residents live in neighborhoods that are at least 80% black.
Evidence suggests that one of the lingering effects of Hurricane Katrina has been accelerated segregation in the city. Many homes were destroyed in the hurricane and hundreds
of thousands of residents were displaced. To help residents return to New Orleans, the city enacted policies and practices that according to critics assisted mostly white wealthy residents — and made life more difficult for mostly black poorer families. The city justified one such law, which limited renting to only close relatives, as fulfilling a “need to maintain the integrity and stability of established neighborhoods.”
Click image to enlarge
9. Birmingham-Hoover, AL
> Black ppl. in black neighborhoods: 40.3%
> Black population: 28.4%
> Black poverty rate: 27.6%
> White poverty rate: 11.8%
The Birmingham campaign to end segregation in the city in the early 1960s was led by Fred L. Shuttlesworth and Martin Luther King, Jr. At the time, the events in the city were pivotal in leading to the Civil Rights Act of 1964. It is therefore ironic that this city, which is so closely associated with integration, remains one of the most segregated in the 
do.
Social and economic inequality along racial lines tends to be more common in more segregated cities. In Birmingham, 11.8% of white residents live in poverty, while 27.6% of black Birmingham residents do. Just 3.7% of Birmingham’s white workers are unemployed, roughly one-fourth the metropolitan area’s black unemployment rate of 14.5%.
Click image to enlarge
[nativounit]
8. Baltimore-Columbia-Towson, MD
> Black ppl. in black neighborhoods: 41.9%
> Black population: 28.4%
> Black poverty rate: 20.0%
> White poverty rate: 6.7%
After investigating the Baltimore City Police Department, the U.S. Department of Justice found that police in the area routinely violate the constitutional rights of residents and federal law. Baltimore police use enforcement strategies that encourage unconstitutional stops, searches and arrests that disproportionately affect African Americans, as well as excessive force, the DOJ found. In an essay following the DOJ report, Johns Hopkins University professor Lester Spence wrote, “In effect, the city is producing and reproducing a population that has no functional purpose other than to be policed.”
As the DOJ noted in its report, the problem is largely due to racial segregation. A majority of white residents live in predominantly white and relatively prosperous neighborhoods, while the opposite tends to be true for black residents. Of neighborhoods with 80% white or black residents, 43 have poverty rates over 30%, and all of them are predominantly African American.
Click image to enlarge
7. Buffalo-Cheektowaga-Niagara Falls, NY
> Black ppl. in black neighborhoods: 42.2%
> Black population: 11.8%
> Black poverty rate: 36.4%
> White poverty rate: 9.7%
There are several ways to measure segregation, and Buffalo has among the most severe divisions along racial lines no matter the measure. While nationwide 23.9% of black
Americans live in primarily black neighborhoods, in Buffalo 42.2% do. Based on the exposure index, another standard measure of segregation, only 5% of all white interactions in a given day are with their fellow black residents.
Residential segregation almost always accompanies stark economic disparities. Arguably, no city is more unequal than Buffalo. While 36.4% of the metropolitan area’s black residents live in poverty, only 9.7% of the area’s white residents do. The city’s white adults are more than twice as likely to have a college degree as black residents. The typical African American household in Buffalo earns just $25,789 annually, or just 46.2% of the area’s white median household income. Nationwide, the black household median income is 60.7% of the white household median income.
Click image to enlarge
6. St. Louis, MO-IL
> Black ppl. in black neighborhoods: 42.2%
> Black population: 18.2%
> Black poverty rate: 29.7%
> White poverty rate: 9.0%
The St. Louis region earned a national spotlight in the summer of 2015 when Michael Brown, a black teenager, was shot and killed by police in Ferguson, sparking protests across the nation. Ferguson is a predominantly black neighborhood — and Brown’s death is inseparable from racial segregation in the area. One of the most damaging effects of residential segregation is funding disparities between neighboring school districts. Because property taxes play such a large role in school funding, well-off communities often
have an interest in keeping poor areas separate.
Instead of one, St. Louis has 24, quite disparate school districts. This August, water fountains in 30 predominantly black St. Louis public schools were shut down due to lead 
As is common in large metro areas — not just the most segregated — the poverty rate among black St. Louis residents, at nearly 30%, is approximately three times the poverty rate among the area’s white residents.
Click image to enlarge
[recirclink id=350564]
5. Cleveland-Elyria, OH
> Black ppl. in black neighborhoods: 44.9%
> Black population: 19.6%
> Black poverty rate: 33.8%
> White poverty rate: 10.1%
There are a number of ways to measure segregation. Nearly 45% of Cleveland’s black residents live in neighborhoods that are at least 80% black. There are numerous methods used to measure segregation. One measure, of exposure to other races, pages the Cleveland area at nearly the most segregated. Across the nation, about 37% of the people the average white American encounters are also white. In Cleveland, the share is 84.7%.
Like most major metropolitan areas, racially segregated neighborhoods in the Cleveland area — as well as the socioeconomic inequalities in these neighborhoods — are at least in part a consequence of racially conscious discrimination. During the early 1900’s, black families could only access housing on the east side of the city, which is where all predominately black neighborhoods can be found today.
Click image to enlarge
4. Memphis, TN-MS-AR
> Black ppl. in black neighborhoods: 47.2%
> Black population: 45.8%
> Black poverty rate: 28.9%
> White poverty rate: 9.7%
In the 1930s, the Memphis Housing Authority began a series of urban redevelopment programs, frequently referred to as “slum clearance.” The city tore down residences in black middle class neighborhoods. The city justified the plan with claims these building were decrepit and unsafe, but in actuality these family homes were part of a hard-won 
exacerbated segregation by dramatically increasing the amount of low-income housing.
Nearly 46% of the Memphis population is black, one of the largest black populations of any urban region. Nearly half of these residents live in a neighborhood that is at least 80% black. Memphis’ white residents are about twice as likely to graduate from college, earn about twice as much money, and are only about one-third as likely to be unemployed.
Click image to enlarge
3. Jackson, MS
> Black ppl. in black neighborhoods: 47.7%
> Black population: 48.4%
> Black poverty rate: 29.8%
> White poverty rate: 9.9%
With 47.7% of Jackson residents identifying as African American, the area has the largest black population of any
large U.S. metro area. Jackson is one of the few U.S. regions where black people outnumber whites. Jackson is also
nearly the most segregated city in the country. Of the 278,370 African American area residents, close to half live in predominantly black neighborhoods.
With a homeownership rate of 54.0%, African American area residents are more likely to own their homes than black residents of any other large metro area reviewed. However, the difference from white residents is no less stark. The white homeownership rate in the area, at 79.4%, is also the highest white homeownership rate.
Click image to enlarge
[nativounit]
2. Chicago-Naperville-Elgin, IL-IN-WI
> Black ppl. in black neighborhoods: 50.3%
> Black population: 16.8%
> Black poverty rate: 29.4%
> White poverty rate: 9.3%
Chicago is one of the nation’s largest and most diverse cities. Perhaps as a result, the number of racially homogenous neighborhoods is relatively low. Of the 2,200 tracts in the metro area, fewer than 1,000 have 80% or more people of a single racial group. Still, black area residents are more likely than not to live in predominantly black neighborhoods, which helps make the Chicago metro area one of the most racially segregated areas in the country. While segregation of white and black people is uniquely pronounced in the
United States, other racial groups are also isolated from one another. Like several other large U.S. cities, Latino immigration to Chicago accelerated in the 1990s, and today,
Spanish-speaking and white residents live relatively separately. More than one in every five Hispanic area residents live in predominantly Hispanic neighborhoods, the sixth
highest such percentage of large metros.
Social and economic gaps between black and white Americans exist across the nation virtually without exception. In the Chicago area, the gaps are especially wide. The black poverty rate is more than three times that of white area residents, one of the largest such disparities nationwide.
Click image to enlarge
[wallst_email_signup]
1. Detroit-Warren-Dearborn, MI
> Black ppl. in black neighborhoods: 57.7%
> Black population: 22.4%
> Black poverty rate: 33.3%
> White poverty rate: 11.4%
By using race to determine home loan eligibility, the FHA deliberately segregated the Detroit area over the course of the mid-20th century. The racist policies are memorialized by a wall originally built along 8 Mile Road to separate black and white neighborhoods.
While the wall no longer separates black and white residents, still today few areas are more divided along racial lines 
Click image to enlarge
Methodology
To identify America’s most segregated cities, 24/7 Wall St. calculated the percentage of metropolitan area black residents who live in predominantly black census tracts — statistical subdivisions typically with populations of 1,200 to 8,000 people. The greater the share of black metro residents living in the area’s racially homogenous neighborhoods, the greater the degree of segregation. We only considered census tracts with at least 500 residents in the 100 largest metropolitan areas. Population data are based on five-year estimates through 2014 from the U.S. Census Bureau’s American Community Survey. For the purpose of this story, we only considered segregation of white and black populations.
Because a certain level of racial diversity is necessary for segregation to be measured with confidence, only 71 of the 100 largest metro areas could be compared. The remaining 29 were not considered because they do not contain any predominantly black census tracts.
We also considered other, widely used methods of measuring segregation: the dissimilarity and exposure indices. The dissimilarity index estimates what percentage of the population would have to relocate to achieve total integration. The exposure index estimates how likely members of two racial groups are to come in contact with one another other.
While racial segregation was the primary focus of our analysis, segregation by income is also an important component. Our analysis included the share of a metro area’s population living in extreme poverty — census tracts with poverty rates higher than 40%. Examining these figures by race allowed us to identify the share of a metro area’s white population, for example, that lives in areas with extreme poverty. This portion of our analysis excluded tracts with fewer than 500 residents, as well as tracts where more than 50% of the population is enrolled in either undergraduate or graduate school.
We also reviewed median household income, poverty rates, educational attainment rates, and homeownership rates among black and white populations in each metro area from the ACS. All data are five-year estimates. We also included 2014 unemployment rates by race from the Bureau of Labor Statistics (BLS).
Contact [email protected] for any questions or corrections.