Mesquite, TX is One of the Most Dangerous Cities to Drive In
During the Covid-19 pandemic, American motorists have decreased their amount of driving precipitously as they mostly stayed home, working remotely and avoiding public gatherings. Counterintuitively, however, that has not resulted in safer roads. Here’s more on the impact of COVID-19…

During the Covid-19 pandemic, American motorists have decreased their amount of driving precipitously as they mostly stayed home, working remotely and avoiding public gatherings. Counterintuitively, however, that has not resulted in safer roads. Here’s more on the impact of COVID-19 on traffic in America’s largest cities.
“Unfortunately, the pandemic and the resulting economic dislocations and stay-at-home orders have been accompanied by a sharp increase in risky driving and fatal crashes,” wrote the National Highway Traffic Safety Administration in January, in “An Open Letter to the Driving Public.”
Before 2020, driving was already risky enough. Road accidents killed more than 36,000 people in the U.S. in 2019 and injured more than 2.7 million, according to NHTSA — and driving in some U.S. cities is more perilous than others.
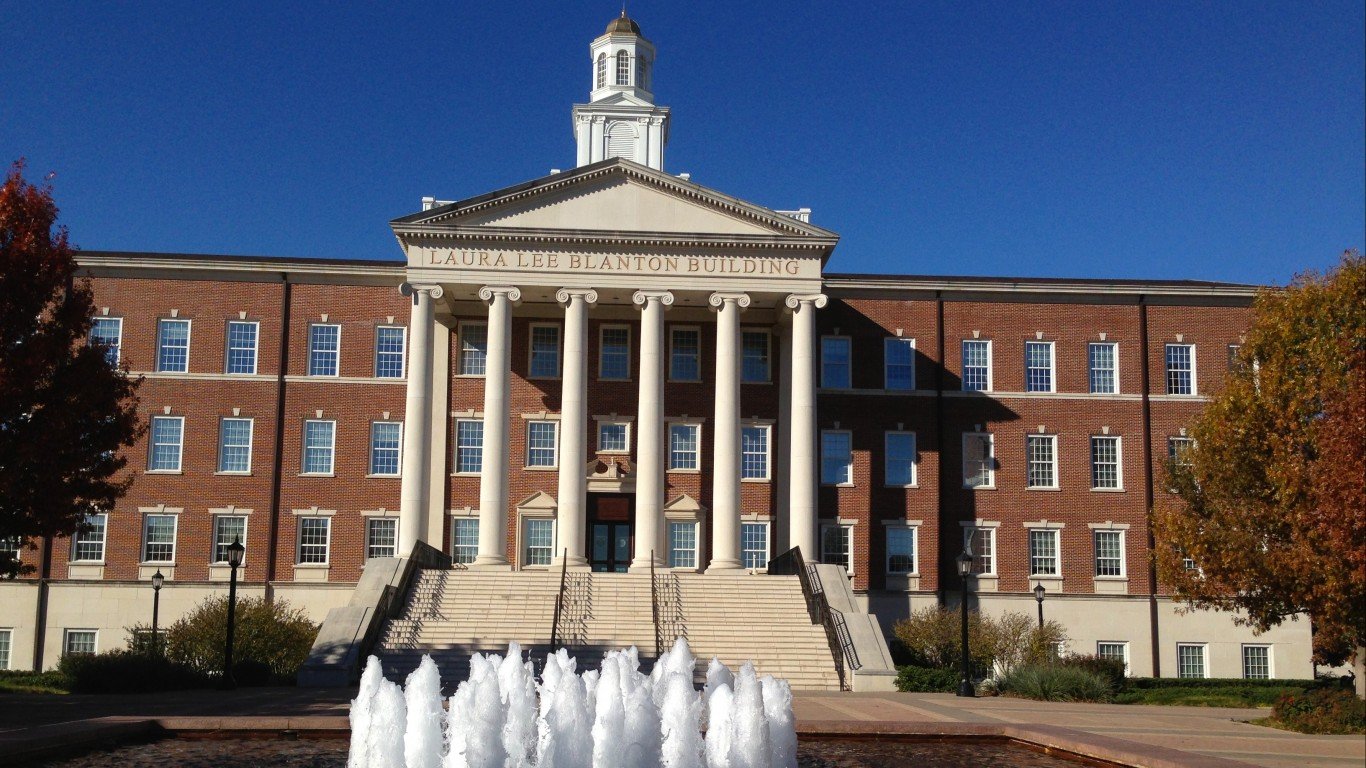
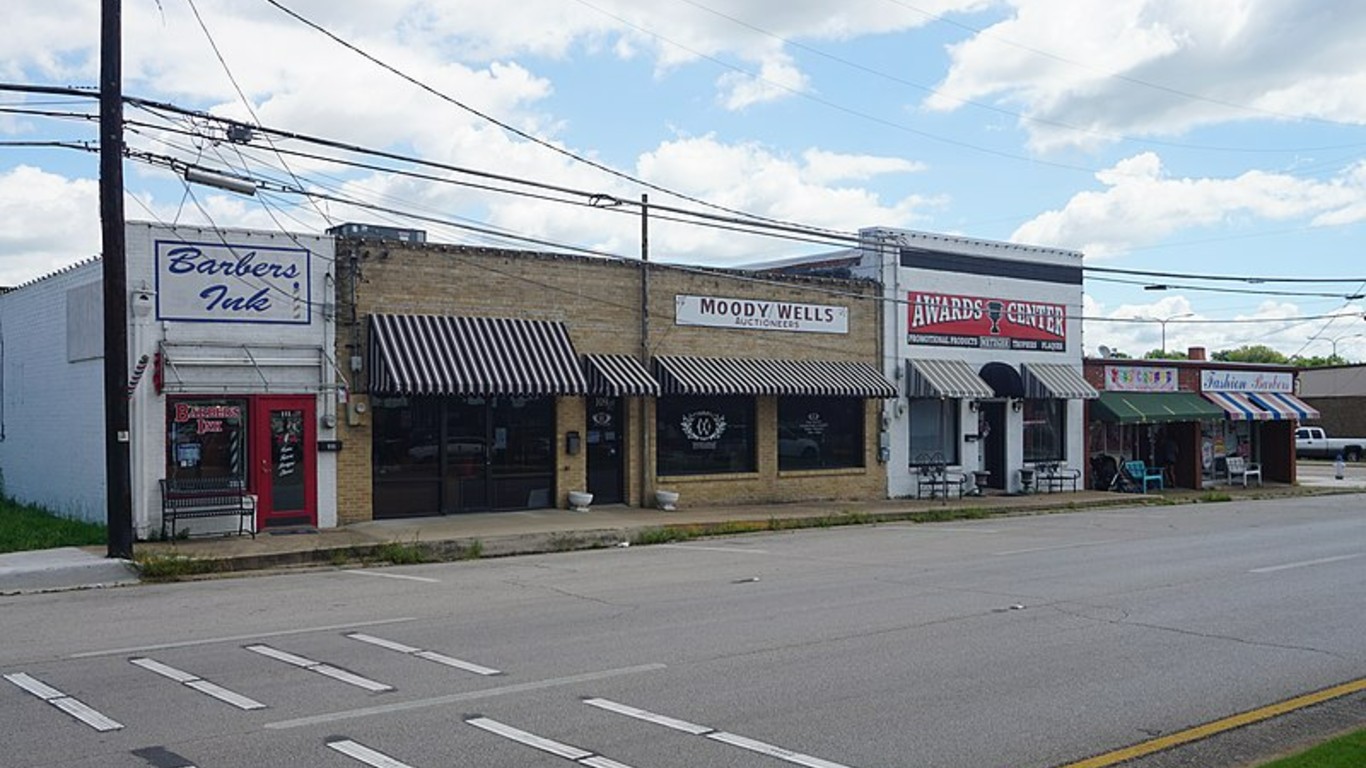
Mesquite, Texas, home to about 140,800residents, ranks as the 17th most dangerous city to drive in. Motorists are 38.4% more likely than average to be involved in a roadway collision, according to data compiled by RV rental company, Outdoorsy. Many of the worst accidents in the city are preventable as well, as 31.4% of deadly collisions involve an intoxicated driver.
There are a total of 09 motor vehicle fatalities annually for every 100,000 people in Mesquite — among the middle 50% of all cities considered. Additionally, a motorist living in Mesquite has a collision an average of once every 7.6 years, in the top 25% of all cities with sufficient data.
Data used in this story was compiled and indexed by Outdoorsy. Ranking is based on a combination of the relative likelihood of a collision, total motor vehicle fatalities, and share of fatal collisions involving a drunk driver. Only 194 major American cities with data available from all three data sources were included. These are the most dangerous cities for driving.
| Rank | City | Avg. number of years between collisions | Likelihood of collision vs. US avg. (+%) | Motor vehicle fatalities (per 100k people) | Share of fatal collisions involving a drunk driver (%) |
|---|---|---|---|---|---|
| 1 | Dallas, TX | 7.2 | 46.5 | 14.3 | 42.4 |
| 2 | Baton Rouge, LA | 6.8 | 55.1 | 21.9 | 27.7 |
| 3 | San Bernardino, CA | 7.5 | 41.8 | 17.9 | 30.4 |
| 4 | New Orleans, LA | 7.1 | 49.1 | 11.1 | 36.4 |
| 5 | Atlanta, GA | 7.1 | 49.5 | 13.5 | 27.2 |
| 6 | Fort Worth, TX | 8.2 | 29.7 | 11.5 | 43.3 |
| 7 | Detroit, MI | 8.6 | 22.9 | 16.1 | 37.1 |
| 8 | Houston, TX | 7.7 | 38.1 | 10.1 | 40.4 |
| 9 | Cincinnati, OH | 7.2 | 47.6 | 8.7 | 37.5 |
| 10 | Cleveland, OH | 8.9 | 19.0 | 12.3 | 42.1 |
| 11 | San Antonio, TX | 8.2 | 29.0 | 9.7 | 42.7 |
| 12 | Austin, TX | 7.6 | 39.2 | 8.4 | 39.6 |
| 13 | Charlotte, NC | 7.8 | 36.0 | 10.4 | 31.9 |
| 14 | St. Louis, MO | 8.6 | 22.4 | 18.3 | 27.6 |
| 15 | Sacramento, CA | 7.6 | 40.0 | 11.2 | 26.3 |
| 16 | Arlington, TX | 7.6 | 40.0 | 6.9 | 46.2 |
| 17 | Mesquite, TX | 7.6 | 38.4 | 8.7 | 31.4 |
| 18 | Modesto, CA | 7.9 | 34.3 | 9.2 | 30.9 |
| 19 | Charleston, SC | 9.4 | 12.7 | 21.7 | 30.7 |
| 20 | Irving, TX | 7 | 50.8 | 6.4 | 40.0 |
| 21 | Jackson, MS | 9.7 | 8.8 | 18.9 | 33.7 |
| 22 | Memphis, TN | 9.1 | 16.9 | 17.6 | 28.4 |
| 23 | Savannah, GA | 7.7 | 37.8 | 12.1 | 22.4 |
| 24 | Lancaster, CA | 9.1 | 16.3 | 13.8 | 30.5 |
| 25 | Riverside, CA | 8.3 | 28.2 | 9.2 | 32.9 |
Sam Stebbins is a writer at 247WallSt.com where his primary focus is on government policy, politics, companies, and broad social and economic trends. Sam has been writing in the money and news verticals for over 8 years and holds a bachelor's degree from Hobart College, which he earned in 2010. Sam resides in upstate New York and enjoys hiking, biking, canoeing, and skiing in the Adirondack Mountains and across the Northeast.