The U.S. faces a severe – and worsening – housing crunch. The country is short around 3.8 million housing units to meet demand, according to estimates from Up For Growth, a research organization focused on housing affordability and production. That’s more than double the 1.7 million unit shortfall reported in 2012.
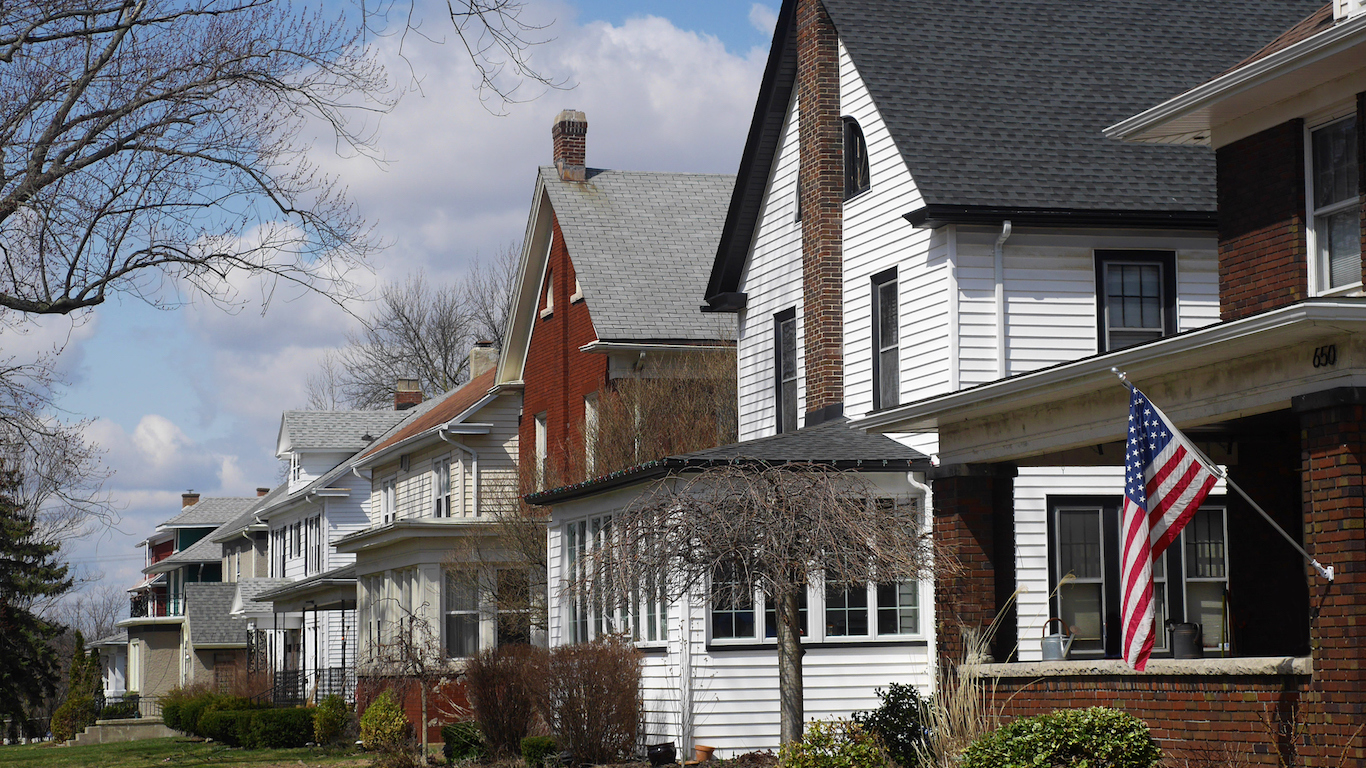
One potential solution is high-density housing. Buildings of five or more units can house more people on scarce urban and suburban land. In recent years, more cities across the country appear to be taking that approach, some growing their high-density building supply considerably more than others.
In the Omaha-Council Bluffs metro area, which spans parts of Nebraska and Iowa, new permits for apartment building construction are rising rapidly. Building permits for a total of 6,382 new housing units were issued in the metro area in 2021, 40.6% of which are for units in buildings with five units or more.
For comparison, half a decade earlier, only 30.2% of all permits for new housing units were for buildings with at least five units. The 10.4 percentage point change for new apartment construction from 2016 to 2021 ranks as the 19th largest increase among all U.S. metro areas.
New apartment construction is often in response to both anticipated and real population growth. According to population estimates from the U.S. Census Bureau’s American Community Survey, the Omaha metro area population climbed by 5.3% over the same period, from 923,431 in 2016 to 972,195 in 2021.
All new apartment construction permit estimates in this story are based on data from the U.S. Census Bureau’s monthly Build Permits Survey, using annual data from 2021 and 2016.
| Rank | Metro area | Ppt. increase of housing units in buildings with 5+ units, 2016-2021 | Pct. of new housing units in buildings with 5+ units in 2021 | Pct. of new housing units in buildings with 5+ units in 2016 |
|---|---|---|---|---|
| 1 | Philadelphia-Camden-Wilmington, PA-NJ-DE-MD | 33.6 | 70.0 | 36.4 |
| 2 | Santa Rosa-Petaluma, CA | 23.9 | 51.5 | 27.6 |
| 3 | Worcester, MA-CT | 21.1 | 37.0 | 15.9 |
| 4 | Eugene-Springfield, OR | 18.7 | 54.1 | 35.4 |
| 5 | Bellingham, WA | 18.1 | 49.2 | 31.1 |
| 6 | Richmond, VA | 17.2 | 33.0 | 15.8 |
| 7 | Missoula, MT | 16.2 | 73.2 | 57.0 |
| 8 | Bend, OR | 15.6 | 31.4 | 15.7 |
| 9 | Provo-Orem, UT | 15.0 | 29.2 | 14.2 |
| 10 | Albuquerque, NM | 14.8 | 35.1 | 20.3 |
| 11 | Killeen-Temple, TX | 14.7 | 27.1 | 12.5 |
| 12 | Olympia-Lacey-Tumwater, WA | 14.4 | 59.4 | 45.0 |
| 13 | Naples-Marco Island, FL | 14.2 | 32.6 | 18.4 |
| 14 | Ogden-Clearfield, UT | 12.5 | 41.8 | 29.3 |
| 15 | Austin-Round Rock-Georgetown, TX | 12.4 | 50.4 | 37.9 |
| 16 | Colorado Springs, CO | 12.1 | 42.0 | 30.0 |
| 17 | Boston-Cambridge-Newton, MA-NH | 11.6 | 65.7 | 54.1 |
| 18 | Boise City, ID | 10.8 | 26.2 | 15.5 |
| 19 | Omaha-Council Bluffs, NE-IA | 10.4 | 40.6 | 30.2 |
| 20 | Minneapolis-St. Paul-Bloomington, MN-WI | 10.2 | 53.3 | 43.1 |
| 21 | Sacramento-Roseville-Folsom, CA | 9.9 | 23.0 | 13.0 |
| 22 | Manchester-Nashua, NH | 9.8 | 42.4 | 32.6 |
| 23 | Rapid City, SD | 9.7 | 53.6 | 44.0 |
| 24 | Madison, WI | 9.6 | 72.8 | 63.2 |
| 25 | Detroit-Warren-Dearborn, MI | 9.5 | 30.9 | 21.5 |