This Jackson Metro Area ZIP Code is One of the Least Expensive in America
The COVID-19 pandemic had devastating economic consequences in the United States, grinding entire industries to a halt. One sector that did not suffer, however, was real estate. Driven by the pandemic, existing home sales hit their highest level in nearly…

The COVID-19 pandemic had devastating economic consequences in the United States, grinding entire industries to a halt. One sector that did not suffer, however, was real estate. Driven by the pandemic, existing home sales hit their highest level in nearly a decade and a half in 2020.
The median home sale price in the United States was $265,000 in 2020 — $30,000 more than it was the previous year. A quarter of a million dollars, however, is not affordable for many Americans. Still, for those on a tight budget, there are many parts of the country where most homes are selling for far less.
Using median home sale prices provided by ATTOM Data Solutions, a real estate and property data company, 24/7 Wall St. identified the least expensive ZIP codes in America.
In the 38301 postal code, which covers much of Jackson, Tennessee, and sits mostly south of Interstate 40, is one of only 22 ZIP codes in the U.S. where most homes sold in 2020 went for less than $70,000. The median price of the more than 500 housing units sold in the area last year was just $69,500.
The area’s home prices are among the lowest likely due in part to reduced demand, precipitated by population decline. Over the last five years, the number of people living in the area contracted by 7.8%.
ZIP codes were ranked based on median sales price of condos and single-family homes in 2020. Only ZIP codes with at least 1,000 single-family homes and condos and where at least 500 of housing units were sold in 2020 were considered. The estimated market value is determined by ATTOM’s automated valuation model.
Supplemental data on median household income, the share of households that are at least 50 years old, and unemployment are five-year estimates at the ZIP code level for 2015-2019 from the U.S. Census Bureau’s American Community Survey.
| Rank | Zip code | Location | Median home sale price; 2020 ($) | Median household income ($) | Houses built before 1970 (%) |
|---|---|---|---|---|---|
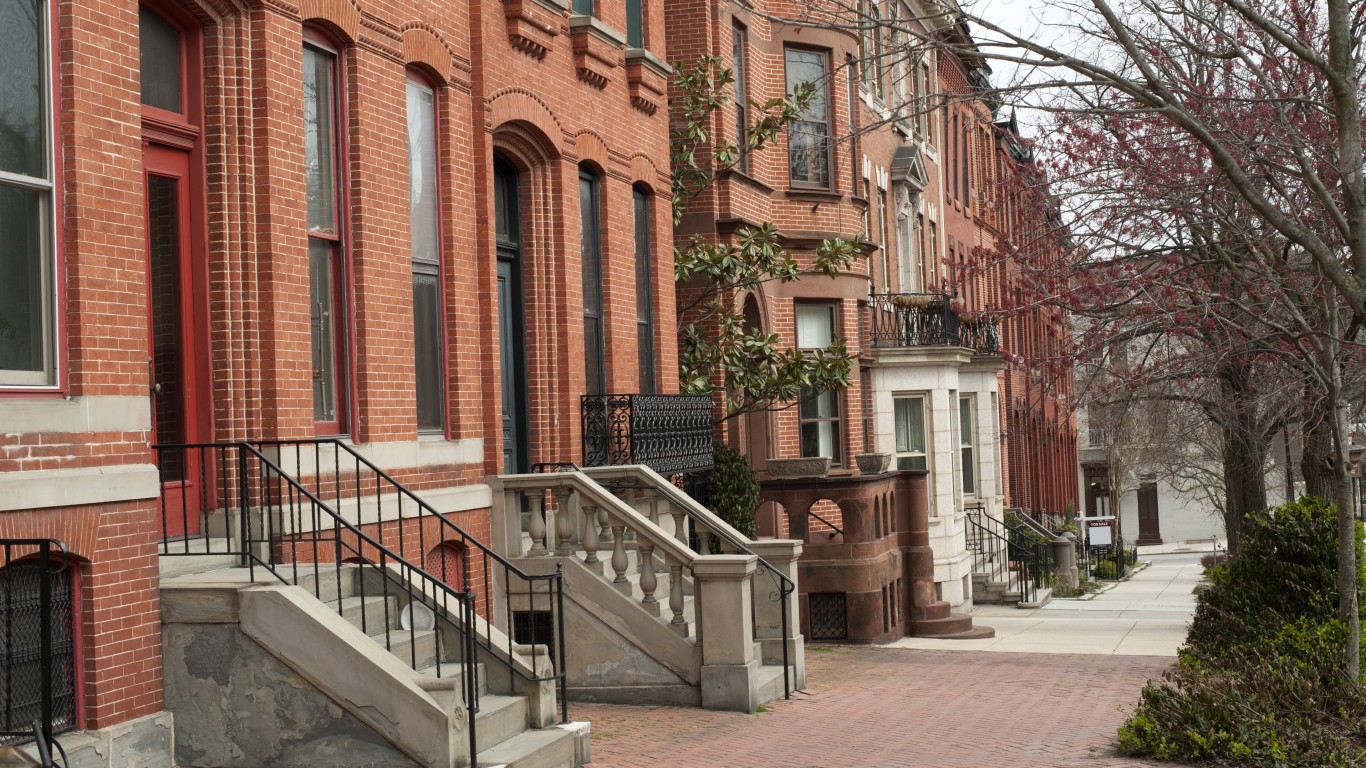
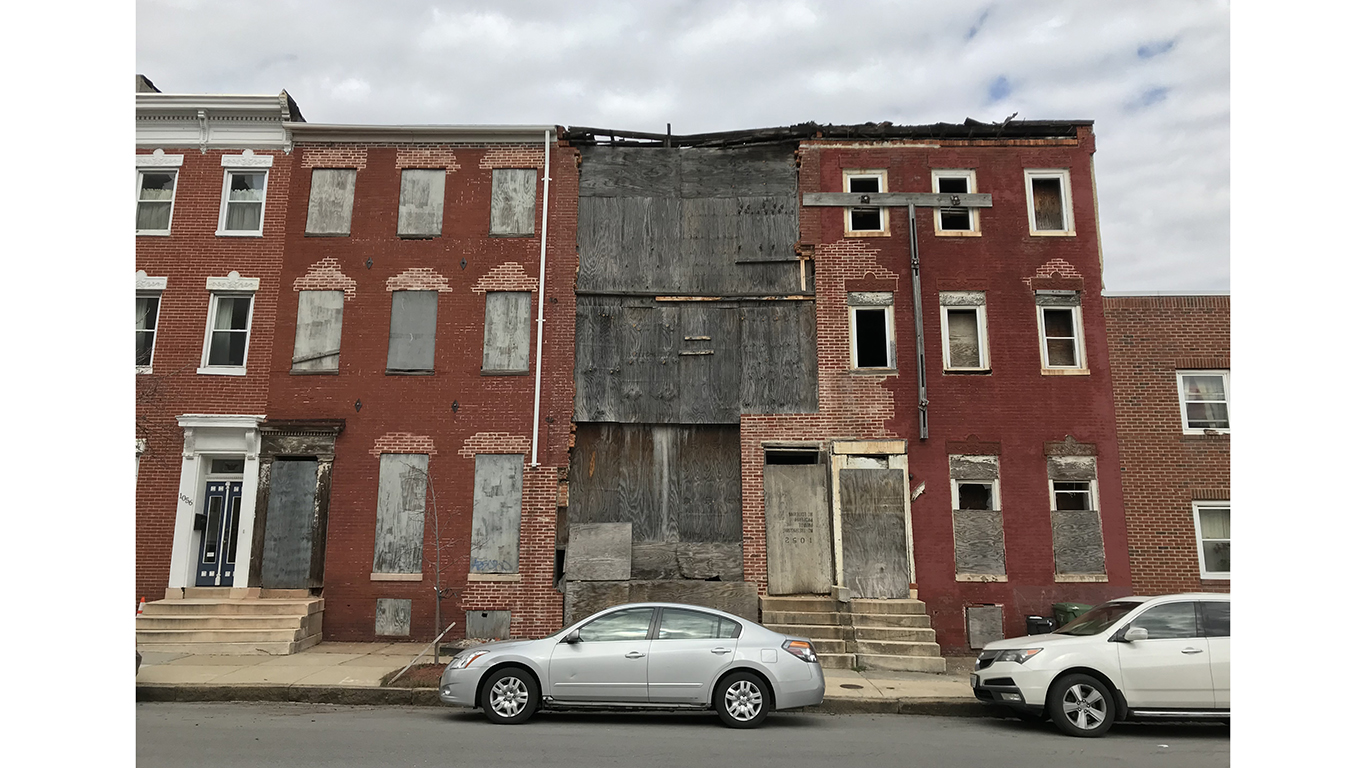
| 1 | 21223 | Baltimore, Maryland | 26,000 | 28,549 | 86.1 |
| 2 | 95969 | Paradise, California | 30,000 | 51,625 | 37.2 |
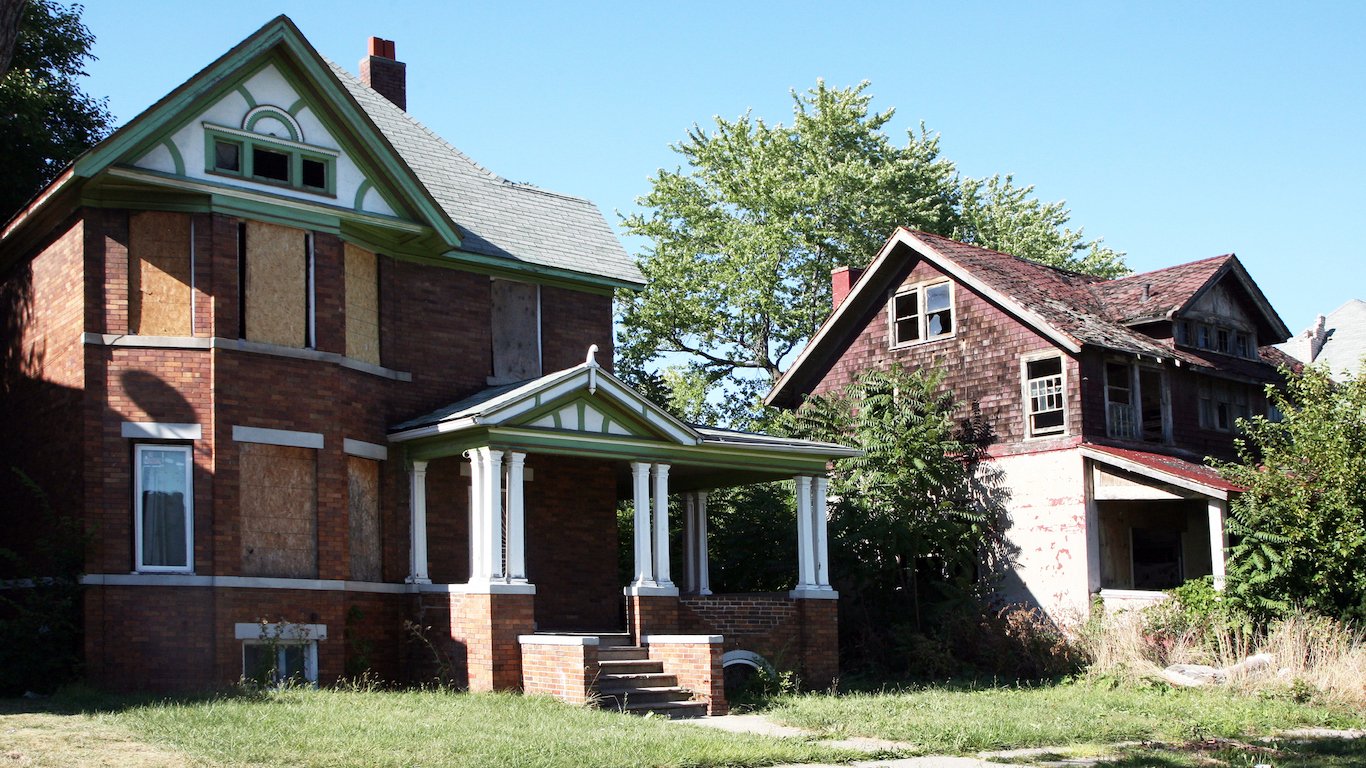
| 3 | 48228 | Detroit, Michigan | 34,500 | 27,337 | 87.6 |
| 4 | 21217 | Baltimore, Maryland | 35,000 | 29,196 | 86.4 |
| 5 | 63136 | Saint Louis, Missouri | 37,000 | 32,223 | 78.6 |
| 6 | 48227 | Detroit, Michigan | 44,850 | 29,197 | 94.0 |
| 7 | 21216 | Baltimore, Maryland | 45,000 | 40,178 | 89.9 |
| 8 | 21213 | Baltimore, Maryland | 45,000 | 39,648 | 91.3 |
| 9 | 48224 | Detroit, Michigan | 45,000 | 35,429 | 91.8 |
| 10 | 38127 | Memphis, Tennessee | 45,000 | 29,798 | 62.8 |
| 11 | 19140 | Philadelphia, Pennsylvania | 48,250 | 22,790 | 87.0 |
| 12 | 46218 | Indianapolis, Indiana | 53,000 | 24,517 | 81.9 |
| 13 | 38109 | Memphis, Tennessee | 56,000 | 31,114 | 62.6 |
| 14 | 47302 | Muncie, Indiana | 57,437 | 37,461 | 71.7 |
| 15 | 21215 | Baltimore, Maryland | 58,500 | 38,651 | 84.2 |
| 16 | 43211 | Columbus, Ohio | 58,500 | 26,724 | 84.6 |
| 17 | 47374 | Richmond, Indiana | 62,330 | 44,085 | 66.6 |
| 18 | 19134 | Philadelphia, Pennsylvania | 65,000 | 31,533 | 89.6 |
| 19 | 48089 | Warren, Michigan | 68,000 | 39,213 | 76.4 |
| 20 | 61401 | Galesburg, Illinois | 68,000 | 38,027 | 71.2 |
| 21 | 47203 | Columbus, Indiana | 69,430 | 62,958 | 33.7 |
| 22 | 38301 | Jackson, Tennessee | 69,500 | 32,114 | 59.8 |
| 23 | 38122 | Memphis, Tennessee | 70,000 | 38,681 | 86.6 |
| 24 | 31204 | Macon, Georgia | 75,000 | 34,407 | 65.0 |
| 25 | 30906 | Augusta, Georgia | 75,331 | 37,536 | 41.4 |
| 26 | 62002 | Alton, Illinois | 78,600 | 45,130 | 75.4 |
| 27 | 32208 | Jacksonville, Florida | 78,650 | 34,565 | 70.7 |
| 28 | 62040 | Granite City, Illinois | 80,000 | 51,953 | 69.3 |
| 29 | 38128 | Memphis, Tennessee | 82,200 | 35,832 | 31.7 |
| 30 | 63114 | Saint Louis, Missouri | 82,750 | 46,346 | 85.1 |
| 31 | 48221 | Detroit, Michigan | 85,000 | 42,952 | 94.6 |
| 32 | 33417 | West Palm Beach, Florida | 85,000 | 37,924 | 16.6 |
| 33 | 61604 | Peoria, Illinois | 85,500 | 46,803 | 74.7 |
| 34 | 47201 | Columbus, Indiana | 86,600 | 63,510 | 41.9 |
| 35 | 35810 | Huntsville, Alabama | 88,000 | 37,488 | 55.6 |
| 36 | 61554 | Pekin, Illinois | 88,500 | 53,369 | 62.6 |
| 37 | 49442 | Muskegon, Michigan | 88,500 | 39,362 | 60.3 |
| 38 | 52601 | Burlington, Iowa | 89,250 | 49,613 | 69.1 |
| 39 | 48146 | Lincoln Park, Michigan | 92,000 | 44,554 | 87.9 |
| 40 | 21218 | Baltimore, Maryland | 94,100 | 47,029 | 87.0 |
| 41 | 35215 | Birmingham, Alabama | 94,626 | 42,519 | 35.6 |
| 42 | 21502 | Cumberland, Maryland | 94,900 | 46,498 | 74.8 |
| 43 | 36109 | Montgomery, Alabama | 95,000 | 54,561 | 47.8 |
| 44 | 61201 | Rock Island, Illinois | 95,000 | 48,473 | 79.7 |
| 45 | 48910 | Lansing, Michigan | 95,000 | 41,010 | 71.4 |
| 46 | 72401 | Jonesboro, Arkansas | 96,250 | 42,218 | 21.2 |
| 47 | 33313 | Fort Lauderdale, Florida | 97,000 | 38,201 | 28.4 |
| 48 | 78521 | Brownsville, Texas | 97,375 | 32,169 | 13.3 |
| 49 | 73110 | Oklahoma City, Oklahoma | 97,500 | 43,059 | 57.4 |
| 50 | 46226 | Indianapolis, Indiana | 97,750 | 36,285 | 68.2 |
Sam Stebbins is a writer at 247WallSt.com where his primary focus is on government policy, politics, companies, and broad social and economic trends. Sam has been writing in the money and news verticals for over 8 years and holds a bachelor's degree from Hobart College, which he earned in 2010. Sam resides in upstate New York and enjoys hiking, biking, canoeing, and skiing in the Adirondack Mountains and across the Northeast.