Per capita income in the United States has more than doubled in the past 60 years. In 1959, Americans’ average per capita income was about $15,000. As of 2019, the average per capita income in the United States was $35,672.
Incomes, however, have not risen equally nationwide. In some major metropolitan areas, incomes have increased far less. Many of these cities were relatively wealthy areas in the mid-20th century, but broad economic trends hampered growth and led to stagnant wages over the decades since.
To determine the American cities that went from rich to poor, 24/7 Wall St. calculated per capita income for all U.S. metropolitan areas and metro area equivalents in both 1959 and in 2019. We ranked cities based on their change in rank relative to all metro areas over that 60-year period. Income figures for 1959 have been adjusted for inflation.
Many of the metro areas on the list are Rust Belt communities, former manufacturing hubs that have undergone considerable economic decline in recent decades. Beginning in the 1970s, American manufacturers outsourced jobs to cheaper labor abroad. More recently, automation has taken a toll on employment in the manufacturing sector. Since peaking in June 1979, the number of Americans working in manufacturing has fallen by over 37%.
[nativounit]
In other cases, manufacturers left the towns on the list in favor of areas where workers were not protected by collective bargaining agreements. Unionized workers are typically paid more than workers who are not in a union, and falling wages in these cities are likely attributable in part to a reduction in labor union participation.
Closures of major manufacturing operations that once served as an economic backbone in the metro areas on the list often triggered a long-term, downward economic spiral.
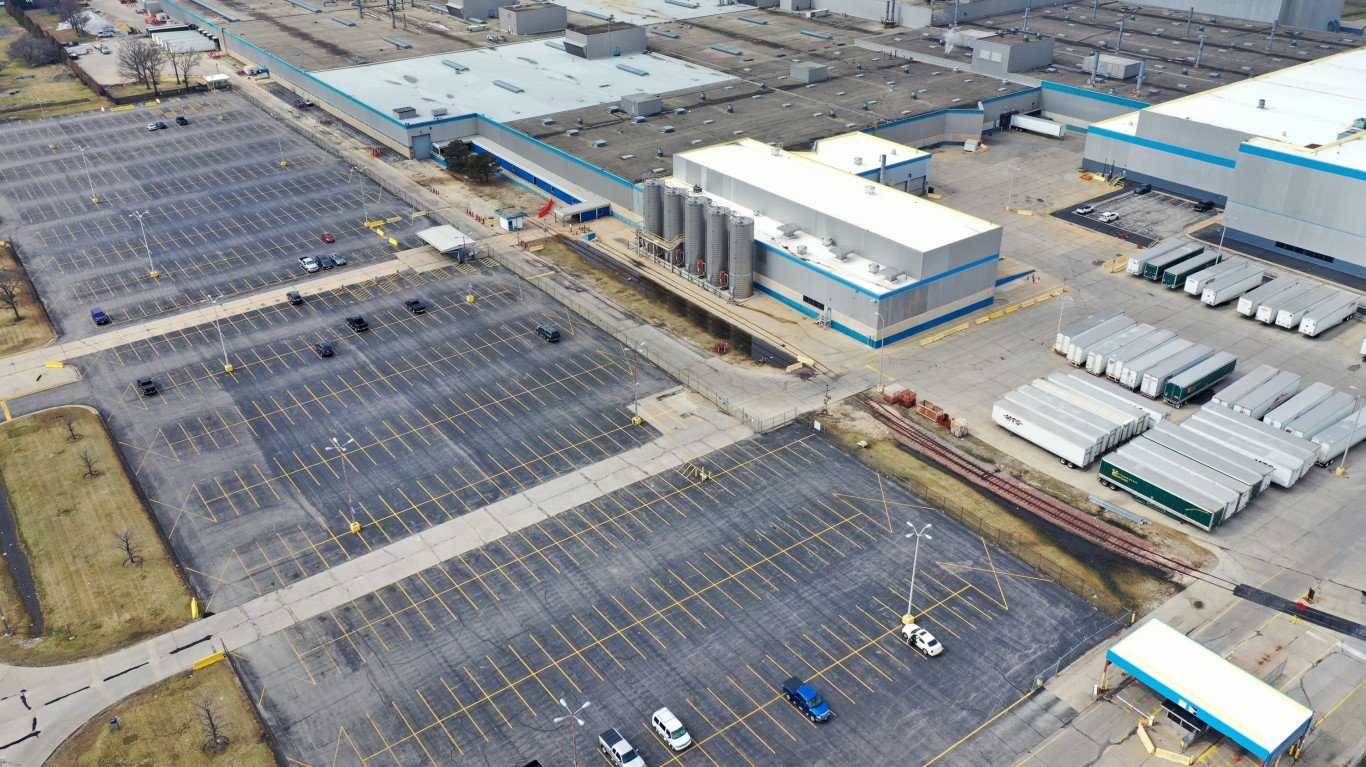
This city topped the list of cities that went from rich to poor.
Elkhart-Goshen, Indiana
> Inflation adj. per capita income; 1959: $16,844 (32 of 381 cities)
> Per capita income; 2019: $26,745 (323 of 381)
> Population change; 1959–2019: +93.2% (106,790 to 206,341)
> Unemployment rate; 2019: 3.1%
In 1959, only 31 of all 381 U.S. metro areas had a higher income per capita than Elkhart-Goshen, Indiana. As of 2019, 322 U.S. metro areas did. The area, which is known as the “RV Capital of the World,” has suffered in recent years due to declining demand for RVs, which are manufactured largely in the Elkhart area. RV shipments fell by about 16% in 2019 from the previous year, prompting local RV maker Thor Industries to reduce production, along with employee hours. Elkhart’s critical RV industry also was slammed during the Great Recession following the 2008 financial crisis, which sent the local unemployment rate to 22%.
Click here for the detailed methodology.
[recirclink id=805615][wallst_email_signup]
Contact [email protected] for any questions or corrections.