Over the last 50 years, incomes in the United States have increased dramatically. Even after adjusting for inflation, per capita income more than doubled, from $14,700 in 1959 to $33,831 today. There are a number of U.S. metropolitan areas that, due to economic decline, have gone from being relatively high-income places to some of the poorest.
To determine the American cities that went from rich to poor, 24/7 Wall St. calculated per capita income for all U.S. metropolitan statistical areas in both 1959, the first year with consistent data, and in 2018. We ranked the cities based on their change in rank relative to all metropolitan areas from 1959 to 2018. For the purpose of comparison, we calculated the 1959 income levels for areas that comprise today’s metropolitan areas.
Click here to see the American cities that went from rich to poor.
Click here to see our full methodology.
Many of the metropolitan areas on this list are in the Midwest, spanning an area that has come to be known as the Rust Belt. These metropolitan areas are former industry hubs and innovation centers that were prosperous in the middle of the 20th century. By the 1970s, however, steel manufacturers, automakers, and other staples of American industry had already started divestment in domestic labor forces and reductions in manned labor, by opening factories overseas and implementing automated processes. Businesses were scaled down or vanished entirely from these cities.
In general, once those companies left, these cities, which had been highly dependent on specific industries, began to stagnate. Between 1959 and 2018, the U.S. population increased by 82.4%. The majority of the metro areas on this list had population increases over the same period of less than half the U.S. rate, and four actually had population declines over this period. These are 5 cities that have lost half of more of their populations since 1950.
There are a few exceptions to this rule of population stagnation on this list, notably metro areas in California like Stockton and Redding, which have much larger populations than they did 50 years ago. While these metro areas generally enjoyed economic, housing, and population boom ahead of the financial crisis, their economies collapsed when the subprime mortgage crisis hit and they are still recovering from the collapse.
While the U.S. unemployment rate was 3.9% in 2018, a number of metropolitan areas on this list had unemployment rates of over 5%, with one California metro area’s jobless rate clocking in at 8.0%. These are the American cities losing the most jobs over the last five years.
Correction: In a previous version of this article, the two countries that comprise the Walla Walla, WA metro area were incorrectly listed as Columbia and McLennan counties. The two counties that make up the metropolitan area are in fact Columbia and Walla Walla counties.

20. Wichita, KS
> Inflation adjusted per capita income, 1959: $15,557 (63 of 380)
> Inflation adjusted per capita income, 2018: $29,180 (205 of 380)
> Population change, 1959-2018: +45.7% (442,765 to 645,031)
> Unemployment rate, 2018: 3.7%
For a few decades after World War II, Wichita was home to operations by Boeing and others and has been known as “The Air Capital of the World.” But aircraft manufacturing throughout the Midwest has struggled. The city’s aerospace manufacturing industry shed thousands of jobs during the financial crisis, headlined by the departure of Boeing in 2013, and the city has struggled to benefit from the national economic growth of the last decade.
What is today the Wichita, Kansas, metro area had an inflation-adjusted per capita income of $15,557 in 1959, which is well above the U.S. real per capita income of $14,700 at the time. Based on current metro area boundaries, Wichita would have ranked as the 63rd wealthiest metro area out of 381. Today, it ranks 205th. Nationwide, per capita income rose by 130% between 1959 and 2018, but in Wichita, it rose by just 87.6% — the 43rd smallest increase out of 381 metropolitan areas. Over the same period, Wichita’s population increased at about half the pace of growth of the U.S. population.
[in-text-ad]

19. Youngstown-Warren-Boardman, OH-PA
> Inflation adjusted per capita income, 1959: $14,887 (109 of 380)
> Inflation adjusted per capita income, 2018: $27,587 (251 of 380)
> Population change, 1959-2018: -15.3% (636,525 to 538,952)
> Unemployment rate, 2018: 5.8%
Youngstown, once one of the most prosperous industrial cities in the Midwest, was left devastated by the decline of American manufacturing in the second half of the 20th century.
In September 1977, the Youngstown Sheet & Tube factory closed on a day that locals would later call “Black Monday.” The closing represented a death knell for the dying steel industry. As many as 50,000 jobs would depart the region in the coming five years.
As is often the case in these legacy cities characterized by loss of industry, the city’s population has shrunk over the last half century, declining by 15.3% even as the U.S. population increased by 82.4%. Today, the metropolitan area has a poverty rate of 16.9% compared to the national poverty rate of 13.1%. Its 5.8% unemployment rate ranks as the 24th highest among metropolitan areas.
[recirclink id=582604]
18. Decatur, IL
> Inflation adjusted per capita income, 1959: $15,710 (53 of 380)
> Inflation adjusted per capita income, 2018: $29,539 (197 of 380)
> Population change, 1959-2018: -11.5% (118,257 to 104,712)
> Unemployment rate, 2018: 5.6%
Population growth often closely reflects income growth, but even cities with declining income levels have grown in population since 1959. One exception is Decatur, Illinois. It is one of four cities on this list with shrinking population since 1959 — even as the U.S. population rose by more than 80% during that time. Over that period, Decatur’s per capita income went from 53rd highest out of metro areas in 1959 to 197th in 2018.
The story of Decatur’s income rank decline is familiar to legacy cities, which have struggled with American industry’s divestment in domestic labor, the widespread adoption of automated manufacturing techniques, and other factors.
17. South Bend-Mishawaka, IN-MI
> Inflation adjusted per capita income, 1959: $15,835 (48 of 380)
> Inflation adjusted per capita income, 2018: $29,591 (196 of 380)
> Population change, 1959-2018: +17.0% (275,546 to 322,424)
> Unemployment rate, 2018: 3.6%
The South Bend region, which once had a thriving auto manufacturing-driven economy, has experienced the same population and economic stagnation as other Midwest cities. Its population has increased by just 17% in the past 50 years, one of the smallest increases among metropolitan areas, at a time the U.S. population rose by more than 80%.
The metropolitan area would rank in the top 50 in per capita income in 1959. Today, it ranks 196th. South Bend’s economy has shown signs of improvement over the last half decade, but not enough to offset the substantial loss in income.
[in-text-ad-2]
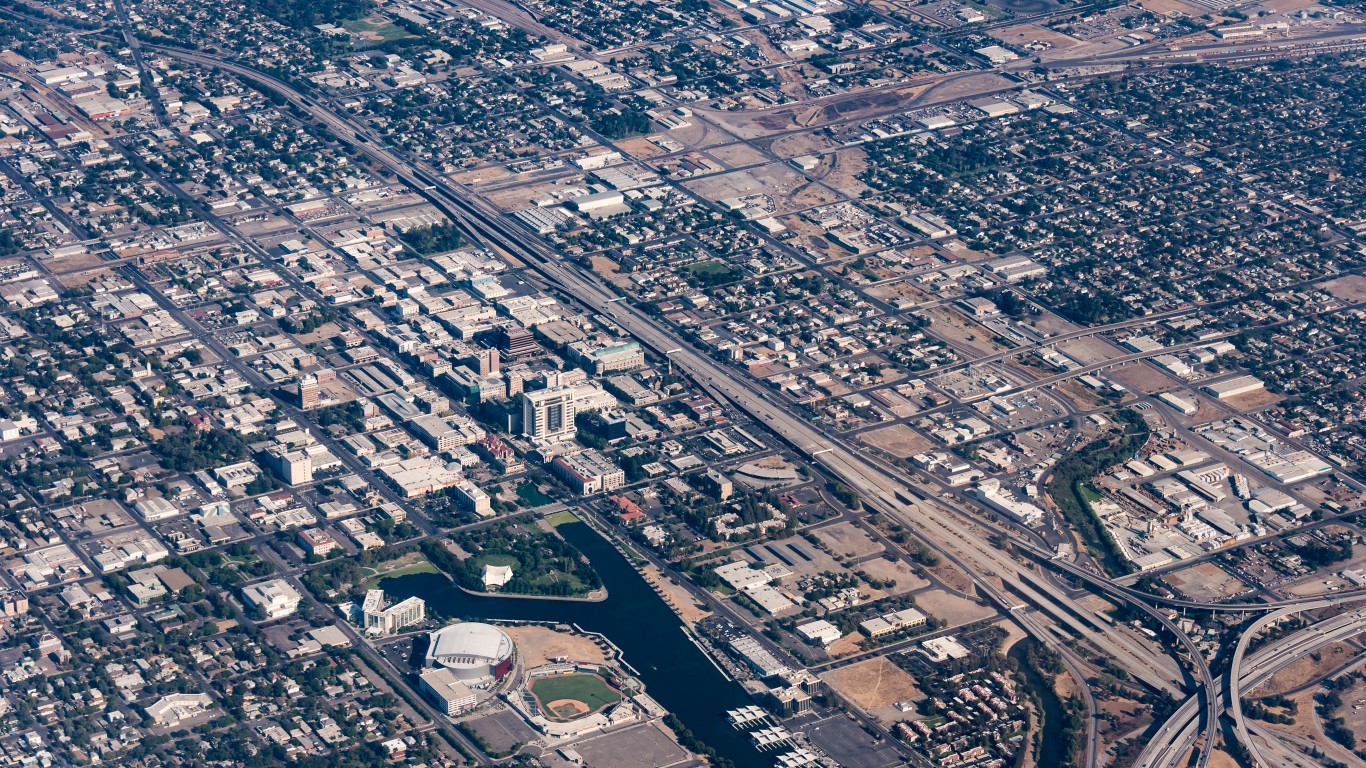
16. Stockton-Lodi, CA
> Inflation adjusted per capita income, 1959: $14,740 (119 of 380)
> Inflation adjusted per capita income, 2018: $27,217 (268 of 380)
> Population change, 1959-2018: +201.1% (249,989 to 752,660)
> Unemployment rate, 2018: 6.0%
Like several other metropolitan areas on this list, the decline in Stockton, California, is relatively recent, related to the financial crisis. Because of that, unlike the majority of metropolitan areas on this list, Stockton’s population has more than tripled in the past half century, fueled by economic and housing boom ahead of the financial crisis.
When the housing market collapsed, Stockton was left devastated. The city gained the notoriety for becoming at the time the most populous city in the United States to file for bankruptcy after the collapse created a severe pension crisis. In 2010, Stockton’s unemployment rate reached 18%, and its 2018 unemployment rate of 6.0% is the 20th highest among all U.S. metropolitan areas.
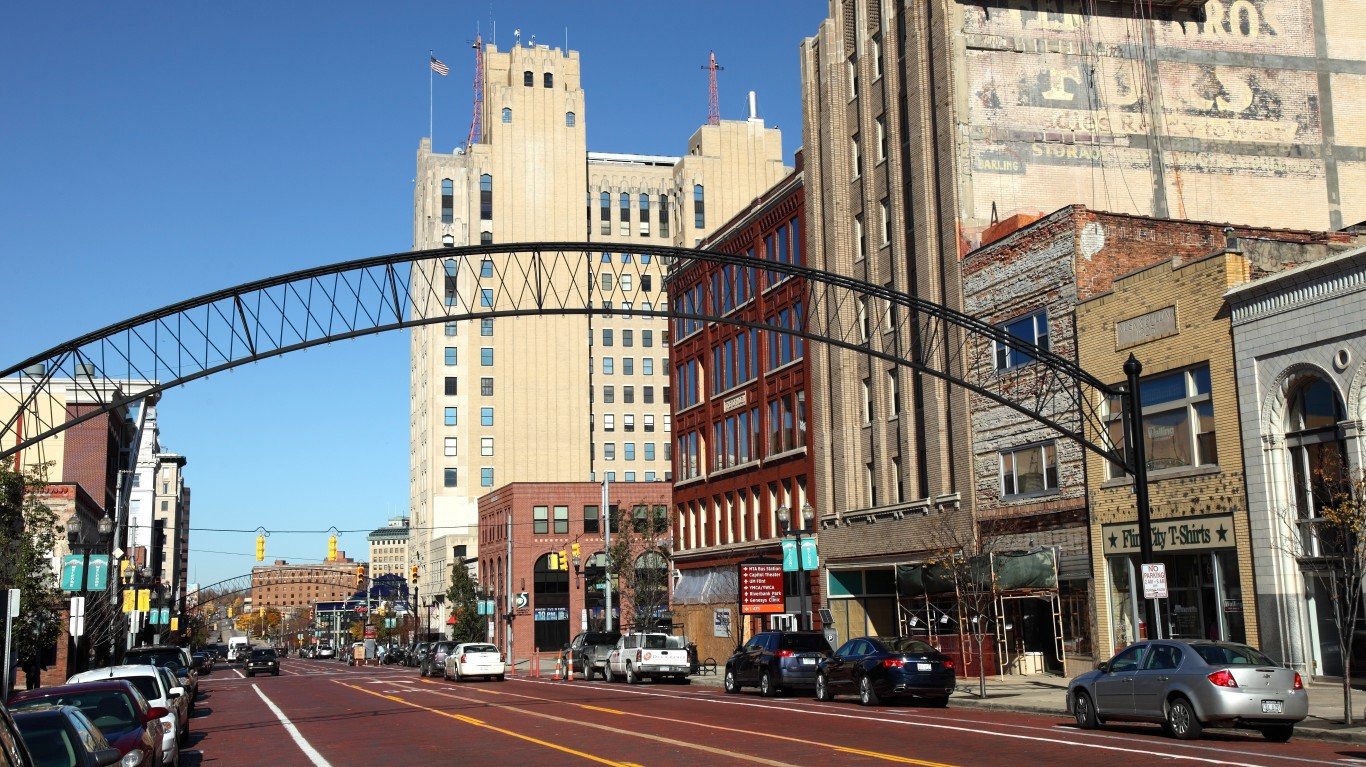
15. Flint, MI
> Inflation adjusted per capita income, 1959: $15,210 (87 of 380)
> Inflation adjusted per capita income, 2018: $28,039 (236 of 380)
> Population change, 1959-2018: +8.7% (374,313 to 406,892)
> Unemployment rate, 2018: 4.9%
Flint, Michigan, gained national press recently after dangerous levels of lead contamination were discovered in the city’s public water supply. The water crisis is only the latest problem the city has struggled with after dealing with decades of economic decline and stagnant population growth. Between 1979 and 1989, Flint’s per capita income fell from 44th highest to 131st highest, and today it ranks 236th overall.
Flint, which is an hour outside of Detroit, was once a major auto manufacturing hub, but like Detroit and other auto manufacturing-heavy cities, jobs began to vanish from the region as American auto manufacturing began to be outsourced to outside the United States and automation replaced many workers. Filmmaker Michael Moore, who was born and raised in Flint, documented the city’s decline in his debut documentary “Roger & Me,” which focused on General Motors’ decision to move jobs from Flint to Mexico despite having substantial profits.
[in-text-ad]
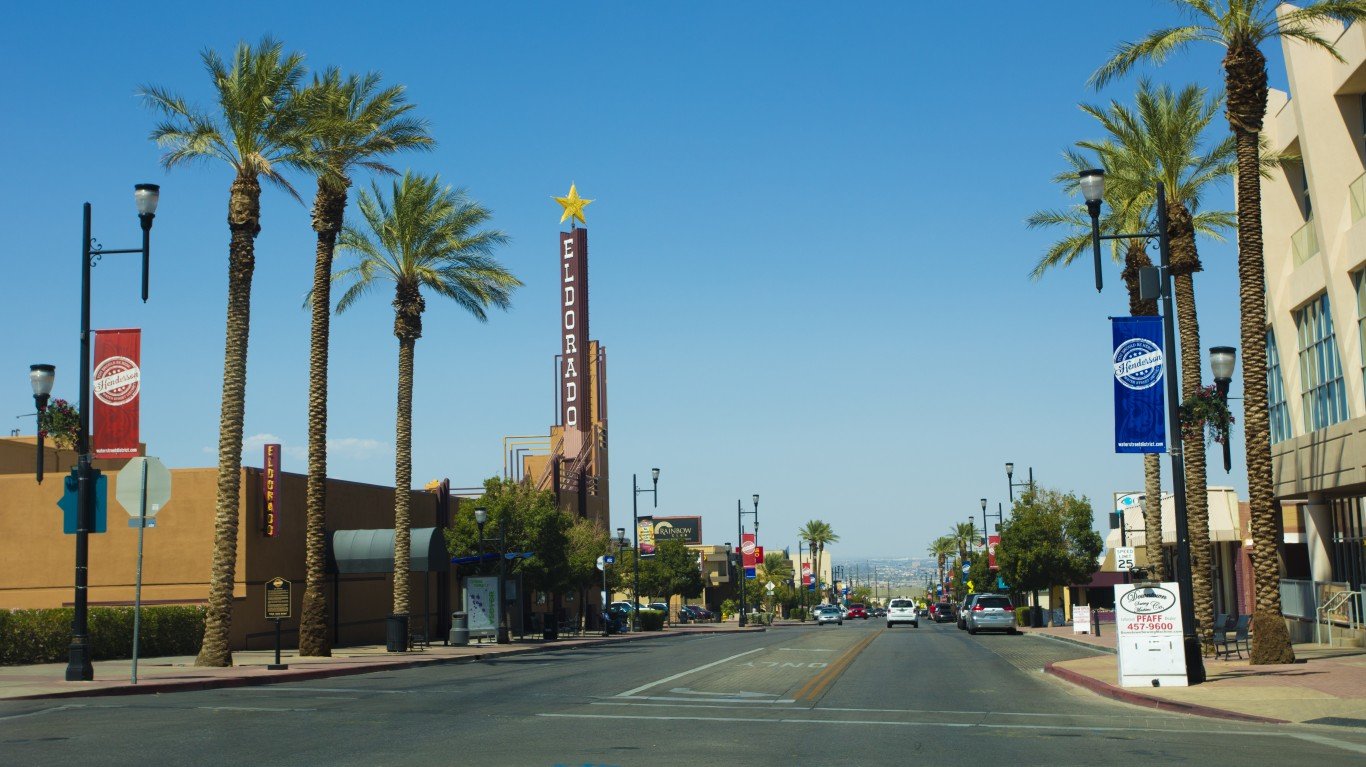
14. Las Vegas-Henderson-Paradise, NV
> Inflation adjusted per capita income, 1959: $19,254 (5 of 380)
> Inflation adjusted per capita income, 2018: $30,754 (157 of 380)
> Population change, 1959-2018: +1,657.0% (127,016 to 2,231,647)
> Unemployment rate, 2018: 4.8%
What is today the Las Vegas metro area had a per capita income in 1959 of nearly $20,000 in today’s dollars, an income level that ranked fifth highest in 1959. The city was already known for gaming at the time, having introduced casinos, hotels, and gaming regulations over the past several decades. The Moulin Rouge hotel opened in 1955; Silver Palace, Last Vegas’ first two-story club, opened in 1956; and the Las Vegas Convention Center opened in 1959.
While income levels seem to have increased considerably since then, as they have across most of the country, the 2018 per capita income in Las Vegas of $30,754 is lower than in most metro areas. At the same time, however, the Las Vegas area has grown rapidly. Its population has grown by a remarkable 1,657%, from 127,016 residents in 1959 to well over 2 million last year, the third largest population growth over that period.
[recirclink id=580581]

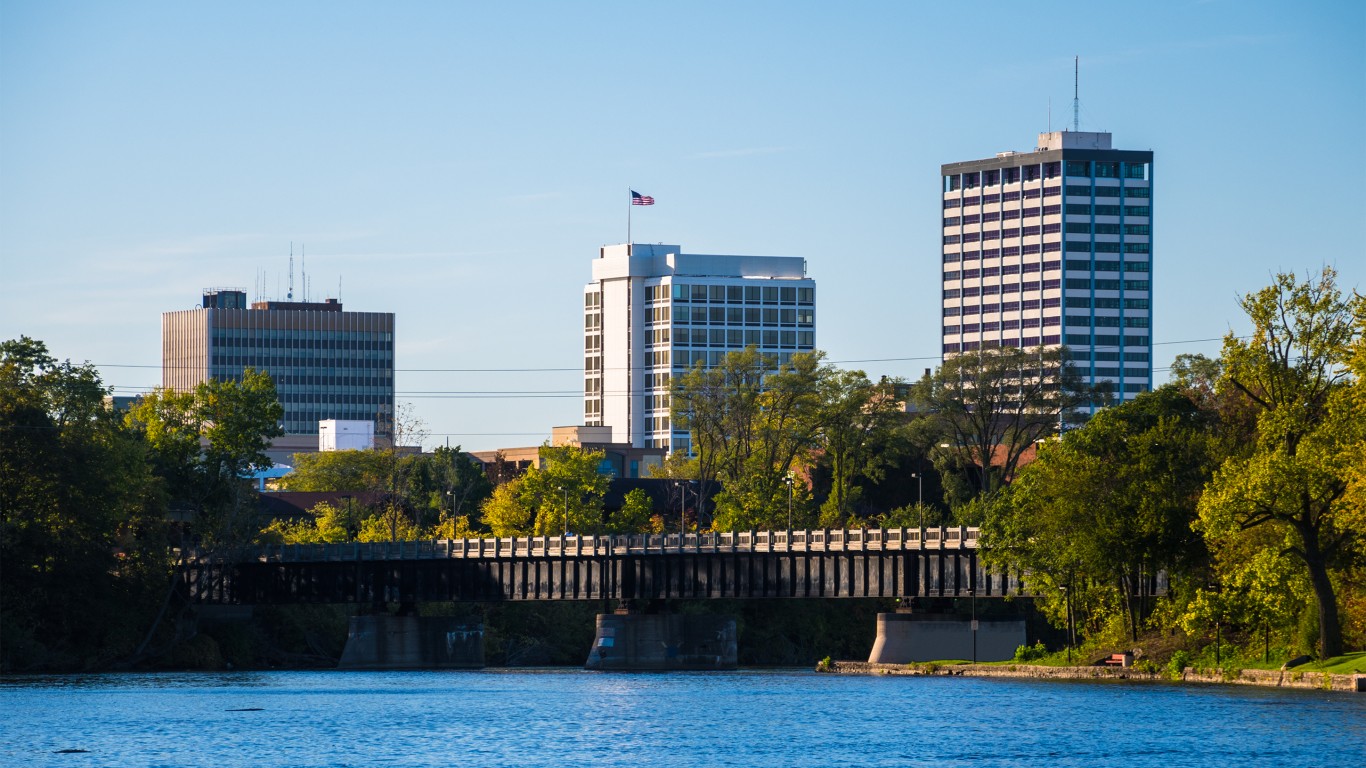
13. Racine, WI
> Inflation adjusted per capita income, 1959: $16,591 (31 of 380)
> Inflation adjusted per capita income, 2018: $29,897 (188 of 380)
> Population change, 1959-2018: +38.7% (141,781 to 196,584)
> Unemployment rate, 2018: 3.6%
Taiwanese technology giant Foxconn has created excitement across Wisconsin with its announcements of various development projects, including an innovation center in Racine. While encouraging to the city’s ongoing recovery efforts from lingering economic woes tied to the 2008 recession, the developments are to some extent still up in the air, and the metro area has a great distance to cover before returning to the prosperity it had in 1959, when per capita income was 31st in the nation.
And while the population in the area that currently comprises the Racine metro area has grown by 38.7% since then, that growth is half the national average growth and one of the slowest growth rates of all metropolitan areas.
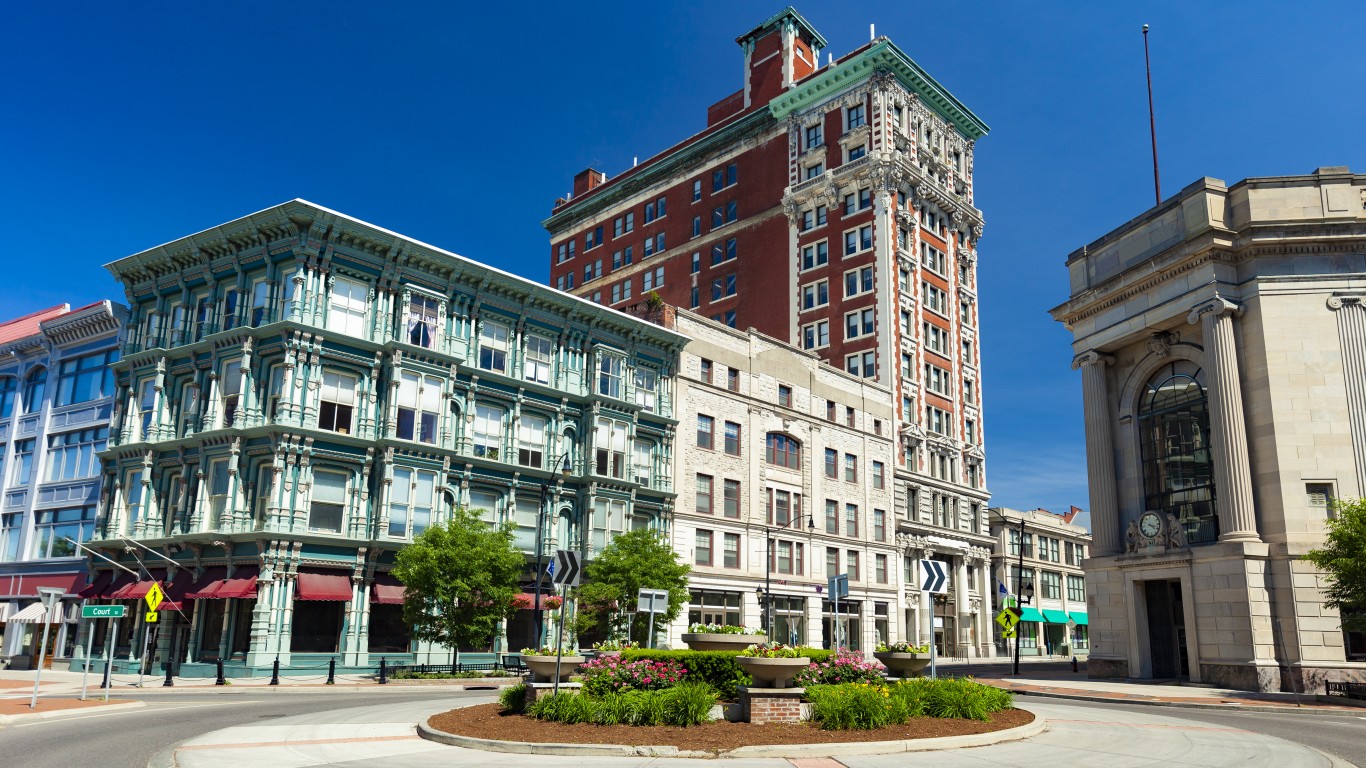
12. Binghamton, NY
> Inflation adjusted per capita income, 1959: $15,570 (62 of 380)
> Inflation adjusted per capita income, 2018: $28,564 (223 of 380)
> Population change, 1959-2018: -4.1% (250,463 to 240,219)
> Unemployment rate, 2018: 4.8%
Overall employment in Binghamton, New York, fell by 5.1% over the last eight years. In that same time, U.S. employment grew 12.5%. After years of decline, the Binghamton economy has only recently started to recover from the effects of the Great Recession. But the metro area’s more recent struggles are part of the longer trend of industrial decline common in legacy cities. According to the Federal Reserve Bank of New York, while manufacturing is still a major component of the area’s economy, the city has lost nearly 70% of its manufacturing jobs since 1990.
Binghamton is one of the nation’s few metro areas where population has declined since 1959, from 250,463 residents to 240,219.
[in-text-ad-2]

11. Redding, CA
> Inflation adjusted per capita income, 1959: $15,488 (68 of 380)
> Inflation adjusted per capita income, 2018: $28,144 (232 of 380)
> Population change, 1959-2018: +202.8% (59,468 to 180,040)
> Unemployment rate, 2018: 4.9%
Redding’s presence on this list is likely due in large part to the boom and bust of the period leading up to and following the subprime mortgage crisis. The population of the metropolitan area, which is made up of Shasta County, has increased by over 200% in the past 50 years. That population increase is partially tied to the construction boom that was especially prominent in California and which led up to the housing crisis.
Years after the housing crisis, Redding is still reeling from the effects of the collapse. Redding’s monthly unemployment rate peaked at 18.5% in 2010, and today, the metro area still has one of the highest annual metropolitan unemployment rates in the country.

10. Michigan City-La Porte, IN
> Inflation adjusted per capita income, 1959: $14,797 (116 of 380)
> Inflation adjusted per capita income, 2018: $26,844 (281 of 380)
> Population change, 1959-2018: +15.7% (95,111 to 110,007)
> Unemployment rate, 2018: 4.4%
The Michigan City-La Porte metropolitan area comprises LaPorte county in the northern part of the state, to the east of Gary and the west of Elkhart, near Lake Michigan. Michigan City once was home to a busy lumber port that has since vanished. The decline in the relative income of the area mirrors that of a number of other nearby metropolitan areas, including Elkhart, which also makes this list.
The metropolitan area’s population has grown by just 15% in the past 50 years, even as the U.S. population growth rate at that time was more than 80%. Michigan City has a poverty rate of 16.4%, compared to the national poverty rate of 13.1%.
[in-text-ad]

9. Rockford, IL
> Inflation adjusted per capita income, 1959: $16,536 (33 of 380)
> Inflation adjusted per capita income, 2018: $29,503 (199 of 380)
> Population change, 1959-2018: +46.7% (230,091 to 337,658)
> Unemployment rate, 2018: 5.7%
The metropolitan area of Rockford — today the third largest city in Illinois — had in 1959 the 33rd highest income level in the nation. In the 1970s and 1980s, Rockford was known as the “screw capital of the world,” due to its screw, bolt, and fastener manufacturing industry. Since then, as has been the case in many of the former industrial centers across the upper Midwestern United States, Rockford’s economy has endured large declines in jobs, decaying infrastructure, and rising unemployment and poverty.
Returning to the old days of economic prosperity is certainly no small order, and Rockford and cities like it continue to take small steps towards transformation. One reason for optimism is that for the first time in two decades, Rockford entered 2019 with a budget surplus.
[recirclink id=567309]

8. Toledo, OH
> Inflation adjusted per capita income, 1959: $16,290 (37 of 380)
> Inflation adjusted per capita income, 2018: $29,222 (204 of 380)
> Population change, 1959-2018: +7.9% (558,828 to 602,871)
> Unemployment rate, 2018: 4.9%
Toledo, Ohio, like many of the cities on this list, was once a major manufacturing hub that suffered the loss of jobs and people during the second half of the 20th century. The city was known for its glass production and was home to seven Fortune 500 companies in the 1970s. Today it is home to just one.
Toledo’s population increased by just 7.9% between 1969 and 2018, compared to an over 80% increase in the U.S. population. The city’s income rank fell from 37th highest out of 380 metro areas in 1959 to 204th overall in 2018.
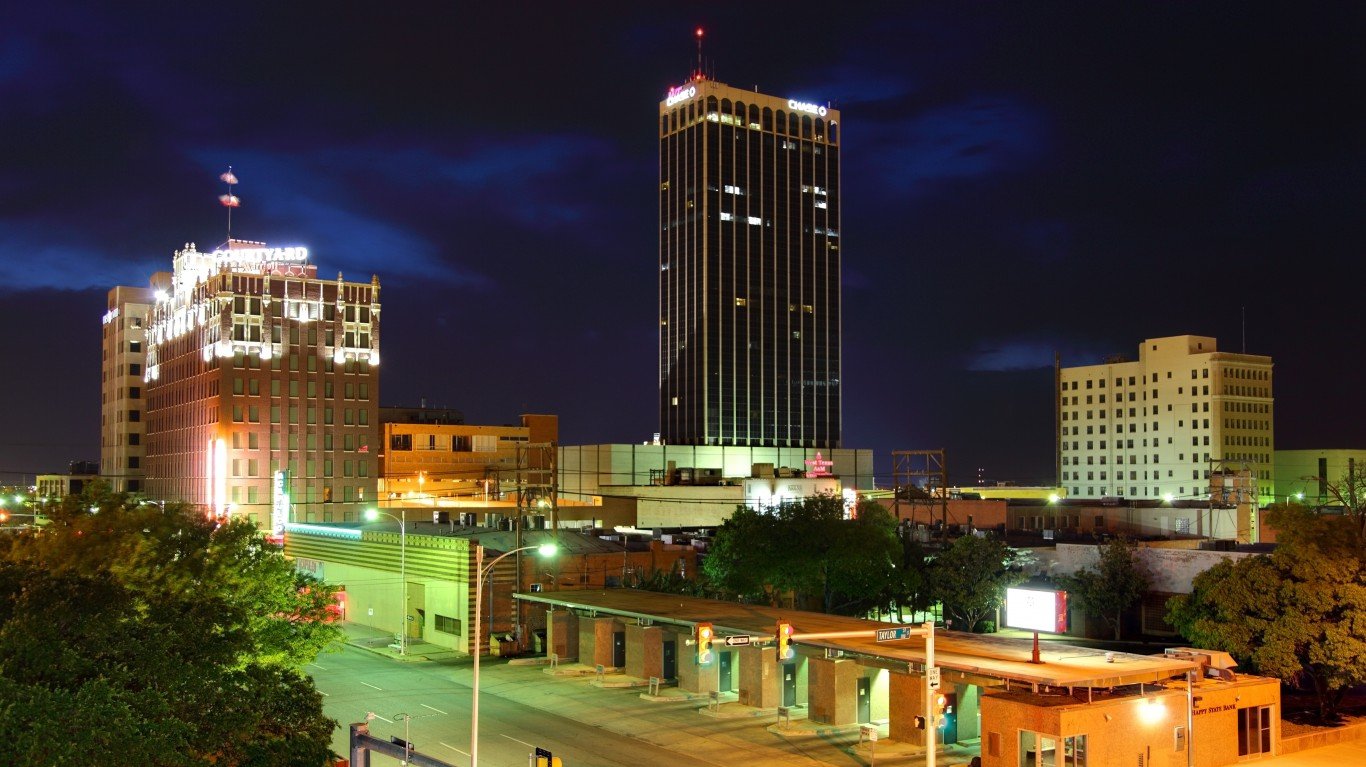
7. Amarillo, TX
> Inflation adjusted per capita income, 1959: $15,653 (57 of 380)
> Inflation adjusted per capita income, 2018: $28,354 (228 of 380)
> Population change, 1959-2018: +66.5% (161,168 to 268,356)
> Unemployment rate, 2018: 2.8%
The Amarillo, Texas, metropolitan area today is made up of five counties in the Texas panhandle. Amarillo compares favorably to most of the metro areas on this list in poverty and unemployment. The metro area’s unemployment rate of 2.8% is one of the lowest in the country.
Still, the region has become relatively much poorer than it was 50 years ago. In 1959, the Amarillo metro area ranked 57th overall in median household income. Today it ranks 228th.
[in-text-ad-2]
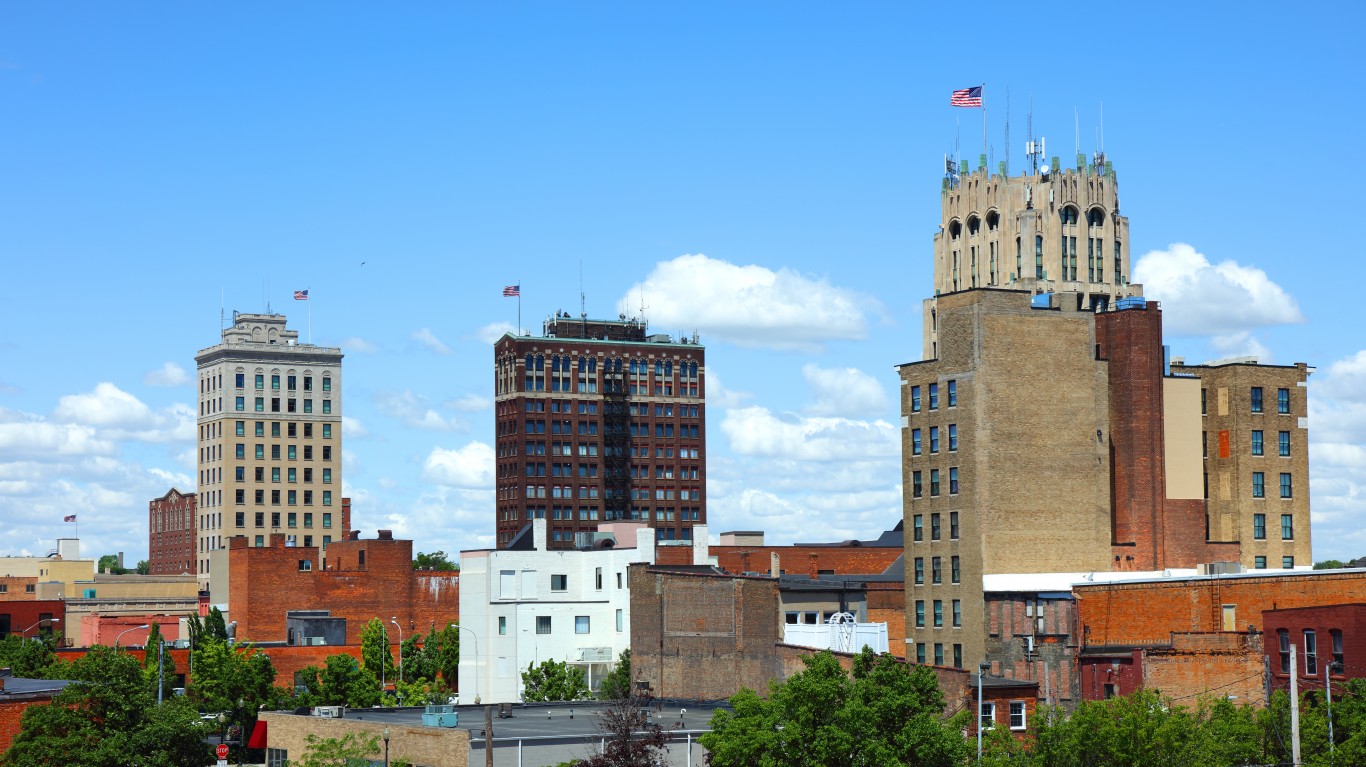
6. Jackson, MI
> Inflation adjusted per capita income, 1959: $15,471 (70 of 380)
> Inflation adjusted per capita income, 2018: $26,940 (278 of 380)
> Population change, 1959-2018: +20.3% (131,994 to 158,823)
> Unemployment rate, 2018: 3.9%
Like a number of metropolitan areas in the Midwest, Jackson’s population has been relatively stagnant compared to the nation as a whole, increasing 20% between 1959 and 2018, compared to a more than 80% increase in population nationwide. In the 1980s, Jackson lost several key employers, including tire manufacturer Goodyear, which closed its operations in the city in 1984.
Today, city planners are looking to revitalize a decimated downtown, which in the mid 20th century was vibrant with department stores and restaurants. The efforts may help increase the metro area’s relative per capita income, which fell from 70th highest in 1959 to 278th overall in 2018.
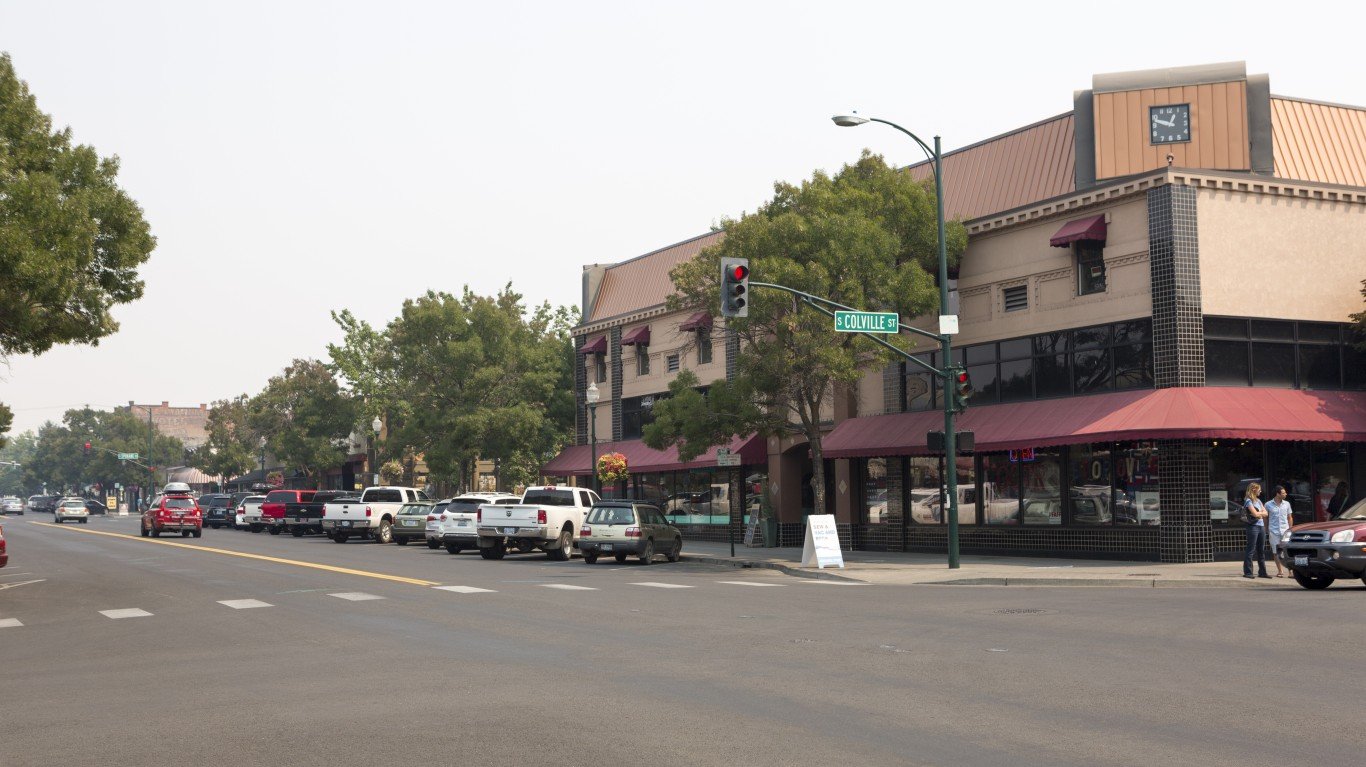
5. Walla Walla, WA
> Inflation adjusted per capita income, 1959: $15,530 (65 of 380)
> Inflation adjusted per capita income, 2018: $26,805 (282 of 380)
> Population change, 1959-2018: +40.3% (46,764 to 65,611)
> Unemployment rate, 2018: 4.8%
In 1959, Columbia and Walla Walla counties, which today make up the metropolitan area of Walla Walla, Washington, had an inflation-adjusted income that ranked 65th out of 380 U.S. metropolitan areas. Today, the Walla Walla metro area’s per capita income ranks 282nd overall. The area’s pace of population growth was about half the U.S. pace over the past 50 years.
The metro area’s 2018 unemployment rate of 4.8% is nearly a percentage point higher than the national unemployment rate and ranks as one of the higher figures among metropolitan areas.
[in-text-ad]
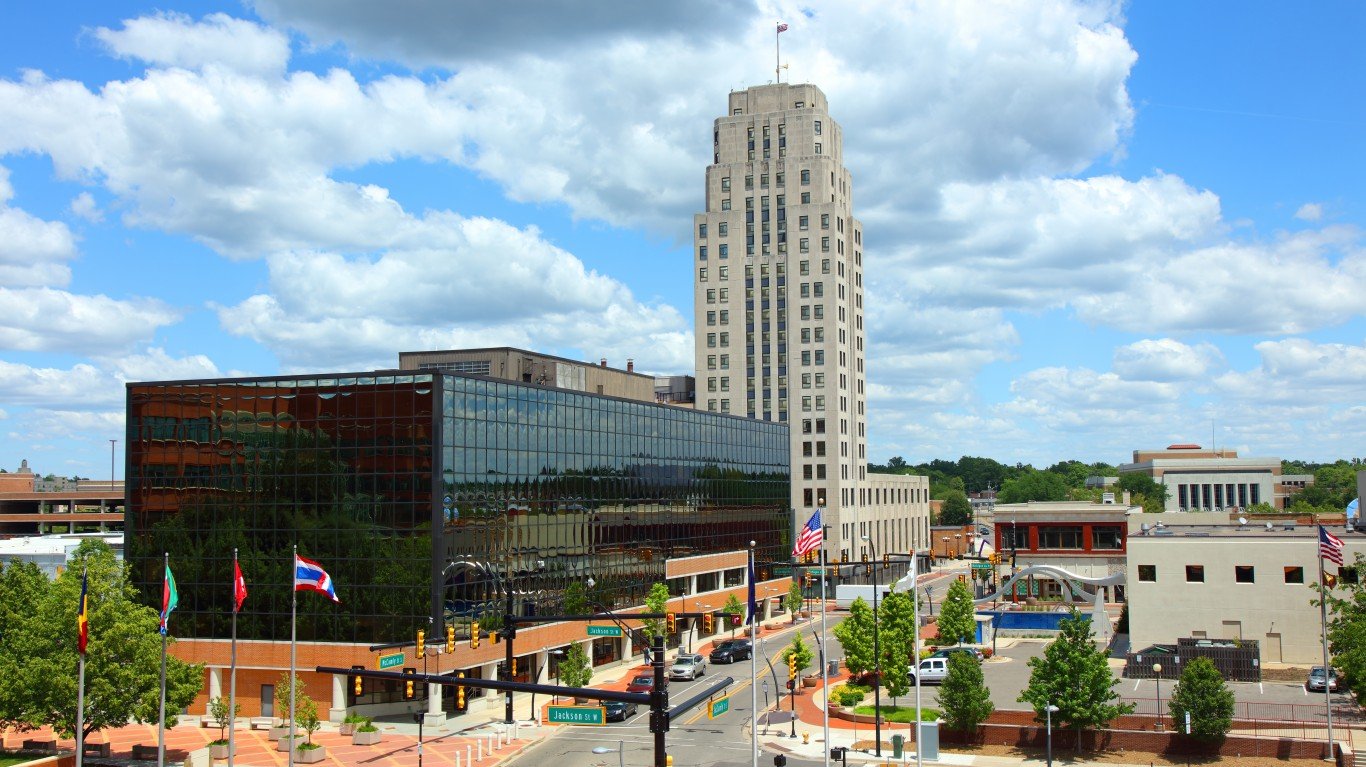
4. Battle Creek, MI
> Inflation adjusted per capita income, 1959: $15,504 (67 of 380)
> Inflation adjusted per capita income, 2018: $26,276 (300 of 380)
> Population change, 1959-2018: -3.1% (138,858 to 134,487)
> Unemployment rate, 2018: 4.2%
Battle Creek is one of the few metropolitan regions where the population has declined since 1959, from 138,858 to 134,487. As is the case in many of the legacy cities on this list and especially cities in Michigan, Battle Creek’s decline in income level ranking over the past six decades is related to the struggle of American industry. Shuttered steel and car factories do not explain the problem in the Battle Creek area, however; the problem is largely due to Kellogg cereal’s declining business. The cereal giant, which is headquartered in Battle Creek, has not kept up with changing tastes as U.S.-wide cereal sales decline.
[recirclink id=582604]
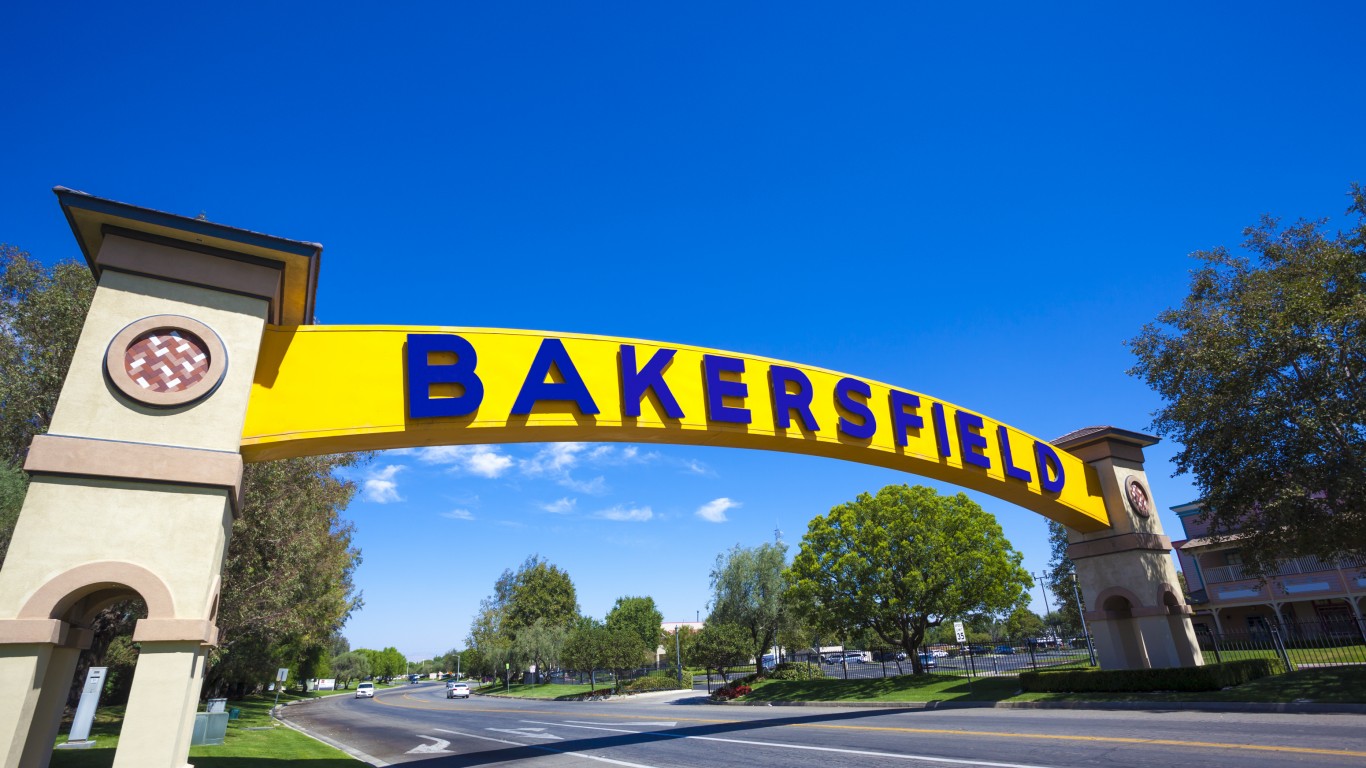
3. Bakersfield, CA
> Inflation adjusted per capita income, 1959: $14,852 (110 of 380)
> Inflation adjusted per capita income, 2018: $22,778 (366 of 380)
> Population change, 1959-2018: +207.1% (291,984 to 896,764)
> Unemployment rate, 2018: 8.0%
The population living in the Bakersfield area more than tripled in size between 1959 and 2018, growing from 291,984 to 896,764. This was one of the largest population growths of any metro area in the nation. But a relative growth in income levels did not accompany the area’s population boom. Bakersfield’s per capita income, which in 1959 was among the higher income levels in the nation, is now close to the bottom. The average resident has an income of $22,778, compared to the national per capita income of $33,831. The area’s 2018 unemployment and poverty rates of 8.0% and 20.6%, respectively, are also among the highest of any metro area.
Bakersfield’s primary industries are manufacturing, agriculture, and petroleum extraction. In recent years, the area’s economy has been affected by the volatility of oil prices. In 2015, for example, low oil prices resulted in 2,500 layoffs at oil-related companies across Kern County.

2. Mansfield, OH
> Inflation adjusted per capita income, 1959: $15,583 (61 of 380)
> Inflation adjusted per capita income, 2018: $24,927 (338 of 380)
> Population change, 1959-2018: +2.8% (117,761 to 121,099)
> Unemployment rate, 2018: 4.9%
The story of Mansfield, Ohio is familiar to legacy cities, which have struggled with American industry’s divestment in domestic labor, the widespread adoption of automated manufacturing techniques, and other factors. In 1959, when income levels in the area ranked in the higher end of the nation’s urban areas, anything from stoves, tires, steel, machinery, refrigerators, and cars were manufactured in Mansfield. Over the course of the next four decades, factories shut down year after year. The latest, most notable factory shutdown in Mansfield was General Motors’s largest stamping factory in 2010. Today’s per capita income in the city ranks near the bottom of U.S. metro areas.
While the Mansfield area population grew in each of the three decades after 1959, it declined over the 20 years between 1989 and 2018. The 2.8% growth since 1959 is exceptionally small compared to the rest of the nation’s metro areas. The U.S. population grew by 82.4% over that period.
[in-text-ad-2]

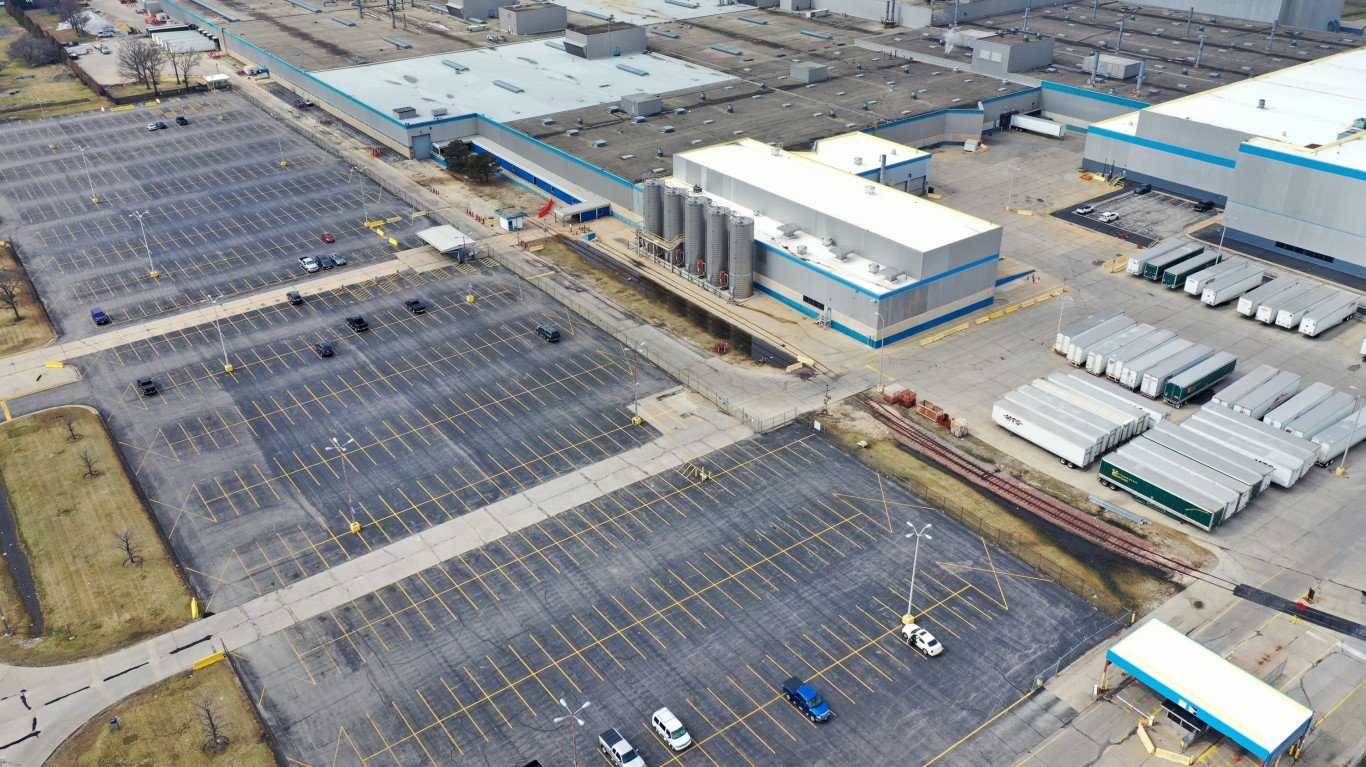
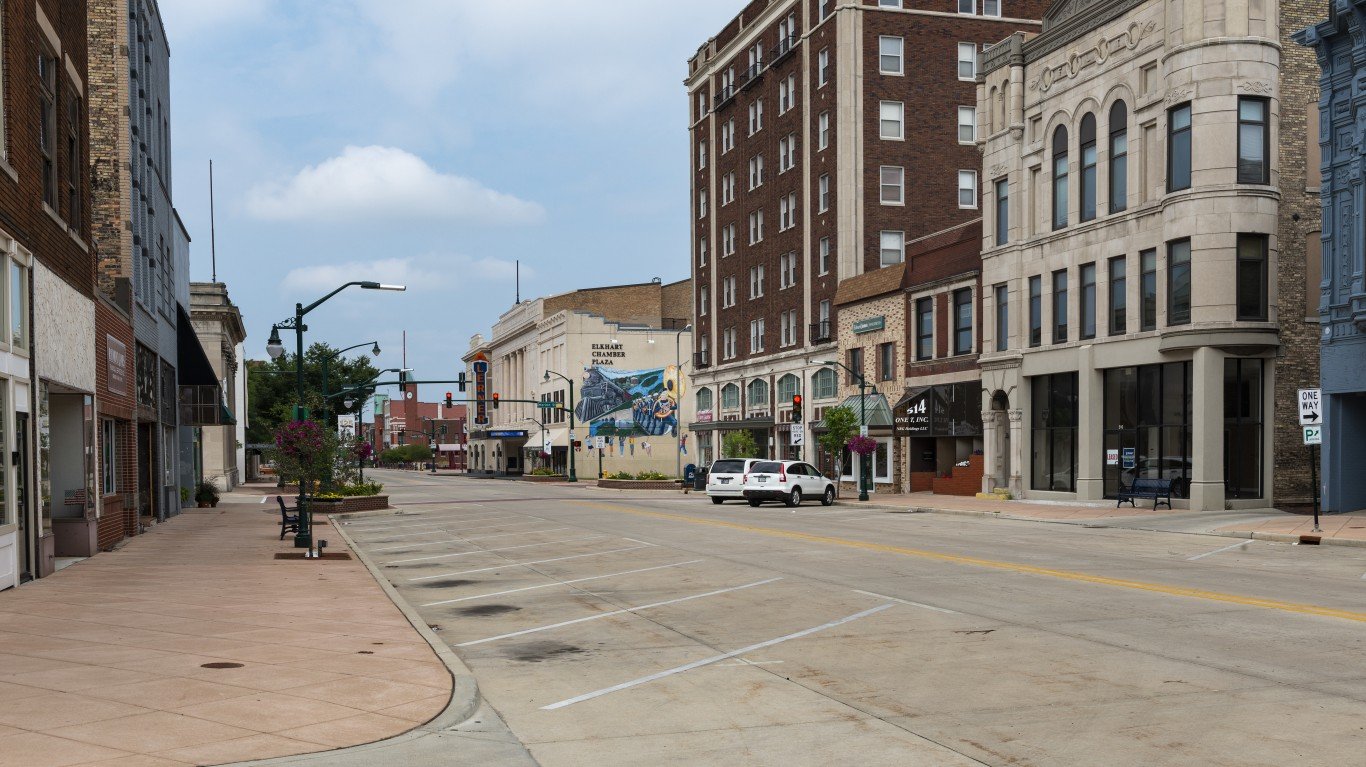
1. Elkhart-Goshen, IN
> Inflation adjusted per capita income, 1959: $16,545 (32 of 380)
> Inflation adjusted per capita income, 2018: $25,694 (319 of 380)
> Population change, 1959-2018: +92.5% (106,790 to 205,560)
> Unemployment rate, 2018: 2.6%
The U.S. Office of Management and Budget classifies Elkhart County, Indiana, as the Elkhart-Goshen metropolitan area. That county was not considered an official metropolitan area 50 years ago, but if it had been, it would have ranked as one of the wealthiest in the country. Elkhart County had an inflation-adjusted per capita income of $16,545, which ranked 32nd out of the 380 metropolitan areas with available data. By 1969, it ranked 24th overall. But Elkhart’s income remained relatively stagnant while the rest of the country improved, and as of 2018 it ranked 319th.
Unlike some other former heavy industry hubs, the Elkart area is still known for its manufacturing operations — the city calls itself “the RV capital of the World.”
Methodology
To determine the American cities that went from rich to poor, 24/7 Wall St. calculated per capita income for all U.S. metropolitan statistical areas in 1959 and 2018. For this list, cities were ranked based on the change in rank relative to all metropolitan areas from 1959 to 2018. We also calculated the change in income for all MSAs between those years. All metropolitan areas with real per capita incomes in 1959 below the national figure were excluded from our analysis.
Data on per capita income in 1959 at the county level came from the U.S. Census Bureau and was aggregated to the metropolitan area level using geographic boundary definitions for April 2018 from the Census Bureau and population data from the Census Bureau’s 1960 decennial census. Income data for 1959 was adjusted for inflation to 2018 dollars using cost of living data from the Bureau of Labor Statistics’ Consumer Price Index Research Series. Data on per capita income at the metropolitan level in 2018 came from the U.S. Census Bureau’s American Community Survey. Data on unemployment for 2018 came from the Bureau of Labor Statistics’ Local Area Unemployment Statistics program.
The income estimates for the metro areas on this list are for the counties that currently make up the metropolitan areas based on today’s U.S. Office of Management and Budget definitions, and in some cases these were not official metropolitan areas 50 years ago, although the cities that make them up were present. All references to population and income statistics in this piece for previous decades are for the counties that make up the current definition of the metropolitan area, and not the boundaries of the metropolitan area at the time.
Contact [email protected] for any questions or corrections.