One of the largest and most developed countries in the world, the United States is also one of the worst polluters globally. The U.S. remains one of the world’s top greenhouse gas emitters — currently behind China and India in total annual emissions — but it continues to lead all nations except China in cumulative historical output. According to the Environmental Protection Agency, U.S. greenhouse gas emissions were about 6.34 billion metric tons of CO₂-equivalent in 2022, and 2023 data showed a modest decline. Electricity generation accounted for roughly 22% of U.S. greenhouse gas emissions in 2023 — down from about 25% in 2022 — thanks to the continuing decline of coal.
With climate change ranking as a leading global threat, many countries are taking action to reduce emissions. In the United States, past President Joe Biden had set a goal of achieving a 100% clean electricity grid by 2035 — largely by cutting U.S. dependence on dirty power sources, like coal, and increasing our reliance on clean, renewable sources.
Coal-fired power generation in the U.S. fell by roughly 47% between 2014 and 2023, from 1.58 billion megawatt-hours in 2014 to 828 million megawatt-hours in 2023. Over the same period, electricity production from wind and solar farms nearly tripled, rising from about 200 million MWh in 2014 to roughly 660 million MWh in 2023. The shift has had a meaningful impact, as emissions from electric power generation have fallen by roughly one-third in the U.S. since 2014, according to the U.S. Energy Information Administration.
The federal government has a long way to go to achieve its ambitious energy goals, and doing so will require the cooperation of states. Every state has broad authority over its power grid — and policies are often a product of a given state’s unique climate, geography, and natural resource availability. Partially as a result, some states are doing far more to reduce the climate impact of their power grid than others.
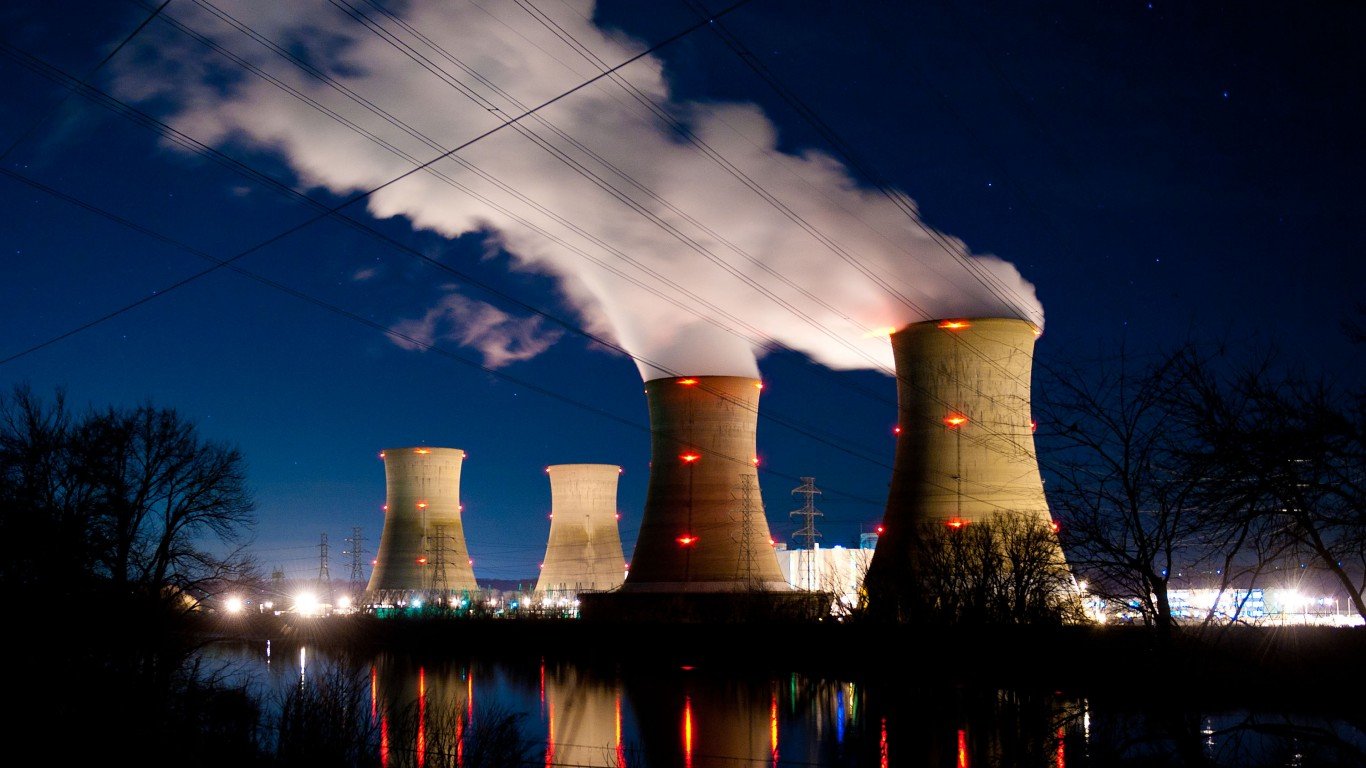
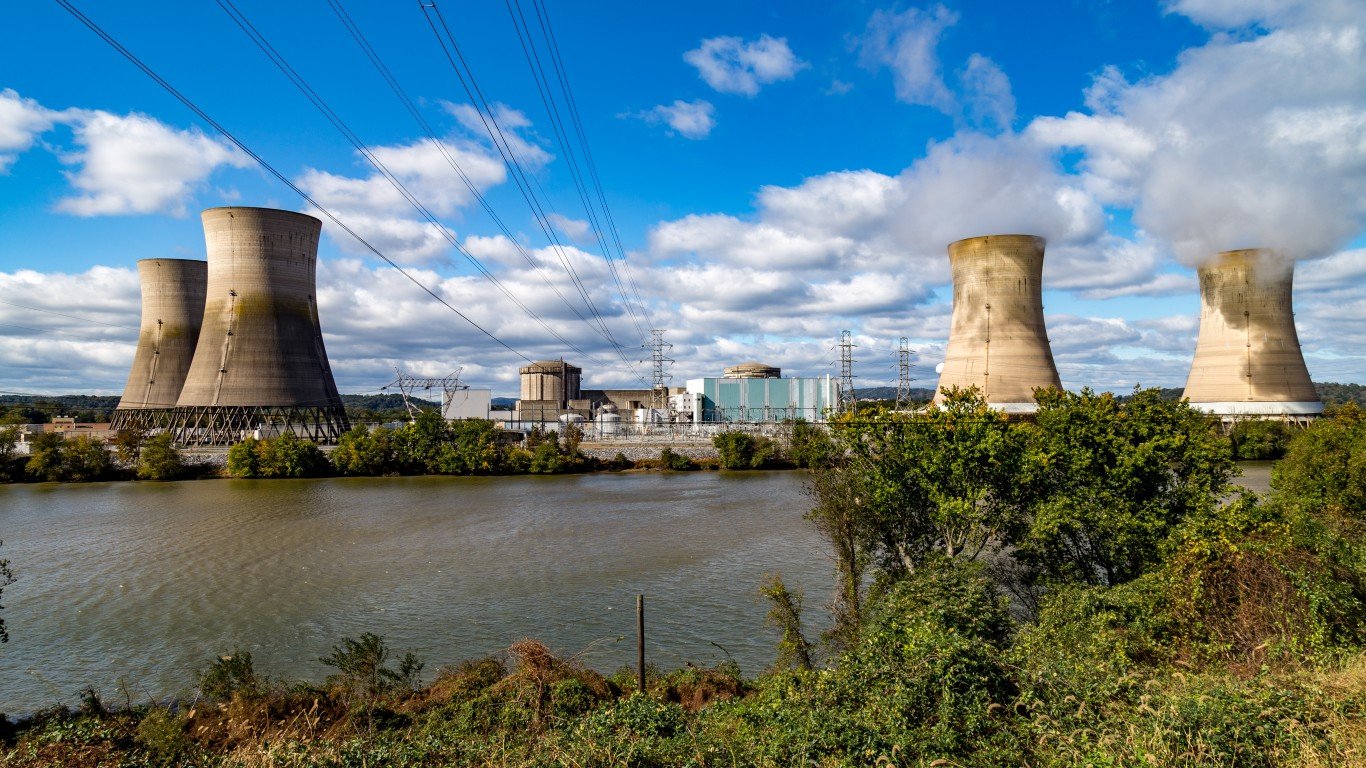
Among the 50 states, Illinois stands out for generating the most electricity with nuclear power plants. Unlike power plants that burn fossil fuels, nuclear plants do not generate harmful greenhouse gas emissions while operating. Nuclear plants also generate power more efficiently than fossil fuel plants or solar and wind farms and can generate far more electricity in a smaller physical space. However, because of the presence of radioactive materials, each nuclear plant presents a risk of widespread air and water contamination and therefore requires stringent building codes and highly skilled operators. Nuclear facilities also generate waste that can remain radioactive for thousands of years, necessitating highly regulated transportation and storage protocols for safe disposal.
Home to multiple facilities, including the Braidwood, Byron, and Clinton Nuclear Power Plants, as well as the Dresden, La Salle, and Quad Cities Generating Stations, Illinois is a national leader in nuclear energy, producing 97.6 million megawatt-hours of electricity in 2023 alone — over half of the state’s total energy mix. Despite its heavy reliance on nuclear energy, Illinois’ coal and gas plants keep its per capita electricity emissions above the national average — though not among the top 10 most polluting states.
This is how Illinois generates electricity — and how much pollution its power grid generates. Electricity output is measured in megawatt-hours, and harmful gas emissions are measured in metric tons. For context, a single megawatt-hour is enough to power an average American home for just over a month, and a metric ton is equal to about 2,205 pounds. All data is from the EIA.
*Full EPA data for 2024 is not yet available*
This post was updated on October 8, 2025 to clarify coal production drop, India’s status as the leading greenhouse gas emitter, wind/solar growth, Illinois’ status regarding electricity emissions, and pump storage capacity.
Why It Matters
Electricity production is one of the heaviest polluting sectors in the United States. As demand for electricity continues to rise, much of the country is transitioning away from fossil fuels and toward clean and renewable energy sources. Illinois generates the bulk of its electric power from nuclear reactors, which do not emit harmful gasses. However, the state also remains heavily dependent on fossil-fuel burning plants.
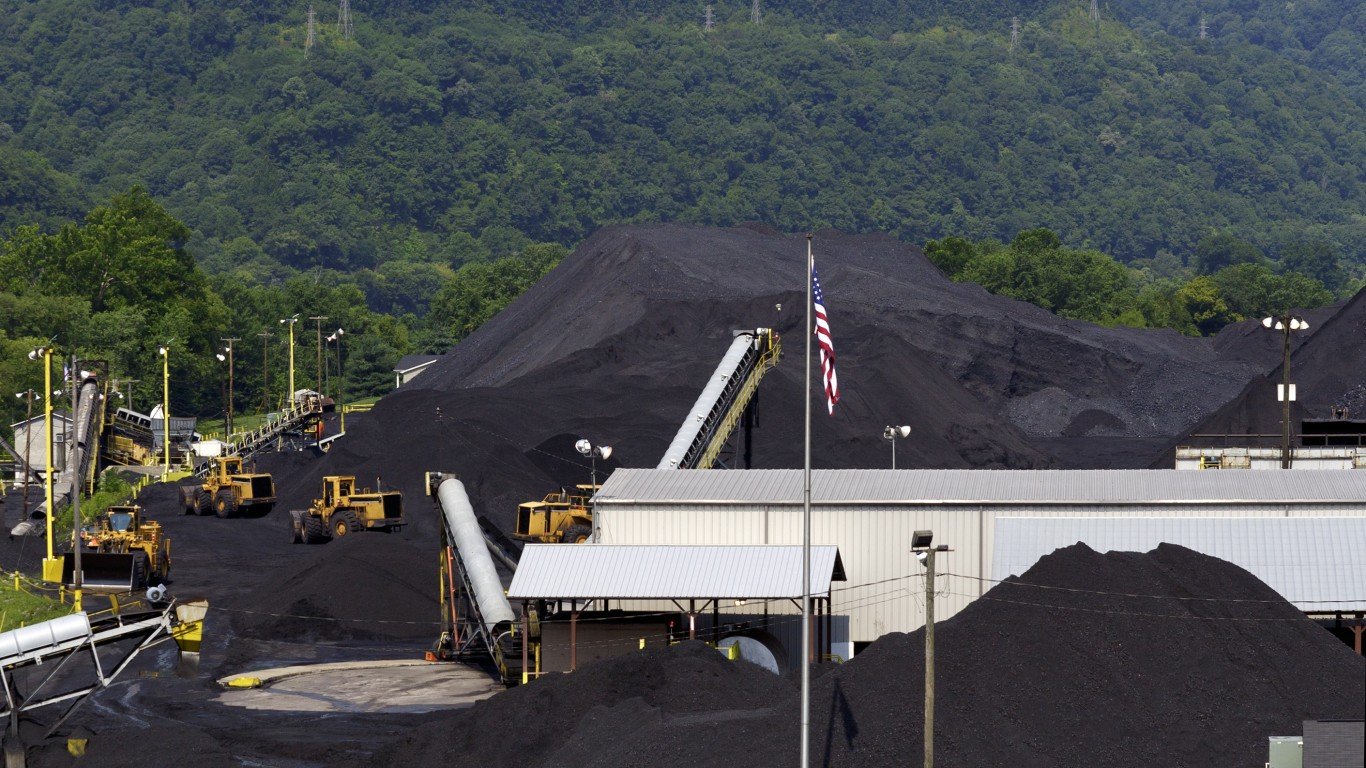
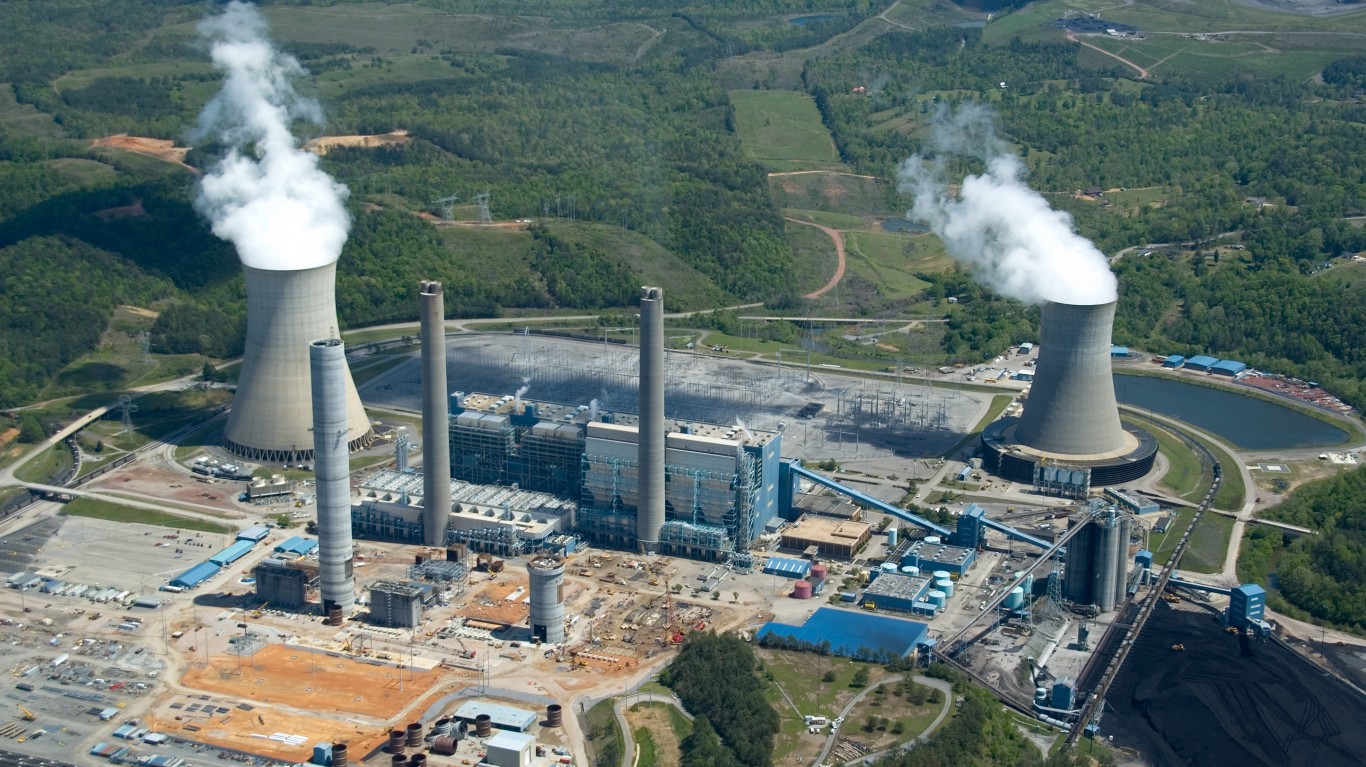
Coal
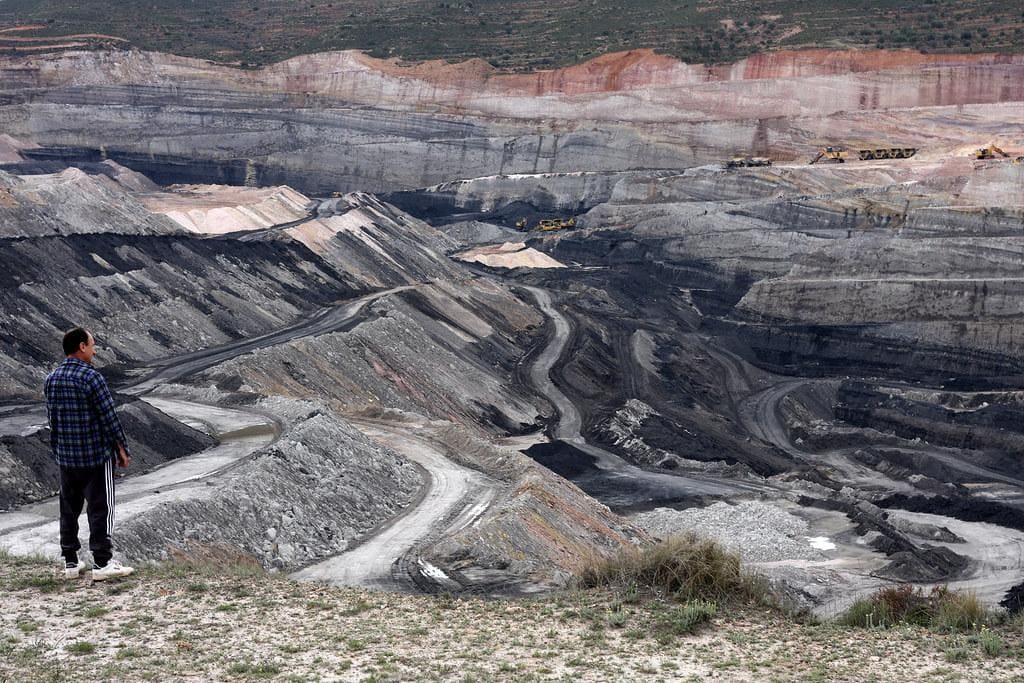
- Net-electricity production in 2023: 27.1 million megawatt-hours
- Coal as share of Illinois’ power grid: 15.28% of net-electricity production
- Harmful gas emissions from coal in 2022: Coal-fired power plants in Illinois emitted about 44.5 million metric tons of CO₂ in 2022, along with smaller quantities of NOₓ and SO₂.
- Coal as share of harmful gas emissions from electricity production in Illinois: 82.62%
- Illinois’ coal infrastructure in 2023: 22 generators, 9 facilities
Hydroelectric
- Net-electricity production in 2023: 92,063 megawatt-hours
- Hydroelectric as share of Illinois’ power grid: 0.05% of net-electricity production
- Harmful gas emissions from hydroelectric in 2022: None
- Hydroelectric as share of harmful gas emissions from electricity production in Illinois: 0%
- Illinois’ hydroelectric infrastructure in 2023: 25 generators, 8 facilities
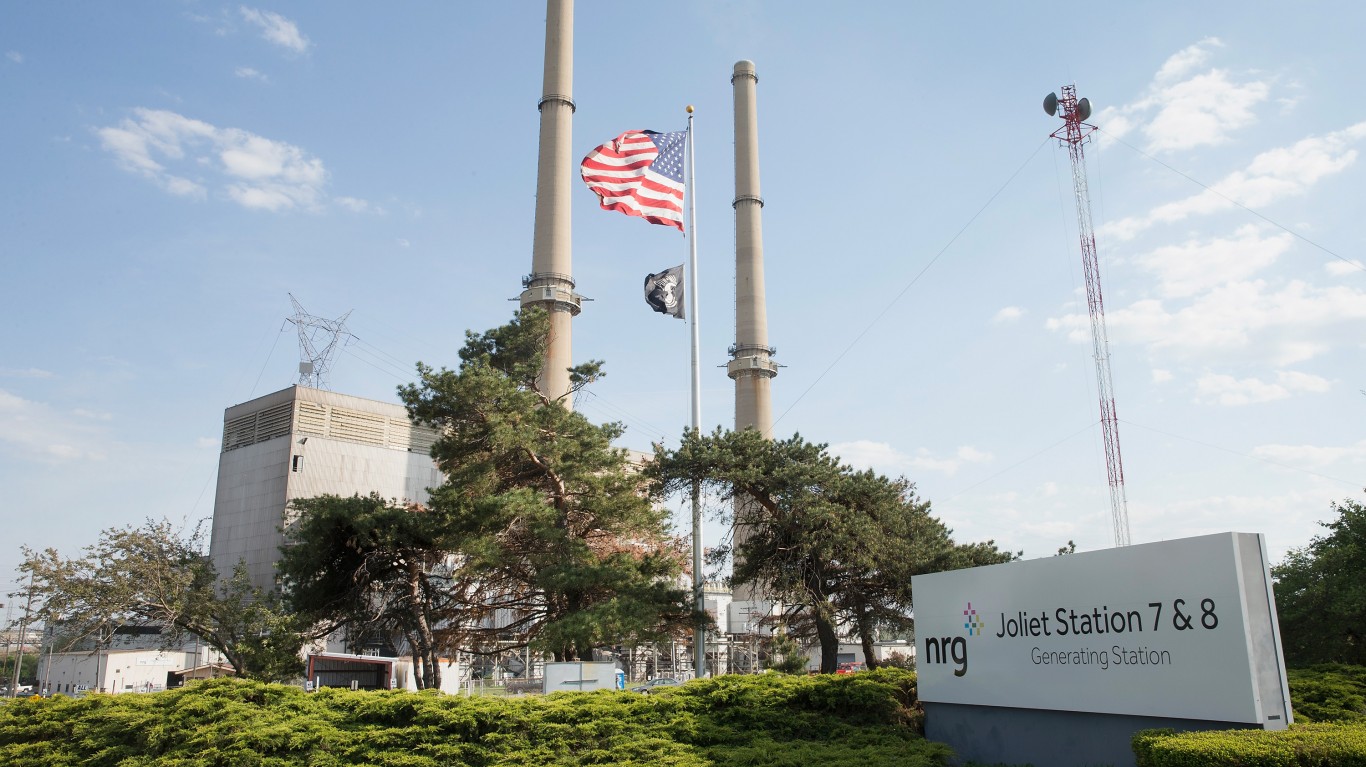
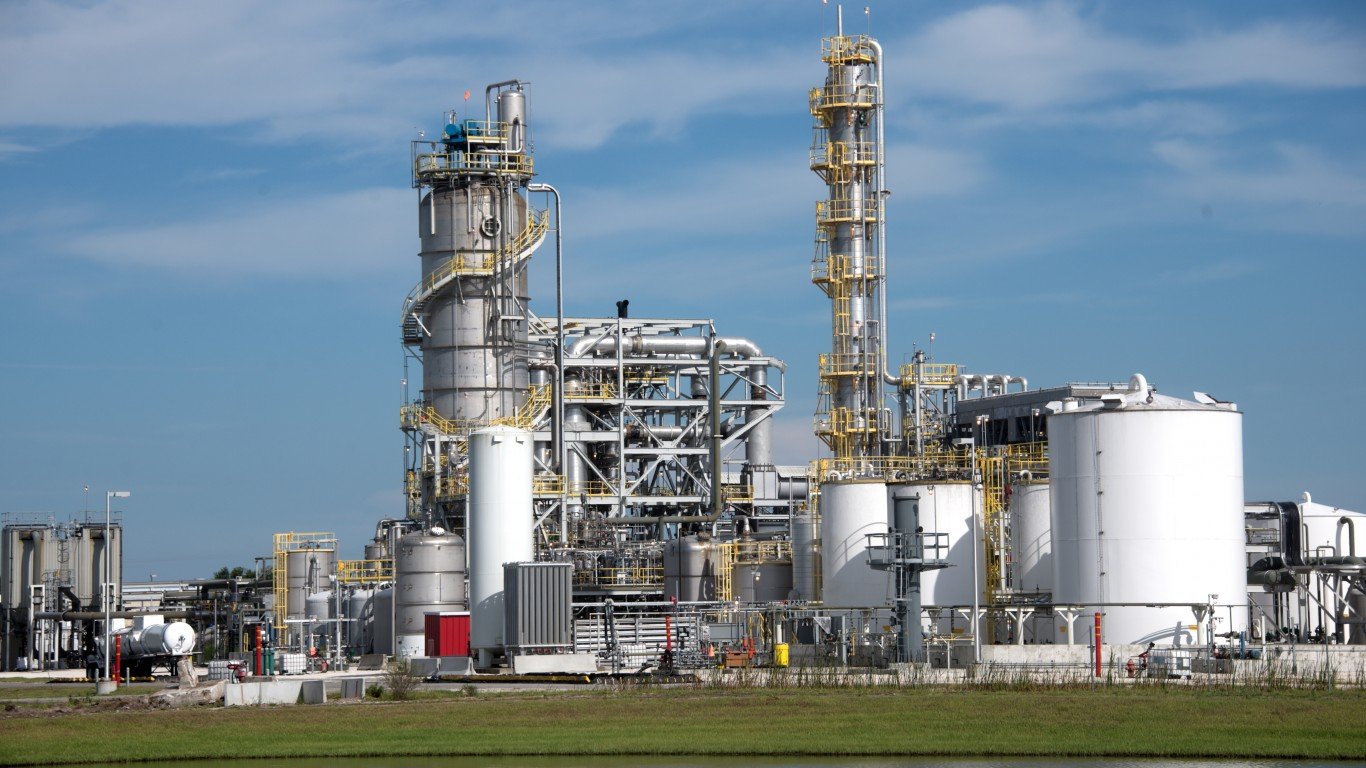
Natural gas
- Net-electricity production in 2023: 28.4 million megawatt-hours
- Natural gas as share of Illinois’ power grid: 16.00% of net-electricity production
- Harmful gas emissions from natural gas in 2022: 9.3 million metric-tons of nitric oxide, nitrogen dioxide, carbon dioxide, and sulfur dioxide
- Natural gas as share of harmful gas emissions from electricity production in Illinois: 17.31%
- Illinois’ natural gas infrastructure in 2023: 298 generators, 75 facilities
Nuclear
- Net-electricity production in 2023: 97.6 million megawatt-hours
- Nuclear energy as share of Illinois’ power grid: 54.89% of net-electricity production
- Harmful gas emissions from nuclear energy in 2022: None
- Nuclear energy as share of harmful gas emissions from electricity production in Illinois: 0%
- Illinois’ nuclear energy infrastructure in 2023: 11 generators, 6 facilities
Petroleum

- Net-electricity production in 2023: 26,288 megawatt-hours
- Petroleum as share of Illinois’ power grid: 0.01% of net-electricity production
- Harmful gas emissions from petroleum in 2022: 36,809 metric-tons of nitric oxide, nitrogen dioxide, carbon dioxide, and sulfur dioxide
- Petroleum as share of harmful gas emissions from electricity production in Illinois: 0.07%
- Illinois’ petroleum infrastructure in 2023: 176 generators, 37 facilities
Pumped storage
- Net-electricity production in 2023: None
- Pumped storage as share of Illinois’ power grid: 0% of net-electricity production
- Harmful gas emissions from pumped storage in 2022: None
- Pumped storage as share of harmful gas emissions from electricity production in Illinois: 0%
- Illinois’ pumped storage infrastructure in 2023: No net production (Illinois has minimal pumped-storage capacity, but it did not record significant generation from these facilities in 2023).
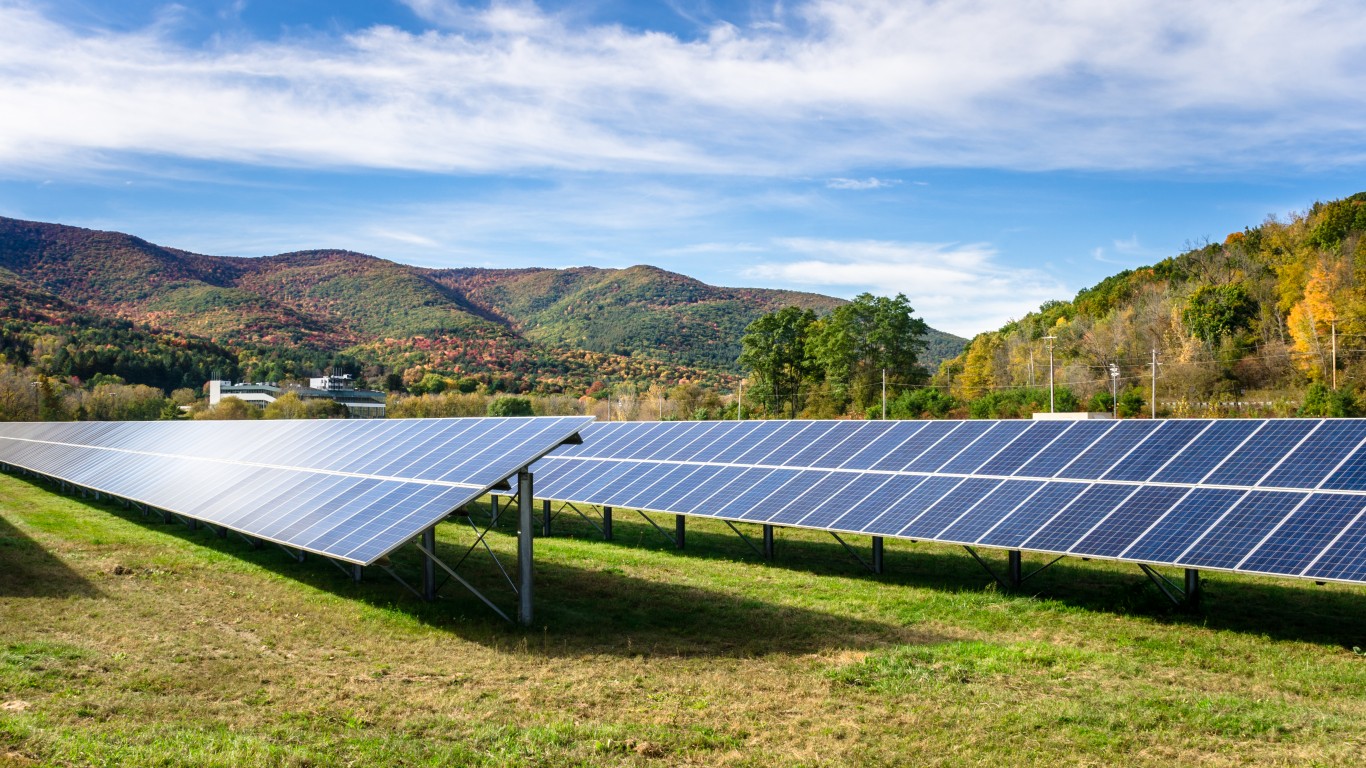
Solar (thermal and photovoltaic)
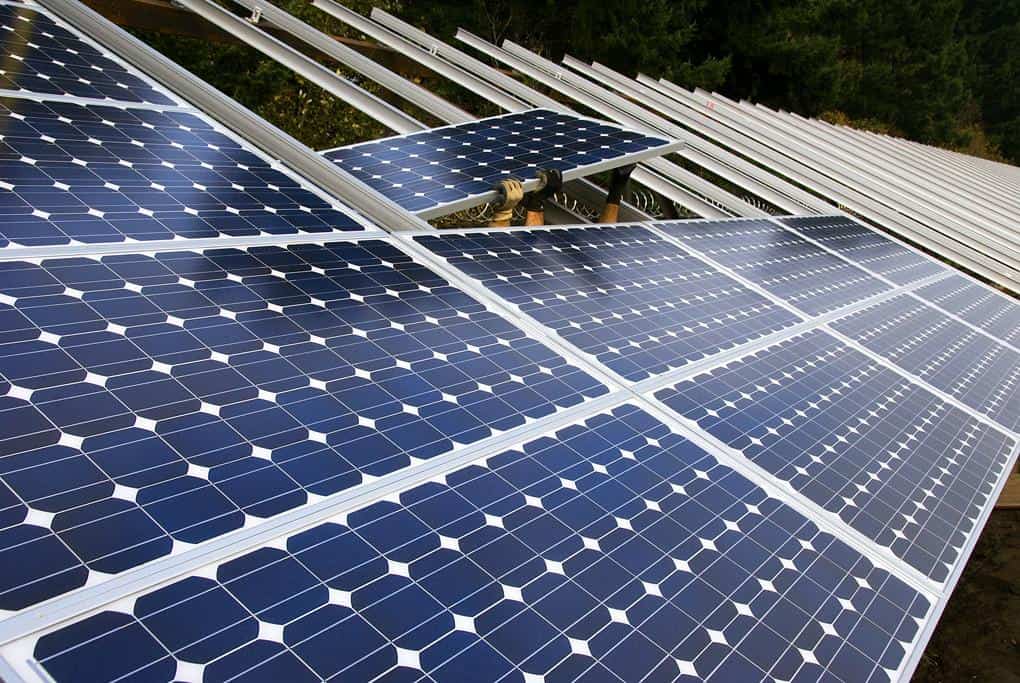
- Net-electricity production in 2023: 1.9 million megawatt-hours
- Solar as share of Illinois’ power grid: 1.08% of net-electricity production
- Harmful gas emissions from solar in 2022: None
- Solar as share of harmful gas emissions from electricity production in Illinois: 0%
- Illinois’ solar infrastructure in 2023: 153 generators, 150 facilities
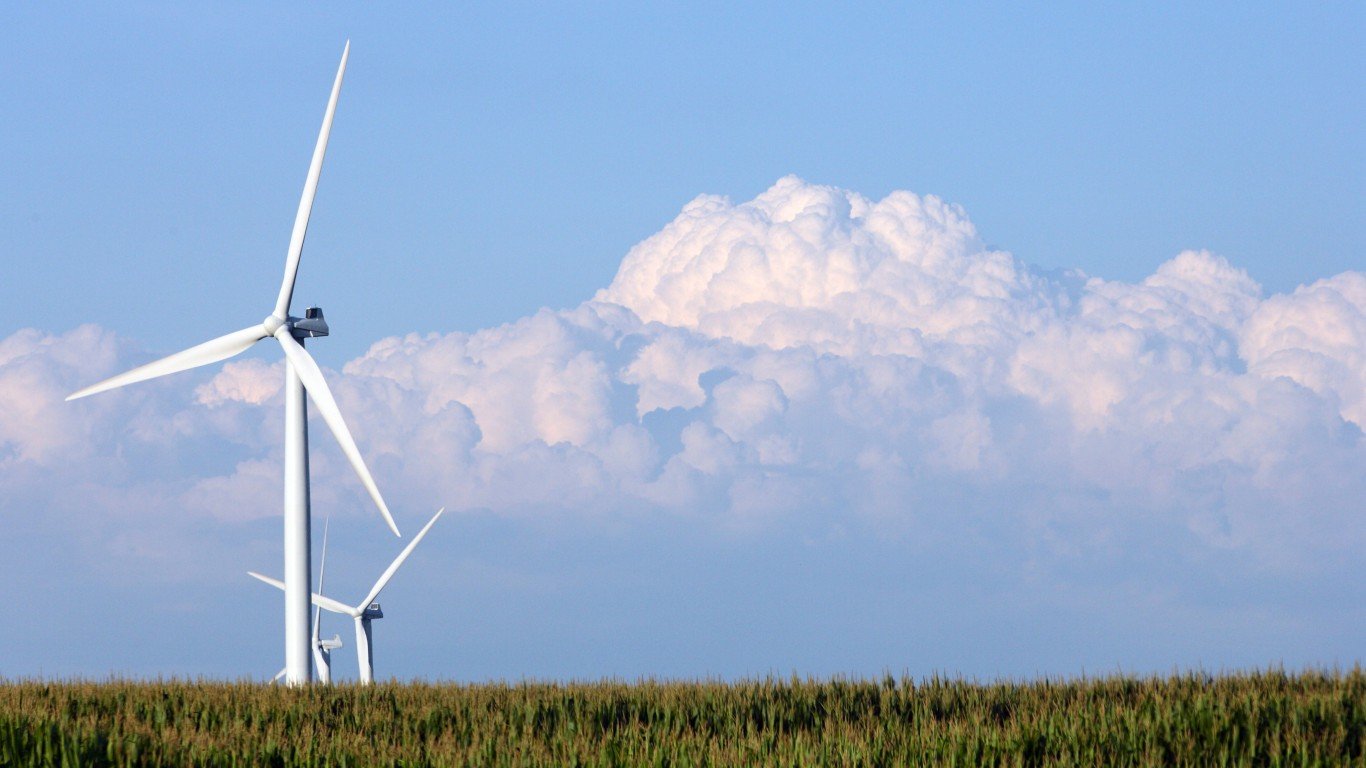
Wind
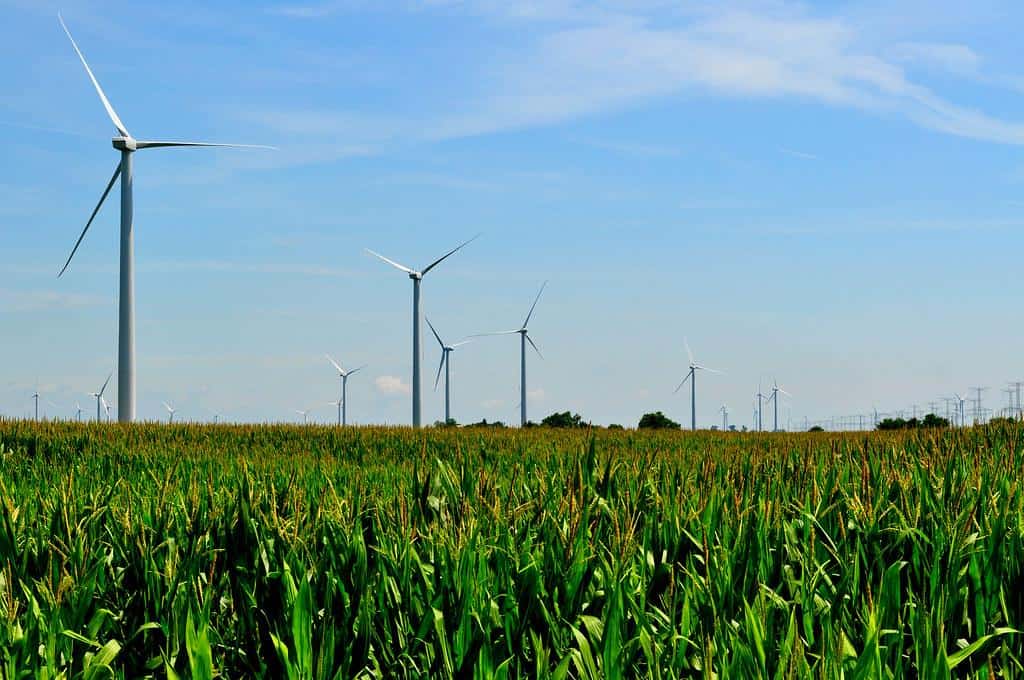
- Net-electricity production in 2023: 21.8 million megawatt-hours
- Wind as share of Illinois’ power grid: 12.27% of net-electricity production
- Harmful gas emissions from wind in 2022: None
- Wind as share of harmful gas emissions from electricity production in Illinois: 0%
- Illinois’ wind infrastructure in 2023: 60 generators, 55 facilities
Wood and wood derived fuels
- Net-electricity production in 2023: None
- Wood fuels as share of Illinois’ power grid: 0% of net-electricity production
- Harmful gas emissions from wood fuels in 2022: None
- Wood fuels as share of harmful gas emissions from electricity production in Illinois: 0%
- Illinois’ wood fuels infrastructure in 2023: None
Other biomass (incl. agricultural byproducts, landfill gas, and sludge waste)
- Net-electricity production in 2023: 242,251 megawatt-hours
- Other biomass as share of Illinois’ power grid: 0.14% of net-electricity production
- Harmful gas emissions from other biomass in 2022: 2,114 metric-tons of nitric oxide, nitrogen dioxide, carbon dioxide, and sulfur dioxide
- Other biomass as share of harmful gas emissions from electricity production in Illinois: 0%
- Illinois’ other biomass infrastructure in 2023: 32 generators, 12 facilities
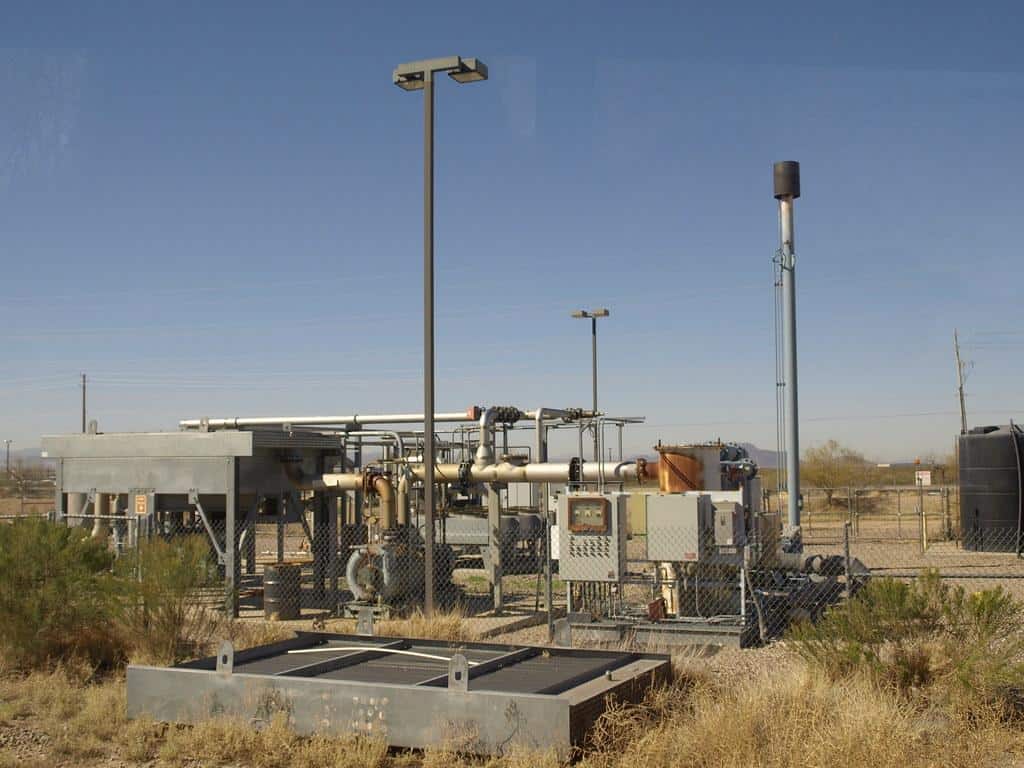
Other gasses (incl. propane, blast furnace gas, and waste gas from fossil fuels)
- Net-electricity production in 2023: 248,088 megawatt-hours
- Other gasses as share of Illinois’ power grid: 0.14% of net-electricity production
- Harmful gas emissions from other gasses in 2022: 139 metric-tons of nitric oxide, nitrogen dioxide, carbon dioxide, and sulfur dioxide
- Other gasses as share of harmful gas emissions from electricity production in Illinois: 0%
- Illinois’ other gasses infrastructure in 2023: 3 generators, 1 facility
All other (incl. municipal solid waste, batteries, chemicals, and hydrogen)
- Net-electricity production in 2023: 256,114 megawatt-hours
- All other sources as share of Illinois’ power grid: 0.14% of net-electricity production
- Harmful gas emissions from all other sources in 2022: 291 metric-tons of nitric oxide, nitrogen dioxide, carbon dioxide, and sulfur dioxide
- All other sources as share of harmful gas emissions from electricity production in Illinois: 0%
- Illinois’ all other sources infrastructure in 2023: 7 generators, 6 facilities
All sources

- Net-electricity production in 2023: 177.7 million megawatt-hours
- Harmful gas emissions from all sources in 2022: 53.9 million metric-tons of nitric oxide, nitrogen dioxide, carbon dioxide, and sulfur dioxide
- Illinois’ all sources infrastructure in 2023: 787 generators, 341 facilities
Contact [email protected] for any questions or corrections.