24/7 Wall St. Insights
- A new climate report from Ember brings good news
- State governments have broad discretion over their energy policy, while some are prioritizing emissions reduction, others remain heavily dependent on fossil fuels.
- Currently, Kentucky does not stand out as a leader in the transition to clean energy.
- Also: 2 Dividend Legends to Hold Forever
A new report from the climate think-tank Ember reveals that in the first half of 2025 the world’s wind and solar farms generated more electricity than coal plants for the first time. Solar output surged nearly 30% year-on-year and met 83% of global electricity demand growth. China and India led the transition, helping drive a drop in fossil-fuel use. Unfortunately, slower renewables growth and rising demand still pushed up coal and gas generation in the U.S. and Europe.
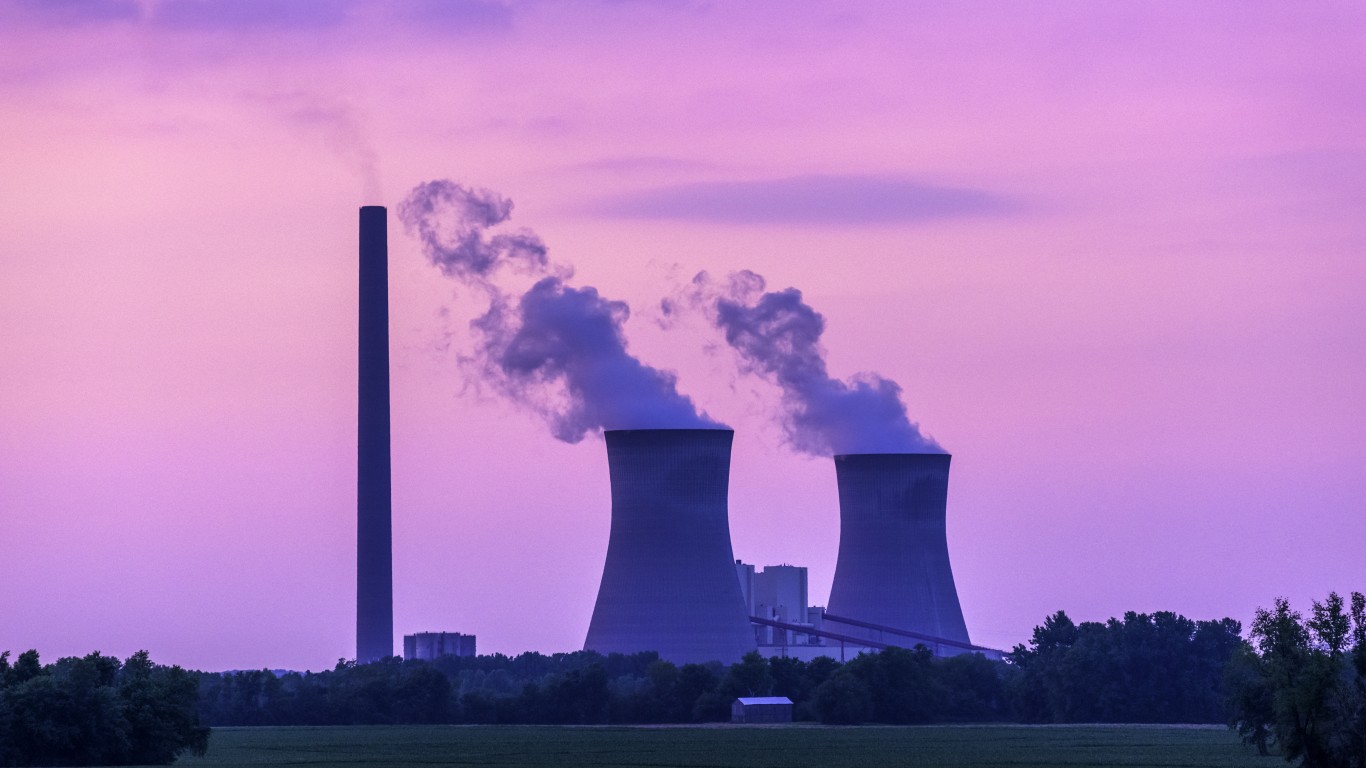
The United States is one of the heaviest polluters in the world, and electric power generation is one of America’s heaviest polluting sectors. According to the Environmental Protection Agency, the U.S. emitted over 6.3 billion metric tons of harmful greenhouse gasses in 2022, more than every other country except China — and 25% of those emissions were created by electricity production.
With climate change emerging as a leading global threat, many countries are taking action to reduce emissions. In the United States, Biden had previously set a goal of achieving a 100% emissions-free power grid by 2035 — largely by cutting U.S. dependence on dirty power sources, like coal, and increasing our reliance on clean, renewable sources. (Here is a look at 11 American companies on the cutting edge of renewable technology.)
In the continuation of a longer-term trend, the amount of electricity produced in coal-fired power plants has fallen by over 57% in the United States over the last 10 years, from 1.6 billion megawatt-hours in 2014 to 675.1 million megawatt-hours in 2023. Over the same period, electricity production from wind and solar farms nearly tripled, from 199.3 million megawatt-hours to 586.7 megawatt-hours. The shift has had a meaningful impact, as emissions from electric power generation have fallen by nearly 24% in the U.S. since 2014, according to the U.S. Energy Information Administration.
The federal government has a long way to go to achieve its ambitious energy goals, and doing so will require the cooperation of states. Every state has its own climate, geography, and natural resources — as well as broad authority over energy policy. Given these variables, some states are doing far more to reduce the climate impact of their power grid than others. (Here is a look at the states where carbon emissions are skyrocketing.)
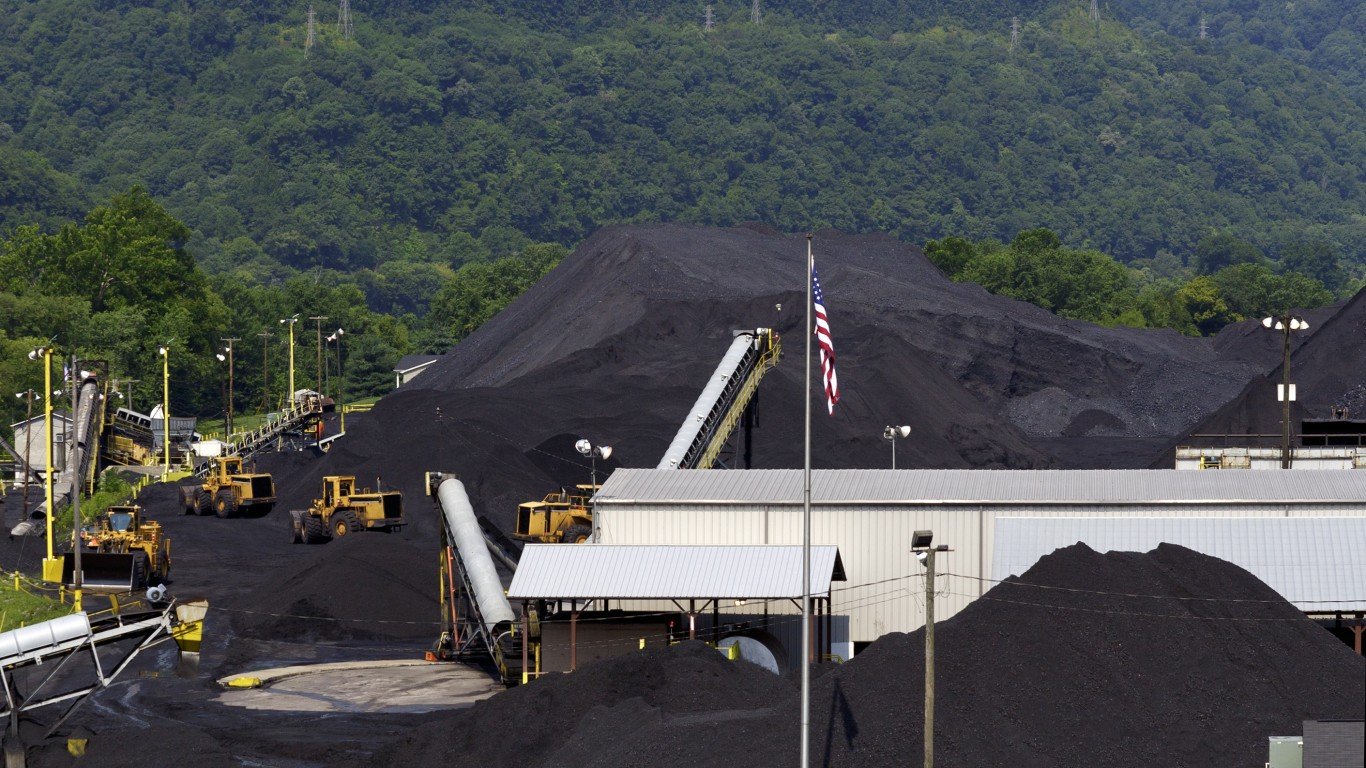
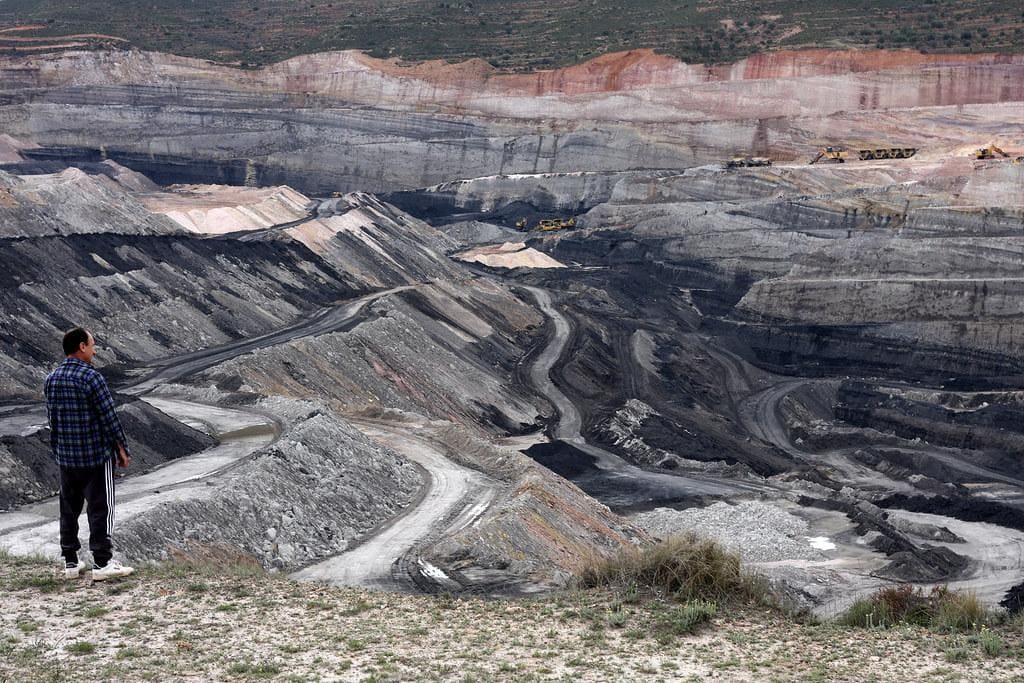
Among the 50 states, Kentucky stands out for its continued dependence on coal. Nationwide, coal accounts for only about 16% of electricity production and over half of all harmful gas emissions from the electric power sector.
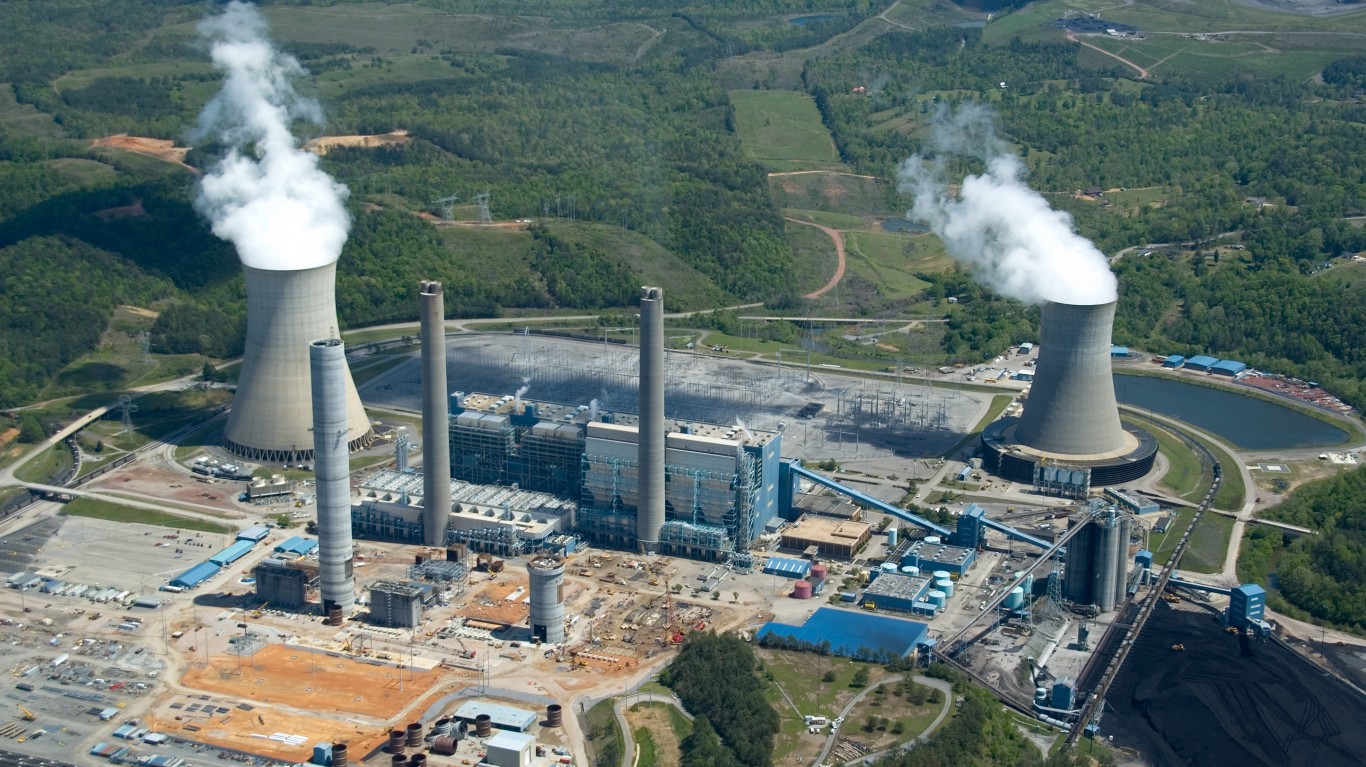
Kentucky is the fifth largest coal-producing state in the country, and partially as a result, the state is one of only a handful nationwide where coal-fired plants account for over half of all electricity production. About 69% of the 63.2 million megawatt-hours of energy produced in Kentucky in 2023 came from coal-fired plants. Additionally, nearly 86% of the state’s 47.2 million metric tons in harmful power grid emissions in 2022 were created by coal.
This is how Kentucky generates electricity — and how much pollution its power grid produces. Electricity output is measured in megawatt-hours and harmful gas emissions are measured in metric tons. For context, a single megawatt-hour is enough to power an average American home for just over a month, and a metric ton is equal to about 2,205 pounds. All data is from the EIA.
This post was updated on October 25, 2025 to include news of Embers’ recent climate report.
Why It Matters
Electricity production is one of the heaviest polluting sectors in the United States. As demand for electricity continues to rise, much of the country is transitioning away from fossil fuels and toward clean and renewable energy sources to meet the Biden Administration’s climate change mitigation goals. Like many other resource rich states, Kentucky continues to rely heavily on fossil-fuels — particularly coal.
Coal
- Net-electricity production in 2023: 43.4 million megawatt-hours
- Coal as share of Kentucky’s power grid: 68.73% of net-electricity production
- Harmful gas emissions from coal in 2022: 47.2 million metric-tons of nitric oxide, nitrogen dioxide, carbon dioxide, and sulfur dioxide
- Coal as share of harmful gas emissions from electricity production in Kentucky: 85.75%
- Kentucky’s coal infrastructure in 2023: 29 generators, 10 facilities
Hydroelectric

- Net-electricity production in 2023: 4.0 million megawatt-hours
- Hydroelectric as share of Kentucky’s power grid: 6.26% of net-electricity production
- Harmful gas emissions from hydroelectric in 2022: None
- Hydroelectric as share of harmful gas emissions from electricity production in Kentucky: 0%
- Kentucky’s hydroelectric infrastructure in 2023: 44 generators, 11 facilities
Natural gas

- Net-electricity production in 2023: 15.1 million megawatt-hours
- Natural gas as share of Kentucky’s power grid: 23.87% of net-electricity production
- Harmful gas emissions from natural gas in 2022: 7.7 million metric-tons of nitric oxide, nitrogen dioxide, carbon dioxide, and sulfur dioxide
- Natural gas as share of harmful gas emissions from electricity production in Kentucky: 13.95%
- Kentucky’s natural gas infrastructure in 2023: 58 generators, 15 facilities
Nuclear

- Net-electricity production in 2023: None
- Nuclear energy as share of Kentucky’s power grid: 0% of net-electricity production
- Harmful gas emissions from nuclear energy in 2022: None
- Nuclear energy as share of harmful gas emissions from electricity production in Kentucky: 0%
- Kentucky’s nuclear energy infrastructure in 2023: None
Petroleum

- Net-electricity production in 2023: 61,135 megawatt-hours
- Petroleum as share of Kentucky’s power grid: 0.10% of net-electricity production
- Harmful gas emissions from petroleum in 2022: 112,247 metric-tons of nitric oxide, nitrogen dioxide, carbon dioxide, and sulfur dioxide
- Petroleum as share of harmful gas emissions from electricity production in Kentucky: 0.20%
- Kentucky’s petroleum infrastructure in 2023: 7 generators, 1 facility
Pumped storage

- Net-electricity production in 2023: None
- Pumped storage as share of Kentucky’s power grid: 0% of net-electricity production
- Harmful gas emissions from pumped storage in 2022: None
- Pumped storage as share of harmful gas emissions from electricity production in Kentucky: 0%
- Kentucky’s pumped storage infrastructure in 2023: None
Solar (thermal and photovoltaic)
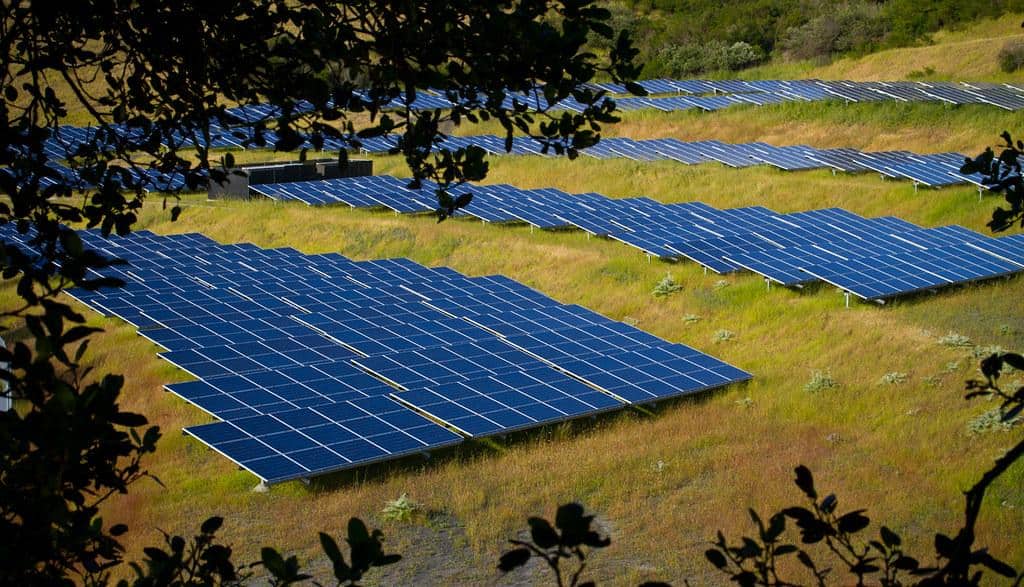
- Net-electricity production in 2023: 155,425 megawatt-hours
- Solar as share of Kentucky’s power grid: 0.25% of net-electricity production
- Harmful gas emissions from solar in 2022: None
- Solar as share of harmful gas emissions from electricity production in Kentucky: 0%
- Kentucky’s solar infrastructure in 2023: 10 generators, 10 facilities
Wind
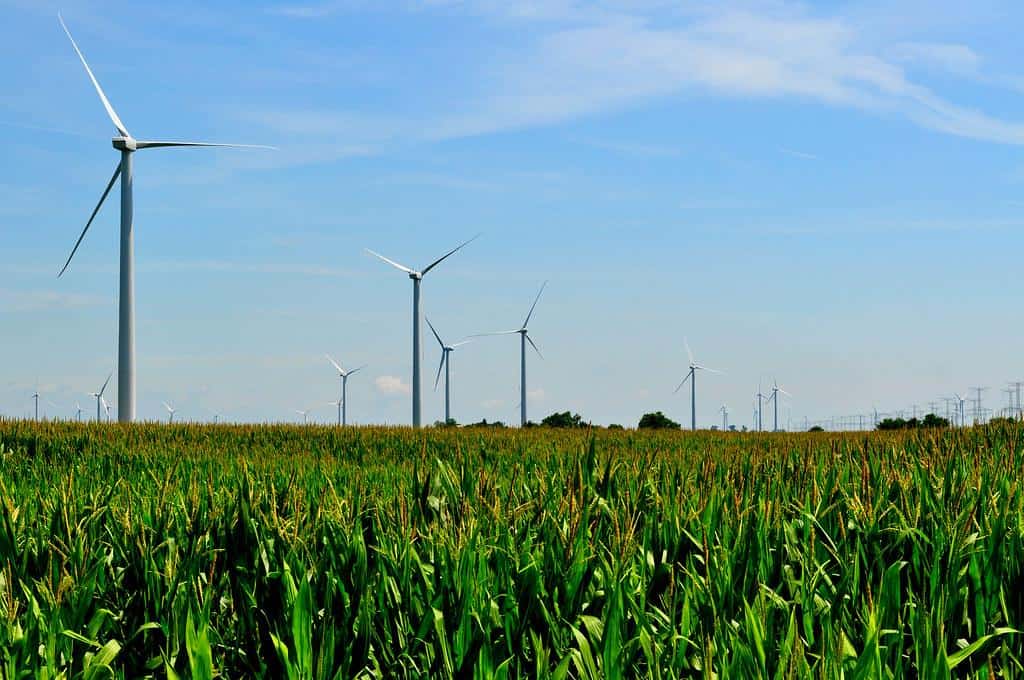
- Net-electricity production in 2023: None
- Wind as share of Kentucky’s power grid: 0% of net-electricity production
- Harmful gas emissions from wind in 2022: None
- Wind as share of harmful gas emissions from electricity production in Kentucky: 0%
- Kentucky’s wind infrastructure in 2023: None
Wood and wood derived fuels
- Net-electricity production in 2023: 328,770 megawatt-hours
- Wood fuels as share of Kentucky’s power grid: 0.52% of net-electricity production
- Harmful gas emissions from wood fuels in 2022: 3,733 metric-tons of nitric oxide, nitrogen dioxide, carbon dioxide, and sulfur dioxide
- Wood fuels as share of harmful gas emissions from electricity production in Kentucky: 0.01%
- Kentucky’s wood fuels infrastructure in 2023: 3 generators, 2 facilities
Other biomass (incl. agricultural byproducts, landfill gas, and sludge waste)
- Net-electricity production in 2023: 88,989 megawatt-hours
- Other biomass as share of Kentucky’s power grid: 0.14% of net-electricity production
- Harmful gas emissions from other biomass in 2022: 1,404 metric-tons of nitric oxide, nitrogen dioxide, carbon dioxide, and sulfur dioxide
- Other biomass as share of harmful gas emissions from electricity production in Kentucky: 0%
- Kentucky’s other biomass infrastructure in 2023: 20 generators, 8 facilities
Other gasses (incl. propane, blast furnace gas, and waste gas from fossil fuels)

- Net-electricity production in 2023: None
- Other gasses as share of Kentucky’s power grid: 0% of net-electricity production
- Harmful gas emissions from other gasses in 2022: None
- Other gasses as share of harmful gas emissions from electricity production in Kentucky: 0%
- Kentucky’s other gasses infrastructure in 2023: None
Other (incl. municipal solid waste, batteries, chemicals, and hydrogen)

- Net-electricity production in 2023: 91,123 megawatt-hours
- All other sources as share of Kentucky’s power grid: 0.14% of net-electricity production
- Harmful gas emissions from all other sources in 2022: 49,932 metric-tons of nitric oxide, nitrogen dioxide, carbon dioxide, and sulfur dioxide
- All other sources as share of harmful gas emissions from electricity production in Kentucky: 0.09%
- Kentucky’s all other sources infrastructure in 2023: None
All sources

- Net-electricity production in 2023: 63.2 million megawatt-hours
- Harmful gas emissions from all sources in 2022: 55.1 million metric-tons of nitric oxide, nitrogen dioxide, carbon dioxide, and sulfur dioxide
- Kentucky’s all sources infrastructure in 2023: 171 generators, 53 facilities
Contact [email protected] for any questions or corrections.