For two years, America was a home seller’s market that ended late in 2022. Owners were able to get several bids on their homes. They could even get buyers to waive inspections. This halted as home prices soared beyond what many could afford, and mortgage rates surged from 3% on a 30-year fixed-rate mortgage to 6%. Today, sellers in some markets have started to make concessions again. The playing field has become more even.
According to Realtor.com’s new study, “The Strange Game of Chicken Happening Between Homebuyers and Sellers: Who Will Blink First?”, it has been difficult for people to “meet in the middle” during a real estate transaction.
The study also points out that real estate prices rose so much that they remain too high in some markets, even if they have dropped moderately recently. This varies wildly from market to market.
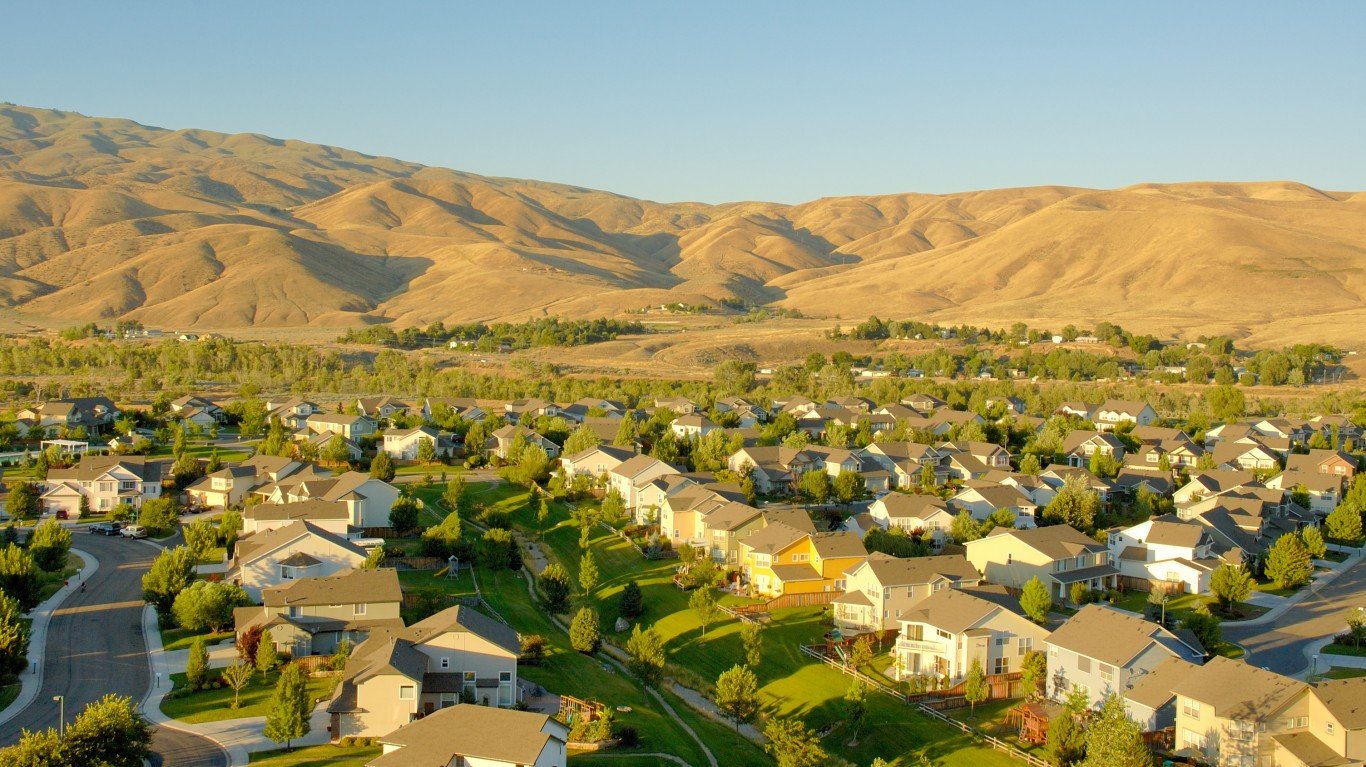
Prices shot up in some of the most desirable markets. Many of these were places people moved from the expensive metros on America’s two coasts. This was particularly true for people who left San Francisco, LA, and New York City. Boise’s home prices rose by 70% as it became popular for coastal area residents. For the same reason, they also soared in Phoenix and Tampa.
Bargaining will be easier in these popular destinations. No market can hold a 50% increase for long. Demand is muted at those levels when married to 6% mortgages.
“Chicken” is a word that does not apply everywhere. In some markets, however, it is a perfect description.
These are the cities with the most homes people shouldn’t live in.
Contact [email protected] for any questions or corrections.