Investing

Simple Cross-Market Momentum

From Mebane Faber of World Beta

Below I will present a simple quantitative method that exploits momentum in relative returns across a wide set of asset classes. The strategy is examined since 1972 in an allocation framework utilizing a combination of diverse and publicly traded asset class indices including US Stocks (S&P 500), Foreign Stocks (MSCI EAFE), Commodities (GSCI), REITs (NAREIT), Cash (90-Day Commercial Paper), and United States Government Bonds (10-Year Treasury Bonds).


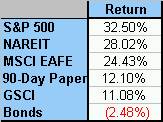
The most simple measure of momentum I can think of (and the one cited in the GS primer) is trailing 12-month absolute returns. To make matters even simpler, and improve the tax consequences, the system will only update once every year at year end. You begin with a simple ranking of absolute performance – the example to the right is year end 1980:

Your holdings for the next year would be ranked in that order, with US Stocks at the top, and Bonds at the bottom. How has this simple ranking performed? From 1973 (Had to use 1972 at the first year for ranking) through 2005, and equal weighted portfolio of the 6 asset classes above, rebalanced yearly would have returned a respectable 11.16% p.a.

However, as evidenced in the chart below, the top performing asset class (#1) had a one-year subsequent performance of 18.73%. Almost a doubling of annual return, albeit with much more volatility and a higher negative year. #2, #3 etc all represent the following years performance for the #2, #3 best ranked absolute performance. ie in 1980, the #3 best performer was foreign stocks (MSCI EAFE) at 24.43%. You would then be long MSCI EAFE in the #3 bucket for 1981. . .It is interesting to note that buckets 4-6 all underperform the portfolio, evidence of momentum on the downside as well.

If you can’t read the Table, here is a chart of the returns. . .While it is not the perfect stairstep down one would prefer, you do see the general trend of declining returns from bucket #1 to bucket #2.
Although 18.73% returns are spectacular, some investors might not be able to handle the risk involved in investing in only one asset class. The Top 2 and Top3 portfolios (holding the top 2 and top 3 asset classes, equally weighted) each outperform the benchmark (labelled "All" in the chart) on both an absolute and risk adjusted basis.

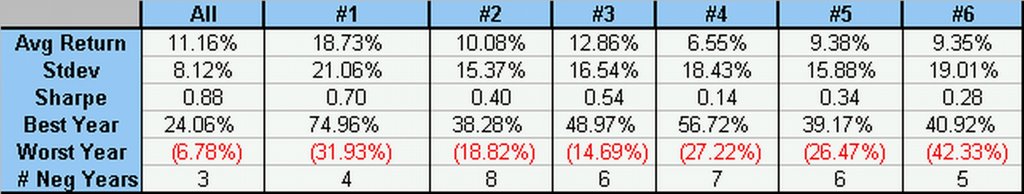
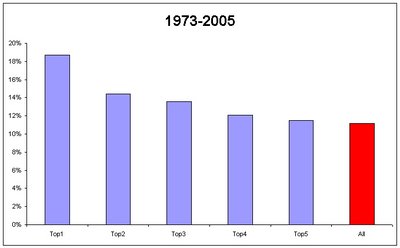
The optimum risk-adjusted portfolio is the Top 3 asset portfolio, returning over 250 bps more than the equal weighted with slightly higher volatility, and only 2 down years since 1973 – and a worst year of only -(3.64)%.

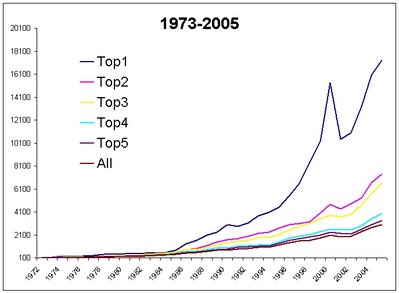
$100 invested in the 6 asset class portfolio would be worth $3003.03 year end 2005, while $100 invested in the Top1 strategy would be worth $17,333.15.

Example ETFs reflecting the asset classes discussed in article are:

Take This Retirement Quiz To Get Matched With A Financial Advisor (Sponsored)

Take the quiz below to get matched with a financial advisor today.

Each advisor has been vetted by SmartAsset and is held to a fiduciary standard to act in your best interests.

Here’s how it works:
1. Answer SmartAsset advisor match quiz
2. Review your pre-screened matches at your leisure. Check out the
advisors’ profiles.
3. Speak with advisors at no cost to you. Have an introductory call on the phone or introduction in person and choose whom to work with in the future

Take the retirement quiz right here.

Thank you for reading! Have some feedback for us?
Contact the 24/7 Wall St. editorial team.