[cnxvideo id=”506831″ placement=”ros”]With 2017 well underway, the investing community needs to consider what happened in 2016, and they need to consider beyond the Dow Jones Industrial Average (DJIA) hitting 20,000 for what may come ahead. The Dow rose 13.4% to 19,762.60 in 2016, outperforming a 9.5% rise in the S&P 500 and a 7.5% gain for the Nasdaq. This ended up being quite close to the 19,700 bull/bear projection from the start of 2016 — and now investors should consider why the same methodology is pointing to the Dow rising about 8.4% to 21,422.
What matters with the post-election rally at its sails on and the pro-business policies expected under a Trump presidency is that 2017 could be another solid year for equity investors. The DJIA bull-bear projection of 21,422 would be short of the preliminary look of 22,000 seen at the end of December, but another 8.4% gain likely would be more than welcome.
Investors are already expecting two or three rate hikes by the Federal Reserve in 2017. The 10-year Treasury went out with a yield of 2.44% in 2016, and the 30-year Treasury closed out 2016 with a yield of 3.06%. On the last day of 2015, the 10-year yield was 2.27% and the 30-year yield was 3.01%. Still, the lows of the year were 1.34% for the 10-year and 2.1% for the 30-year.
On top of tax reform and overseas cash repatriation, companies are expected to benefit from lower regulatory spending. All of this, along with an “America first” mentality, are expected to add up to higher earnings for companies in 2017. Also a climate is being set for higher dividends and continued share buybacks, if hundreds of billions of dollars were to magically be brought back into America.
One thing that ought to be kept in mind is that investors should not expect the post-election rally to continue in a straight line all year. That post-election rally was too big to ignore, but it is very likely that some of the gains for the start of 2017 were pulled into late 2016, based on how explosive that rally was. As a reminder, markets sold off steadily at the start of 2016 after the late 2015 gains stole from the coming year. At one point in early 2016, the S&P 500 Index was down far more than the 10% threshold to mark a correction. Also, a year ago it was the case that analysts were calling for S&P 500 earnings to rise almost 10%, only to find earnings remain flat. The S&P was also valued at roughly 17 times forward earnings at the end of 2016, a more lofty valuation than most investors would prefer.
[nativounit]
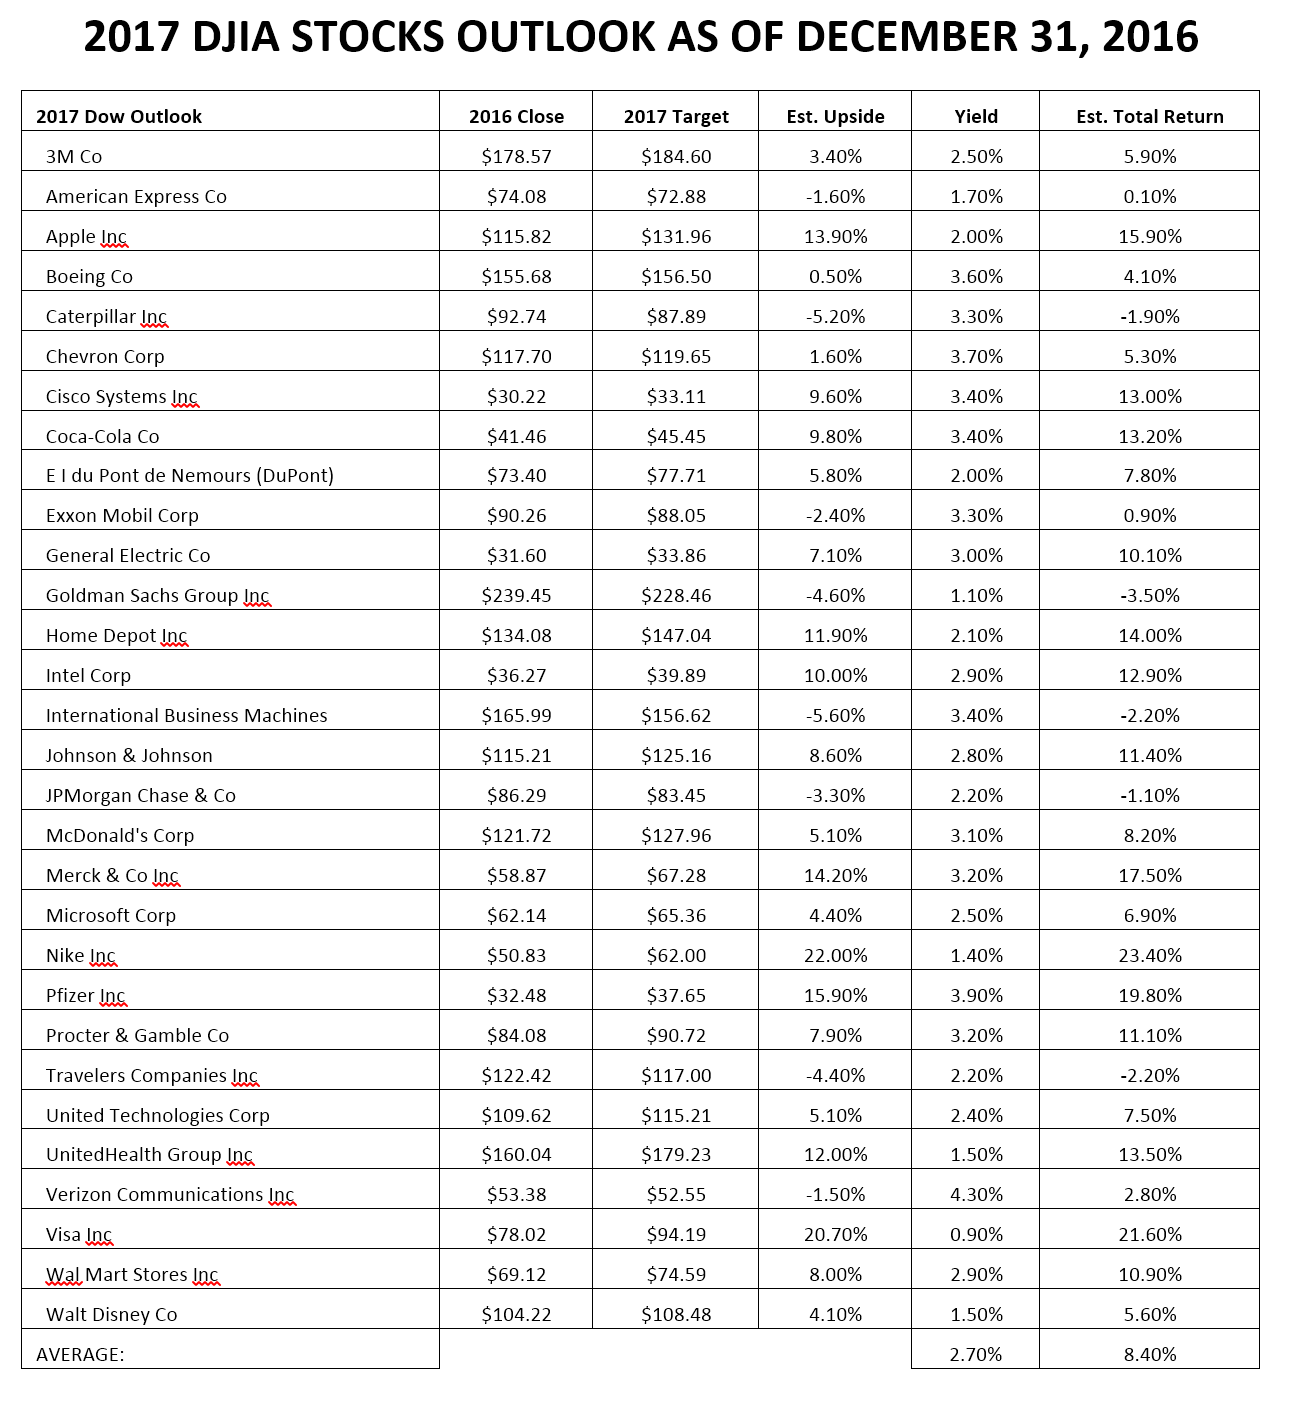
So, we are past the 19,700 mark, and Dow 20,000 may just be a mental line. This 21,422 Dow target for 2017 is derived using the 12-month price target consensus (mean) from Thomson Reuters using the bullish and bearish targets. We then add in the dividend yield at the end of each year, without considering dividend hikes expected in the coming year, for a snapshot total return calculation for each of the 30 Dow components. We then average out the expected total return of all 30 Dow components, without using the weighting of each component, and that is used to calculate the expected return. The assumption is that analysts will not get each Dow target right, but if you give them 30 tries and use an average then they can get their calls right.
Before getting into 8.4% projected upside for stocks, there are some risks that must be considered. First and foremost, the Dow’s rally from November 9 to December 30 was so large that it may have stolen some of 2017’s gains. Stocks tied to financial, energy, infrastructure and consumer goods rallied so much that some tempering of real upside expectations seems merited. Washington, D.C., also has a history of infighting that makes some of the upside in various proposed policy changes priced for perfection, and perfection and politics rarely is the outcome. Earnings growth could be short of expectations, and there are still mixed economic reports on just how strong growth can be. Is 3% to 4% GDP growth realistic over and over after seven years of recovery? Currency risk from a strong dollar and the poor economic trends of many key growth economies (China, Russia, India, Brazil and more) could also be a combined double-whammy for many of the top Dow stocks in 2017 as they are exporters and rely heavily on international opportunities.
24/7 Wall St. has featured nine of the 30 Dow stocks that should be the basis for propelling the Dow toward that 21,422 target in 2017. Not all of them are the highest weightings in the index, because the Dow uses a stock price-weighted methodology rather than a market cap weighted methodology used by more virtually all modern indexes. What needs to be considered is that these nine Dow components are representative of broader groups that should see their valuations bleed over into peers and rivals if they match the expected performance. These are the nine Dow stocks that will be needed to drive the Dow higher in 2016.
Apple
Shares of Apple Inc. (NASDAQ: AAPL) generated a return of 12.5% in 2016, with the stock ending the year at $115.82 a share. Apple’s consensus analyst target price of $131.96 at the end of 2016 would imply simple upside of 13.9%, but its 2.0% yield would make for an implied total return of 15.9%, if the analysts get 2017 more accurate than they predicted for 2016. Apple shares have a 52-week trading range of $89.47 to $118.69, and the market cap is $622 billion. The dividend yield is 1.9%.
Apple’s upside most likely will depend on the next iteration of the iPhone. That will come later in the year, and we would note that Apple’s upside expectation is far more muted in 2017 than it was for 2016.
Chevron
In 2016, Chevron Corp. (NYSE: CVX) rose 36%, and shares ended the year at $117.70. Its current consensus price target of $119.65 implies limited upside of roughly 1.7%. Chevron has a 52-week range of $75.33 to $119.00 and a market cap of $222 billion. Its dividend yield is 3.7%.
Chevron is of course not as large as rival Exxon Mobil, but Chevron has been more favored by investors of late on many fronts. An early departure by Rex Tillerson to become Secretary of State has also created some shuffling. Regardless of which is company preferred at any snapshot in time, the Trump policies are already pointing to much more pro-oil environment than what the last eight years saw.
[nativounit]
GE
General Electric Co. (NYSE: GE) generated just a 4.6% total return in 2016, and it closed at $31.60 a share on the last day of the year. The 12-month consensus price target is $33.86, and the $31.60 year-end price would imply upside of 7.1%. Then there is the 3% yield to consider, for an implied total return of just over 10%, if the analysts prove to be right. GE has a 52-week range of $27.10 to $33.00 and a market cap of $281 billion.
GE is the biggest of the three Dow conglomerates by market cap, but 3M and UTC outweigh it exponentially due to share price. GE still drives the cart, and more upside is going to be required here to drive the rest of the conglomerates in 2017 and beyond.
Goldman Sachs
If a 34.92% gain to close 2016 at $239.45 sounds impressive, the real kicker is that Goldman Sachs Group Inc. (NYSE: GS) shares ended 2016 over 60% higher from the post-Brexit lows in late June and early July. The consensus analyst target is calling for $234.23, actually implying a downside of 2.2% in 2017. The shares have a 52-week range of $138.20 to $245.57, and the market cap is $99 billion. The dividend yield is 1.1%.
Goldman Sachs is the King of the Dow, with more than an 8% weighting due to its $200 plus share price. It will need to show handy upside to its earnings in 2017, and investors are going to have to believe that its book value can rise even faster. It may not be a bank like JPMorgan, but this stock likely cannot have a poor performance in 2017 for the Dow to rise another 8.4%.
Home Depot
Ending at $134.08 a share on the last trading day in December, Home Depot Inc. (NYSE: HD) managed a total return of just 3.5% in 2016. All of that seems to have come from a rally late in the year. The consensus target price of $147.04 from Thomson Reuters is actually lower than it was 90 days earlier, but that implies price upside of 11.9%. Then the 2.1% dividend yield would make for a potential total return of 14% in 2017, if the analysts are right. Home Depot has a 52-week range of $109.62 to $139.00. The market cap is $164 billion, and its dividend yield is 2.0%.
Home Depot is perhaps the most important retailer in America right now — not because of the breadth, but because it focuses almost 100% on home-spending and is a key beneficiary of housing strength. If housing does not continue to recover, you would likely see it in Home Depot. Expectations remain that housing will be a driving force of the economy in 2017.
IBM
The dividend-adjusted return from International Business Machines Corp. (NYSE: IBM) was about 25.2% after closing at $165.99 in 2016. IBM’s consensus year-end analyst price target of $156.62 would imply that its shares actually are overvalued by 5.6% for 2017. Its 3.4% dividend yield would mitigate that implied total return in 2017 to a loss of just 2.2%, if the analysts have their ducks in a row here. Big Blue has a 52-week trading range of $116.90 to $169.95. The market cap is $158 billion.
IBM’s recovery in 2017 was long overdue. Still, its negatives remain in place as the core business erosion eats into the gains of growth initiatives. IBM could see upside from all the infrastructure orders needing outsourced IT services. A rise in IBM likely would allow other major tech stocks to get a rise in earnings multiple expansion as well. IBM may be hated by some analysts, but it almost has to participate in 2017 to signal all is well in technology. Don’t forget that Cisco, Intel, Microsoft and Apple are all tech stocks and Dow components.
Merck
Shares of Merck & Co. Inc. (NYSE: MRK) rose 15% to close 2016 at $58.87. Its consensus price target of $67.28 would imply 14.3% upside, but its 3.2% dividend yield would offer a total return opportunity of 17.5%, if the analysts have their 2017 calls accurate. The stock has a 52-week range of $47.97 to $65.46, and the market cap is $163 billion. The dividend yield is 3.1%, making it one of the 2017 Dogs of the Dow.
Merck really has been unable to get past a lot of woes. It offers a high yield but growth assumptions are meager ahead. Maybe further restructuring is needed, or maybe Merck needs a big merger to shake things up. This would also help Dow component Pfizer, and it would mean the D.C. drug price-pressure has largely abated. It just seems hard to imagine that the Dow’s rise could continue without Big Pharma participating.
Disney
Now Walt Disney Co. (NYSE: DIS) seems to be getting past the endless concerns about ESPN subscriber erosion. Expansion of the Star Wars universe is only going to further help Disney get back on track. Ditto all the other franchise films and merchandise around Marvel and others under Disney’s control. Its theme park business has been acting like it is almost recession-proof as well.
Disney managed to return just 0.67% for shareholders in 2016, with a $104.22 closing price on the last day of December. The $104.22 year-end price compared with a $108.48 consensus analyst target price, so investors could imply an expected upside of 4.1%. Then there is the 1.5% dividend yield to consider, after it was raised in 2016, for a potential total return of close to 5.6% expected in 2017. Disney shares have a 52-week range of $86.25 to $106.75, and the market cap currently is $166 billion.
UnitedHealth
In 2016, UnitedHealth Group Inc. (NYSE: UNH) generated a return of about 38% for shareholders, based on its $160.04 closing price on the last day of December. The consensus price target of $179.23 represents 12.0% upside in 2017, but the 1.5% dividend yield would take that implied total return up to 13.5%, if the analysts are correct when it comes to the largest health insurer in the United States. UnitedHealth has a 52-week range of $107.51 to $164.00 and a market cap of $153 billion. Its dividend yield is 1.5%.
UnitedHealth has already led the health care trend by exiting the exchanges, and Trump’s team is aiming to repeal and replace Obamacare. Analysts are positive on UnitedHealth being the largest health insurer in America, and it has been making smaller expansionary acquisitions that could lead to growth and better health care management trends that would be better for the whole health care spending arena in 2017 and years beyond.
[wallst_email_signup]
What stands out now is that when analysts issue Buy and Outperform ratings on Dow and most S&P 500 stocks, they generally are looking for a total return of 8% to 15%, if you include the dividends. The 8.4% expected gain for the Dow in 2017 uses all analysts, regardless of whether they issue Hold/Neutral or Sell/Underperform ratings.
At the start of 2016, the pool of analysts was calling for gains in all 30 Dow stocks. That did not quite come true, and some of the individual stock assumptions were way off. The calculation for the Dow upside in 2017 actually has the price already above the consensus analyst price target, even including the dividends. In 2015, 14 of 30 Dow stocks had negative total returns, versus just two in 2016.
This bullish and bearish projection has brought positive insight in years past. The 24/7 Wall St. peak DJIA calculation for 2015 was for a 7.4% gain to 19,142, but the Dow fell by 2.2% instead in 2015. The Dow peaked at 18,351, for a shortfall of almost 800 Dow points. What occurred in 2016 was odd in that neither Clinton nor Trump were used in 2016’s forecast. Here is how using the Dow projections and applying a mean percentage of a total return for each Dow stock has looked during the bull market of 2010 to 2015:
- In 2015, the methodology of more than 7% in gains never materialized and the Dow got only within about 4% of that peak projection.
- In 2014, the methodology indicated Dow gains of 3.2%, prior to dividends, or just under 6% with the dividends. The index gained 7.5%.
- In 2013, the Dow massively outperformed expectations, finishing the year much higher than the estimate of 14,590. This was the year that this methodology called for 11.34% gains, but the gain was up 26.5% before dividends (and 29.6% for the S&P 500 Index, before dividends).
- In 2012, the peak of 13,661.87 in the Dow compared to our projection of 13,678.
- In 2011, the methodology called for a blended peak consensus of 13,042.06. While the DJIA closed 2011 up 5.5% at 12,217.56 for the year, the index’s peak that year was 12,928.50.
- In 2010, the methodology called for a target of 11,455, and the Dow ended the year at 11,577.51.
There are a lot of things that have to go right for the Dow to hit 21,422 in 2017, but this is a lower bar than we have seen in many of the more recent years. Stay tuned for periodic updates to the Dow forecasts for 2017 and beyond.
Contact [email protected] for any questions or corrections.