


A bull market interrupted is how many investors likely feel at the start of 2016 after the Dow Jones Industrial Average (DJIA) fell by 2.2% in 2015. Then the worst start of any year of our lives, with the Dow dropping a sharp 6.2% in the first week, might make the caution ever stronger. Still, the Dow has been trying to find support around 16,500, now that it has challenged the formal 10% drop from its 2015 high. Does it sound possible that the average Dow stock could rise 13.2% after dividends in 2016? If so, the DJIA could magically approach 19,700!
Note that 24/7 Wall St. is not comfortable at all endorsing a 12% or 13% expected gain in the Dow for 2016. It is just very hard to get as bullish as the average analyst targets would indicate. The way the year started off just makes 2016 feel like this could be a very different year for bulls and bears. This is still how we have calculated the peak value or target price of the Dow based on combined forward price targets of each of the 30 Dow components for six years. This worked incredibly well for 2010 through 2014, but it fell short in 2015.
Even if you back out what feels like very misguided bullish Apple Inc. (NASDAQ: AAPL) targets from analysts, then the remaining 29 Dow stocks would have an expected average gain of 12%. Again, this projected upside just feels too bullish as 2016 starts off. One issue that has boosted these expected returns is that the average Dow stock dividend was about 2.8% at the end of 2015. The 2016 Dogs of the Dow was far higher in yields, with an average of 3.85% yield, now that seven of the 10 Dogs had negative total returns after dividends in 2015.
The average total return of each of the 30 Dow stocks was 2.59% in 2015. That means that the average Dow stock was basically flat without dividends, despite a 2.2% index drop. The Dow’s price-weighted calculation makes stocks with a higher share price weighted much more than those with low share price. But keep in mind that methodologies and views can change through time — ditto for analyst targets. In fact, the Dow itself is by current standards an ancient index, and its price-weighting versus market cap-weighting in other indexes makes it an old-school index.
Our peak-DJIA calculation for 2015 was 19,142 — what would have been a 7.4% gain, but by the end of 2015 the Dow fell by 2.2% instead. Even using the 19,142 DJIA peak price projection, the reality is that the Dow peaked at 18,351, for a shortfall of almost 800 Dow points (over 4% shy).
There are other issues to consider in 2016 for why expecting 12% or 13% upside for the Dow just feels too high. Economic growth in the United States and in growth markets looked better at the start of 2015 than it did at the start of 2016, and that was without the big 2016 market drop in the first week. Oil and commodity weakness persists, as does a strong dollar, and the Federal Reserve is expected to keep raising interest rates gradually off of a seven-year zero interest rate policy. Stock values against earnings are somewhat high, and earnings estimates are coming lower across the board, making the expected price-to-earnings (P/E) ratios even higher versus prior views.
[recirclink id= 308196]
Of the seven Dow stocks featured here that could propel the index higher, not all of them are the highest weightings in the index by price. They are, however, representative of broader groups that would see their valuations bleed over into peers and rivals if they match the expected performance. These are the seven Dow stocks that will be needed to drive the Dow higher in 2016. Will that be to 19,700? Likely not, so stay tuned for our 2016 bearish case for the Dow (Hint: closer to 15,000).
Apple Inc. (NASDAQ: AAPL) was the big lynchpin here for why there was so much expected upside for the Dow in 2016. Apple would not have been able to join the Dow prior to its seven-for-one stock split, but it ranks as the tenth largest weighting in the Dow at 4.1%. Analysts on average were expecting upside of 42.58%, if you include the dividend as of the end of 2015. 24/7 Wall St. warned readers that this analyst optimism would come down in 2016 and it already did. Apple’s target went from over $148 at the end of 2015 to under $143 after just the first seven trading days of 2016. Apple shares were under $99 after the first seven trading days of 2016, down from $105.26 at the end of 2015. The rational reality check is simple but perhaps painful: Apple’s implied upside still has much room to fall, and investors should expect that implied upside to fall further too, even considering a key Merrill Lynch analyst upgrade.
Boeing Co. (NYSE: BA) also is expected to be a key driver in 2016. It is ranked as the fourth largest Dow weighting at about 5.4%. It has much competition from Airbus, but Boeing is winning in defense orders too. Its gain was 14% in 2015 and was expected to be 15.79% for 2016, if you include its 2.52% yield. That $163.78 price target was down only six cents after the first seven trading days of 2016, but Boeing was among the worst performing DJIA stocks in the early 2016 market carnage. With oil and commodities tanking and so many growth markets slowing rapidly, one has to wonder how much of Boeing’s $400 plus billion backlog is closer to cancellation.
International Business Machines Corp. (NYSE: IBM) has fallen from grace, and its total return was -11.42% in 2015, even after the dividend. IBM closed out 2015 at $137.62, and its year ahead consensus target was $148.85, for a projected gain of 11.94%, if you include its 3.78% dividend yield. IBM’s stock was down under $132.00 after the first seven trading sessions in 2016, and the consensus analyst target was down to only $148.20. We cannot help but keep in mind that Credit Suisse has maintained a $125 target for so long, with downside hinted at. What if IBM finally performs in 2016? It’s a big if, but anything is possible. IBM’s shares are still the third highest weighting of the Dow at about 5.5%. Warren Buffett keeps adding IBM stock, and what if he is eventually right?
Nike Inc. (NYSE: NKE) is just doing everything right and its total return of 31.39% in 2015 made it the top Dow stock performer of 2015. Could it repeat in 2016? Nike closed 2015 at $62.50, and its consensus analyst target was $72.56, for an implied upside projection of 18.15%, if you include its 2.05% dividend yield. Nike is buying back stock and just went through a stock split too. Nike’s weight is now about 2.5%, but it was far higher before it split the stock. Analysts love Nike, and firms like Argus have gotten more aggressive. Nike keeps growing, even in many of the problem areas in the world, and it has its aggressive long-term growth projections.
Pfizer Inc. (NYSE: PFE) may be involved in a merger, and that inversion could even threaten Pfizer’s place in the Dow, but the end of 2015’s consensus price target of $40.44 signaled an implied 29% gain, if you include its 3.72% dividend. Pfizer shares were at $32.28 at the end of 2015 and were under $31.00 after the first seven days of trading this year. Pfizer’s 52-week high of $36.46 makes that analyst target feel far too high, unless Allergan can add a lot. Pfizer was selected for its big upside rather than its high Dow weighting. If Pfizer performs well, it is likely to lift most Big Pharma, and maybe even biotech, ships in 2016 — and that means that drug pricing concerns generally will have abated in an election year.
On top of more Dow stock components that could potentially lead the Dow higher in 2016, 24/7 Wall St. has generated a 2016 Bull/Bear scenario with links to 20 more of the Dow stocks with their total return projections as of year-end.
Goldman Sachs Group Inc. (NYSE: GS) generated a return of -5.79% in 2015, if you include the dividend yield. Still, it weighs heavily on the Dow with its $180.23 year-end share price. The consensus price target of $208.92 at the end of 2015 would imply upside of 17.36%, including its 1.44% yield. Goldman Sachs shares were down under $165.00 after the first seven trading days, and the consensus price target had drifted to just under $208. Goldman Sachs has the highest weighting of all 30 Dow stocks at almost 7%. That firm made its own projections for big banks in 2016, all with solid upside projections.
UnitedHealth Group Inc. (NYSE: UNH) rose over 18% in 2015, and its expected gain at the end of the year was 22.52%, including the 1.7% dividend yield. Its mean price target of $142.13 at the end 2015 was actually up marginally at $142.57 after the first seven days of trading in 2016. After UnitedHealth’s 2015 close of $117.64, it was down near $111.00 after seven trading sessions, but its weighting is roughly 4.6% of the entire Dow.
When you look at the existing 2015 year-end bull-bear scenarios on the large Dow stocks, some of these targets might actually seem silly. They were generated using the consensus analyst target prices from Thomson Reuters. On the bullish and bearish cases for 2016, the projected 2016 total returns were as follows:
- American Express Co. (NYSE: AXP) for an 18.00% expected total return.
- Apple Inc. (NASDAQ: AAPL) for a 42.60% expected total return.
- Boeing Co. (NYSE: BA) could have clear skies for a 15.8% expected total return.
- Caterpillar Inc. (NYSE: CAT) for a 4.87% expected total return.
- Chevron Corp. (NYSE: CVX) for a 15.40% total return (really?).
- Cisco Systems Inc. (NASDAQ: CSCO) for a 15.87% expected total return.
- E.I. du Pont de Nemours and Co. (NYSE: DD), or DuPont, for an expected 9.64% total return.
- Exxon Mobil Corp. (NYSE: XOM) for a 10.90% expected total return.
- General Electric Co. (NYSE: GE) for 4.95% expected total return.
- Goldman Sachs Group Inc. (NYSE: GS) for an expected 17.36% total return.
- Home Depot Inc. (NYSE: HD) for an expected 8.40% total return.
- International Business Machines Corp. (NYSE: IBM) for an 11.94% expected total return.
- Intel Corp. (NASDAQ: INTC) for a 7.75% expected total return.
- Johnson & Johnson (NYSE: JNJ) for a 8.06% expected total return.
- JPMorgan Chase & Co. (NYSE: JPM) for a 13.17% expected total return.
- 3M Co. (NYSE: MMM) for an 8.51% expected total return.
[recirclink id= 307306]
- McDonald’s Corp. (NYSE: MCD) for a 3.46% expected total return.
- Merck & Co. Inc. (NYSE: MRK) for a 21.35% expected total return.
- Microsoft Corp. (NASDAQ: MSFT) for a 5.34% expected total return.
- Nike Inc. (NYSE: NKE) for an 18.15% expected total return.
- Pfizer Inc. (NYSE: PFE) for a 29.00% expected total return.
- United Technologies Corp. (NYSE: UTX) for a 15.57% expected total return.
- Verizon Communications Inc. (NYSE: VZ) for a 13.33% expected total return.
- Visa Inc. (NYSE: V) for a 12.22% expected total return.
- Walt Disney Co. (NYSE: DIS) for a 13.87% expected total return.
As far as why 24/7 Wall St. has caution for being so bullish in 2016, these are just some Dow stats investors should consider.
Analysts see all 30 Dow stocks rising in 2016, even the oil stocks and heavy exporters. This just feels way too optimistic and assumes that not a single shoe falls at any of the Dow stocks. In 2015, 14 of 30 Dow stocks had negative total returns. The average forward P/E (calendar 2016) for Dow stocks was 16.5 at the end of 2015. All 30 Dow stocks have reported negative foreign exchange drags hurting exports or lowering earnings from overseas sales after currency calculations.
Another serious risk that seems very likely to thwart the bullish analysts is that 2016’s first week was the worst first week dating back to at least 1928. Dow stocks (led by Apple, GE, Cisco, IBM, Microsoft, McDonald’s, Wal-Mart) are likely to buy back a record sum of dollars worth of stock in 2016. Buybacks are good, but they distort earnings per share growth and may be eating up capital that could be used in other manners.
The composition of the Dow matters as well. It turns out that five of the 30 (16.666%) Dow components are technology stocks, but they have a combined weighting of only 14.25% due to the Dow’s price-weighted index calculation. Going back to mid-2009’s index changes, five of the 30 DJIA stocks have changed, and since the 1999 index changes have 10 Dow stocks (33.33%) being different than today. Is the Dow changing too much?
Dow calculations are more of a rounding error than the traditional S&P 500 projections. The 2016 S&P 500 targets from 14 Wall Street strategists imply positive but choppy gains. And here is how using the consensus analyst targets and applying a mean percentage of a total return for each Dow stock has looked during the bull market of 2010 to 2015:
- In 2015, the methodology of more than 7% in gains never materialized and the Dow got only within about 4% of that peak projection.
- In 2014, the methodology indicated DJIA gains of 3.2%, prior to dividends, or just under 6% with the dividends. The DJIA gained 7.5%.
- In 2013, the DJIA massively outperformed expectations, finishing the year much higher than the estimate of 14,590. This was the year that this methodology called for 11.34% gains, but the DJIA gain was up 26.5% before dividends (and 29.6% for the S&P 500 Index, before dividends).
- In 2012, the peak of 13,661.87 in the DJIA compared to our projection of 13,678.
- In 2011, the methodology called for a blended peak consensus of 13,042.06. While the DJIA closed 2011 up 5.5% at 12,217.56 for the year, the index’s peak that year was 12,928.50.
- In 2010, the methodology called for a target of 11,455, and the DJIA closed out the year at 11,577.51.
[recirclink id= 308390]
As a final reminder, that methodology was what generated an implied upside in the DJIA to 19,700. That just seems far too optimistic after the 1,000 drop in Dow points in the first week of 2016. If the Dow methodology from years past magically ends up being true, the 13% gain from the end of 2015 would be a gain of more than 19% in 2016 from the 16,500 level seen after the first week of the year. Miracles can happen, and the trend at the end of 2015 was that investors found different reasons to buy every single dip for more than the past four years.
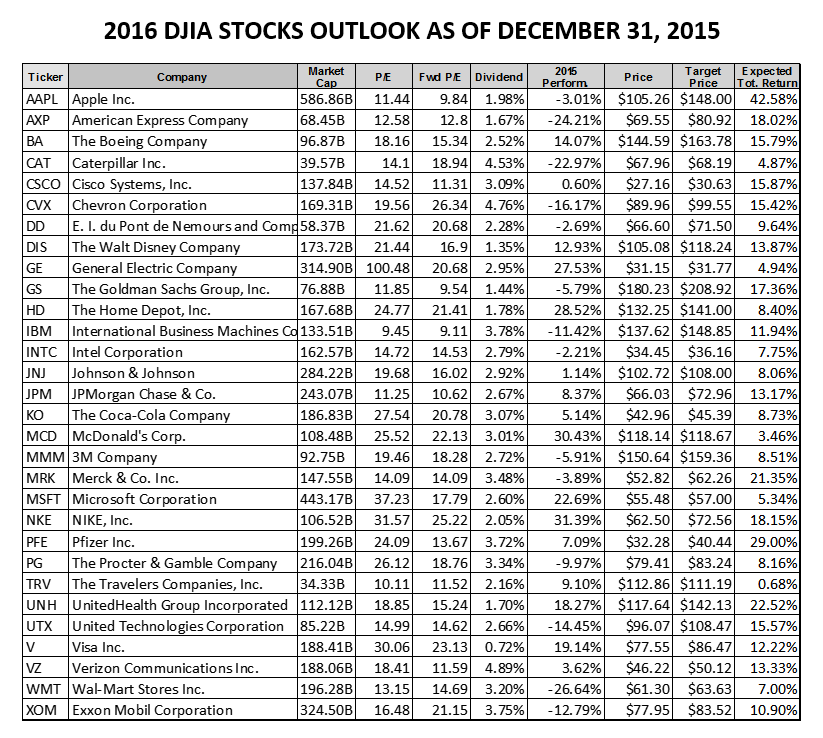
A snapshot of the Dow stocks has been included below. Data came from Yahoo! Finance and FINVIZ and was as of December 31, 2015.
Contact [email protected] for any questions or corrections.


