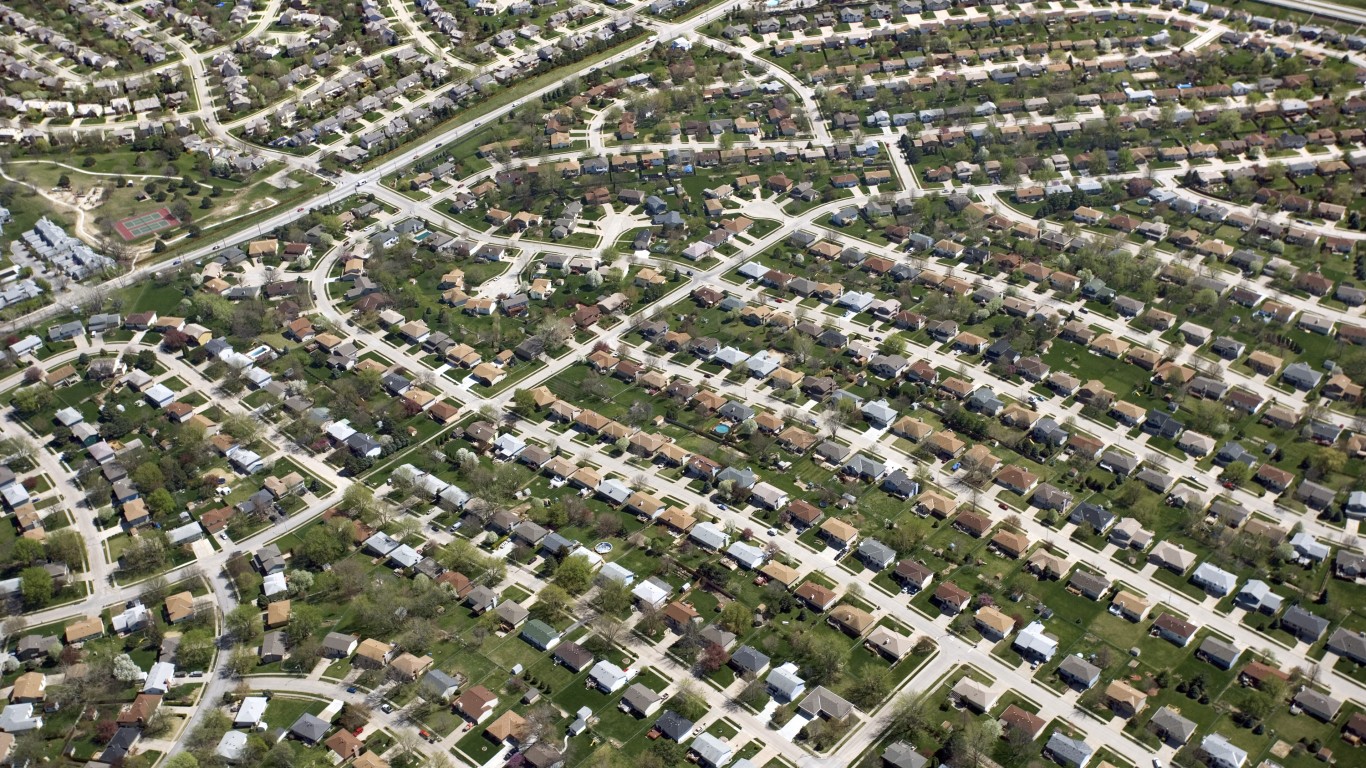
Last month, the median home listing price reached $435,000, a slight, $5,000 decrease compared to July. While down from June 2022’s record high of $449,000, home prices remain about as high as they’ve ever been in this country. Just five years ago, the typical listing price for a home in August was about $300,000. (These are the states where home values increased the most during COVID.)
To find the 25 counties where homes are most affordable, 24/7 Wall St. reviewed U.S. Home Affordability Report for the first quarter of 2023 ATTOM, a property data provider. The report determined affordability for average wage earners in 572 counties by calculating the amount of income needed for major home ownership expenses on a median-priced home, assuming a loan of 80% of the purchase price and a 28% maximum “front-end” debt-to-income ratio. Counties are ranked by the percent of annual wages needed to afford median monthly housing costs.
In all of the counties with the most affordable homes, the percentage of average local wages needed to cover homeownership costs is below 17%, considerably below the 29.9% nationwide standard.
Most of the counties on this list are in the Midwest, the South, and the mid-Atlantic, with five each in Illinois and Pennsylvania. Many of the counties are smaller, with populations under 200,000. However, a few larger outliers are Philadelphia County, Pennsylvania, with a population of 1.6 million, and Wayne County, Michigan, with a population nearing 1.8 million. (These are the cities where people need the smallest downpayments to buy their home)
The report also calculated the wage required to afford a median-priced home. The median home price of $320,000 in the first quarter of 2023 requires an annual wage of $78,416, based on the same assumptions, higher than the average annual wage nationwide of $70,460. In all the counties on this list, the required annual wage is lower than the local average wage and is below $35,200.
Click here to see the counties with the most affordable homes in America.
Click here to read our detailed methodology.

26. Delaware County, Indiana
> Pct. of local avg. wages needed to afford monthly housing costs: 16.5%
> Average annual wages: $49,673 – #80 lowest (8.7% YOY growth)
> Median home sales price, Q1 2023: $125,000 – #19 lowest (20.2% YOY growth)
> Annual wages needed to buy a median priced home: $31,153
> Population: 112,480
> Part of: Muncie, IN, metro area
[in-text-ad]

25. Jackson County, Michigan
> Pct. of local avg. wages needed to afford monthly housing costs: 16.4%
> Average annual wages: $57,694 – #272 highest (4.4% YOY growth)
> Median home sales price, Q1 2023: $138,450 – #36 lowest (-7.6% YOY growth)
> Annual wages needed to buy a median priced home: $38,072
> Population: 160,765
> Part of: Jackson, MI, metro area
[recirclink id=1257792]

24. Terrebonne County, Louisiana
> Pct. of local avg. wages needed to afford monthly housing costs: 16.2%
> Average annual wages: $57,603 – #275 highest (10.0% YOY growth)
> Median home sales price, Q1 2023: $149,900 – #48 lowest (-11.8% YOY growth)
> Annual wages needed to buy a median priced home: $35,624
> Population: 110,100
> Part of: Houma-Thibodaux, LA, metro area

23. Beaver County, Pennsylvania
> Pct. of local avg. wages needed to afford monthly housing costs: 16.1%
> Average annual wages: $59,462 – #232 highest (-0.1% YOY growth)
> Median home sales price, Q1 2023: $131,050 – #28 lowest (-9.6% YOY growth)
> Annual wages needed to buy a median priced home: $41,175
> Population: 168,260
> Part of: Pittsburgh, PA, metro area
[in-text-ad-2]

22. Kanawha County, West Virginia
> Pct. of local avg. wages needed to afford monthly housing costs: 16.0%
> Average annual wages: $56,186 – #262 lowest (5.4% YOY growth)
> Median home sales price, Q1 2023: $140,000 – #37 lowest (0.7% YOY growth)
> Annual wages needed to buy a median priced home: $32,630
> Population: 181,953
> Part of: Charleston, WV, metro area

21. Philadelphia County, Pennsylvania
> Pct. of local avg. wages needed to afford monthly housing costs: 16.0%
> Average annual wages: $78,845 – #46 highest (5.9% YOY growth)
> Median home sales price, Q1 2023: $194,750 – #115 lowest (-11.5% YOY growth)
> Annual wages needed to buy a median priced home: $51,271
> Population: 1,596,865
> Part of: Philadelphia-Camden-Wilmington, PA-NJ-DE-MD, metro area
[in-text-ad]

20. Fayette County, Pennsylvania
> Pct. of local avg. wages needed to afford monthly housing costs: 15.9%
> Average annual wages: $47,541 – #45 lowest (7.3% YOY growth)
> Median home sales price, Q1 2023: $117,650 – #12 lowest (17.0% YOY growth)
> Annual wages needed to buy a median priced home: $27,631
> Population: 129,443
> Part of: Pittsburgh, PA, metro area
[recirclink id=1234766]

19. Saint Lawrence County, New York
> Pct. of local avg. wages needed to afford monthly housing costs: 15.8%
> Average annual wages: $55,705 – #248 lowest (6.8% YOY growth)
> Median home sales price, Q1 2023: $112,282 – #8 lowest (22.7% YOY growth)
> Annual wages needed to buy a median priced home: $25,924
> Population: 108,836
> Part of: Ogdensburg-Massena, NY, metro area

18. Calcasieu County, Louisiana
> Pct. of local avg. wages needed to afford monthly housing costs: 15.6%
> Average annual wages: $59,878 – #223 highest (5.6% YOY growth)
> Median home sales price, Q1 2023: $149,950 – #50 lowest (-13.1% YOY growth)
> Annual wages needed to buy a median priced home: $40,061
> Population: 212,646
> Part of: Lake Charles, LA, metro area
[in-text-ad-2]

17. Mercer County, Pennsylvania
> Pct. of local avg. wages needed to afford monthly housing costs: 15.5%
> Average annual wages: $50,752 – #105 lowest (7.3% YOY growth)
> Median home sales price, Q1 2023: $112,600 – #9 lowest (-2.1% YOY growth)
> Annual wages needed to buy a median priced home: $31,546
> Population: 111,216
> Part of: Youngstown-Warren-Boardman, OH-PA, metro area

16. Jefferson County, Alabama
> Pct. of local avg. wages needed to afford monthly housing costs: 15.2%
> Average annual wages: $66,911 – #179 highest (6.9% YOY growth)
> Median home sales price, Q1 2023: $159,950 – #76 lowest (-11.1% YOY growth)
> Annual wages needed to buy a median priced home: $44,978
> Population: 672,550
> Part of: Birmingham-Hoover, AL, metro area
[in-text-ad]

15. Calhoun County, Michigan
> Pct. of local avg. wages needed to afford monthly housing costs: 15.2%
> Average annual wages: $61,165 – #25 lowest (3.6% YOY growth)
> Median home sales price, Q1 2023: $132,000 – #20 lowest (1.5% YOY growth)
> Annual wages needed to buy a median priced home: $32,028
> Population: 134,207
> Part of: Battle Creek, MI, metro area
[recirclink id=1200217]

14. Sangamon County, Illinois
> Pct. of local avg. wages needed to afford monthly housing costs: 15.2%
> Average annual wages: $62,855 – #182 highest (3.3% YOY growth)
> Median home sales price, Q1 2023: $125,000 – #19 lowest (-7.4% YOY growth)
> Annual wages needed to buy a median priced home: $39,920
> Population: 196,759
> Part of: Springfield, IL, metro area

13. Saint Louis City County, Missouri
> Pct. of local avg. wages needed to afford monthly housing costs: 14.9%
> Average annual wages: $72,839 – #68 highest (5.6% YOY growth)
> Median home sales price, Q1 2023: $160,000 – #67 lowest (2.5% YOY growth)
> Annual wages needed to buy a median priced home: $41,583
> Population: 302,787
> Part of: St. Louis, MO-IL, metro area
[in-text-ad-2]

12. Lucas County, Ohio
> Pct. of local avg. wages needed to afford monthly housing costs: 14.5%
> Average annual wages: $58,292 – #254 highest (6.4% YOY growth)
> Median home sales price, Q1 2023: $115,000 – #11 lowest (-8.0% YOY growth)
> Annual wages needed to buy a median priced home: $35,293
> Population: 431,212
> Part of: Toledo, OH, metro area

11. Caddo County, Louisiana
> Pct. of local avg. wages needed to afford monthly housing costs: 14.5%
> Average annual wages: $54,132 – #197 lowest (7.3% YOY growth)
> Median home sales price, Q1 2023: $120,350 – #15 lowest (-18.7% YOY growth)
> Annual wages needed to buy a median priced home: $34,146
> Population: 239,775
> Part of: Shreveport-Bossier City, LA, metro area
[in-text-ad]

10. Robeson County, North Carolina
> Pct. of local avg. wages needed to afford monthly housing costs: 14.5%
> Average annual wages: $43,277 – #7 lowest (6.9% YOY growth)
> Median home sales price, Q1 2023: $97,350 – #4 lowest (-28.7% YOY growth)
> Annual wages needed to buy a median priced home: $29,708
> Population: 118,836
> Part of: Lumberton, NC, metro area
[recirclink id=1188754]

9. Saginaw County, Michigan
> Pct. of local avg. wages needed to afford monthly housing costs: 14.3%
> Average annual wages: $55,055 – #227 lowest (5.4% YOY growth)
> Median home sales price, Q1 2023: $112,950 – #10 lowest (-5.9% YOY growth)
> Annual wages needed to buy a median priced home: $33,703
> Population: 190,540
> Part of: Saginaw, MI, metro area

8. Montgomery County, Alabama
> Pct. of local avg. wages needed to afford monthly housing costs: 14.1%
> Average annual wages: $55,744 – #250 lowest (6.1% YOY growth)
> Median home sales price, Q1 2023: $128,000 – #23 lowest (-3.7% YOY growth)
> Annual wages needed to buy a median priced home: $31,100
> Population: 229,072
> Part of: Montgomery, AL, metro area
[in-text-ad-2]

7. Saint Clair County, Illinois
> Pct. of local avg. wages needed to afford monthly housing costs: 13.8%
> Average annual wages: $54,366 – #205 lowest (6.2% YOY growth)
> Median home sales price, Q1 2023: $100,000 – #5 lowest (-28.6% YOY growth)
> Annual wages needed to buy a median priced home: $42,998
> Population: 258,597
> Part of: St. Louis, MO-IL, metro area

6. Bibb County, Georgia
> Pct. of local avg. wages needed to afford monthly housing costs: 13.4%
> Average annual wages: $51,506 – #128 lowest (4.5% YOY growth)
> Median home sales price, Q1 2023: $103,500 – #6 lowest (9.1% YOY growth)
> Annual wages needed to buy a median priced home: $28,574
> Population: 156,711
> Part of: Macon, GA, metro area
[in-text-ad]

5. Wayne County, Michigan
> Pct. of local avg. wages needed to afford monthly housing costs: 12.7%
> Average annual wages: $71,851 – #78 highest (5.7% YOY growth)
> Median home sales price, Q1 2023: $130,000 – #27 lowest (-3.7% YOY growth)
> Annual wages needed to buy a median priced home: $39,607
> Population: 1,789,781
> Part of: Detroit-Warren-Dearborn, MI, metro area
[recirclink id=1257792]
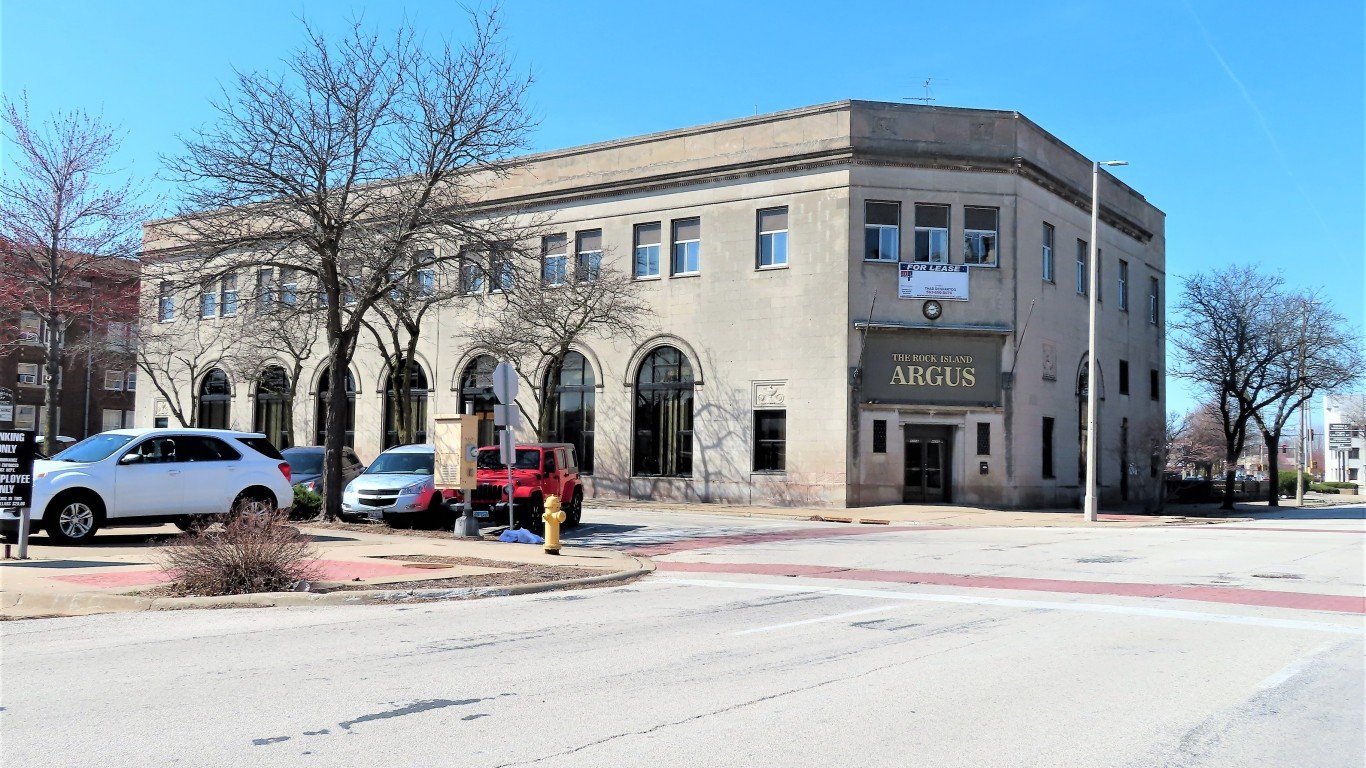
4. Rock Island County, Illinois
> Pct. of local avg. wages needed to afford monthly housing costs: 12.3%
> Average annual wages: $68,172 – #104 highest (4.8% YOY growth)
> Median home sales price, Q1 2023: $106,000 – #7 lowest (-5.9% YOY growth)
> Annual wages needed to buy a median priced home: $37,402
> Population: 144,694
> Part of: Davenport-Moline-Rock Island, IA-IL, metro area
3. Schuylkill County, Pennsylvania
> Pct. of local avg. wages needed to afford monthly housing costs: 11.1%
> Average annual wages: $51,129 – #112 lowest (7.0% YOY growth)
> Median home sales price, Q1 2023: $79,000 – #1 lowest (36.1% YOY growth)
> Annual wages needed to buy a median priced home: $21,880
> Population: 143,308
> Part of: Pottsville, PA, metro area
[in-text-ad-2]

2. Peoria County, Illinois
> Pct. of local avg. wages needed to afford monthly housing costs: 10.4%
> Average annual wages: $70,135 – #87 highest (8.7% YOY growth)
> Median home sales price, Q1 2023: $93,500 – #3 lowest (-6.5% YOY growth)
> Annual wages needed to buy a median priced home: $32,858
> Population: 182,439
> Part of: Peoria, IL, metro area

1. Macon County, Illinois
> Pct. of local avg. wages needed to afford monthly housing costs: 9.9%
> Average annual wages: $64,259 – #161 highest (7.7% YOY growth)
> Median home sales price, Q1 2023: $82,000 – #2 lowest (-5.7% YOY growth)
> Annual wages needed to buy a median priced home: $26,677
> Population: 104,331
> Part of: Decatur, IL, metro area
Methodology
To find the 25 counties where homes are most affordable, 24/7 Wall St. reviewed U.S. Home Affordability Report for the first quarter of 2023 from property data provider ATTOM, which considered 572 U.S. counties. Counties are ranked by the percent of annual wages needed to afford median monthly housing costs. All data is from the report for the first quarter of 2023. For annual wages, Attom annualized weekly wages from the U.S. Bureau of Labor Statistics.
The report determined affordability for average wage earners by calculating the amount of income needed for major homeownership expenses — such as property taxes, home insurance, mortgage payments, and mortgage insurance — on a median-priced home, assuming a loan of 80% of the purchase price (20% down payment) and a 28% maximum “front-end” debt-to-income ratio. Attom used average 30-year fixed interest rates from the Freddie Mac Primary Mortgage Market Survey to calculate monthly house payments.
Contact [email protected] for any questions or corrections.