America’s 25 Least Affordable Housing Markets
It is getting more difficult to afford a home in America. According to a report from ATTOM Data Solutions, a real estate and property data provider, median home prices in 2018’s fourth quarter hit their least affordable levels in over…

This post may contain links from our sponsors and affiliates, and Flywheel Publishing may receive compensation for actions taken through them.
It is getting more difficult to afford a home in America. According to a report from ATTOM Data Solutions, a real estate and property data provider, median home prices in 2018’s fourth quarter hit their least affordable levels in over a decade.
That quarter, homes sold for a median price of $241,250, a 9% increase from the fourth quarter of 2017, while the average annualized weekly wage in the United States of $56,381 climbed by only 3%. However, home prices actually became more affordable in 58% of counties over that same period.
For many Americans, owning a home is financially unrealistic. In some counties, the median home price is more than four times higher than what someone could afford based on the area’s average earnings.
24/7 Wall St. reviewed information from ATTOM Data Solutions on income needed to buy a home and average annual wages in each county to determine America’s 25 least affordable housing markets. The income needed to buy a house is calculated by assuming a 3% down payment and a 28% maximum “front-end” debt-to-income ratio.
The 25 least affordable housing markets in the United States are clustered in just four states — Massachusetts, Hawaii, New York, and California. All seven New York counties are either in or just outside New York City. The 15 least affordable California housing markets are spread out across the state.
To determine the 25 least affordable housing markets in the United States, 24/7 Wall St. reviewed county-level data from ATTOM Data Solutions. Counties were ranked based based on the affordability ratio — median housing prices in the area relative to average annual wages. Home sale price data and the total number of housing units also came from ATTOM. The income needed to buy a house is calculated by assuming a 3% down payment and a 28% maximum “front-end” debt-to-income ratio.
Click here to see America’s least affordable housing markets.
25. Barnstable County, Massachusetts
> Income needed to buy a house: $116,674
> Average annual wages: $47,190
> Q4 median sales price: $407,225
> Housing units: 161,632

24. San Diego County, California
> Income needed to buy a house: $151,138
> Average annual wages: $60,944
> Q4 median sales price: $545,000
> Housing units: 1,187,644
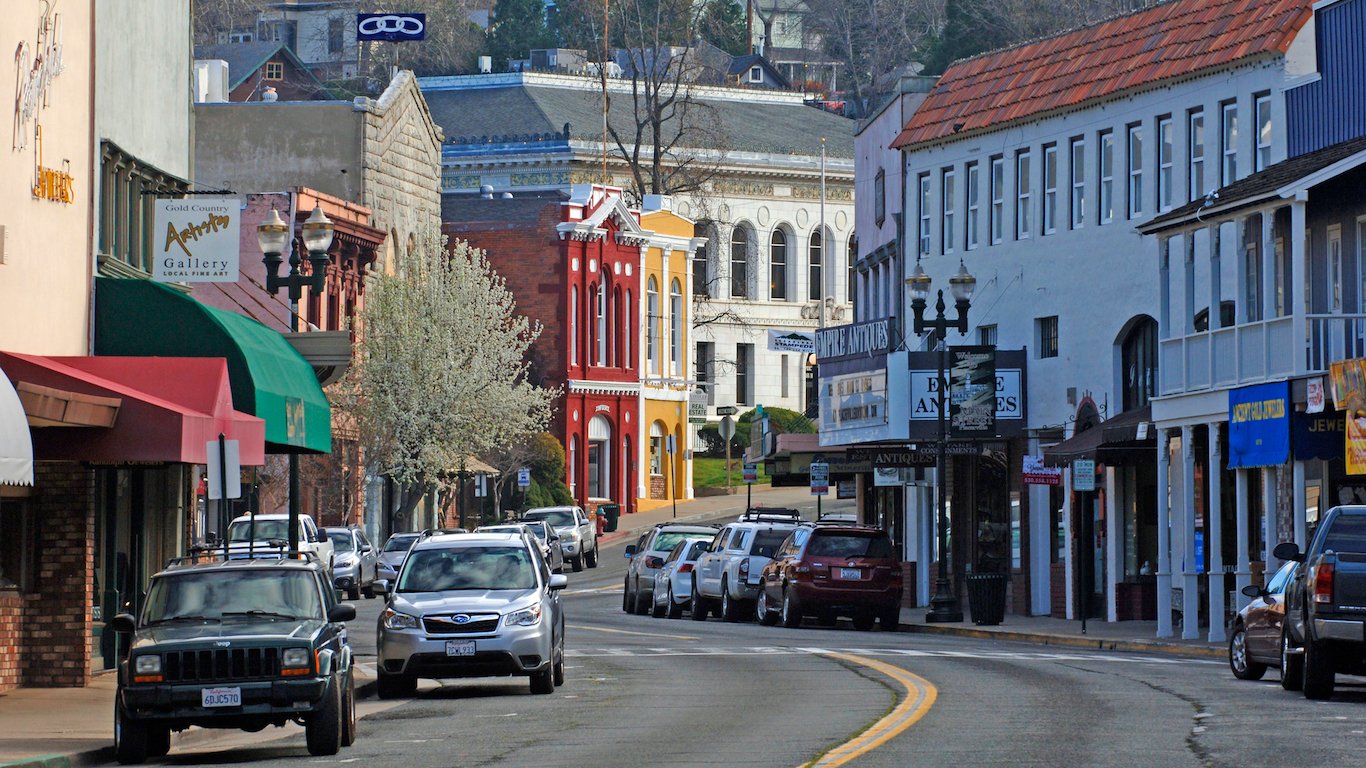
23. El Dorado County, California
> Income needed to buy a house: $124,489
> Average annual wages: $49,439
> Q4 median sales price: $444,500
> Housing units: 88,882
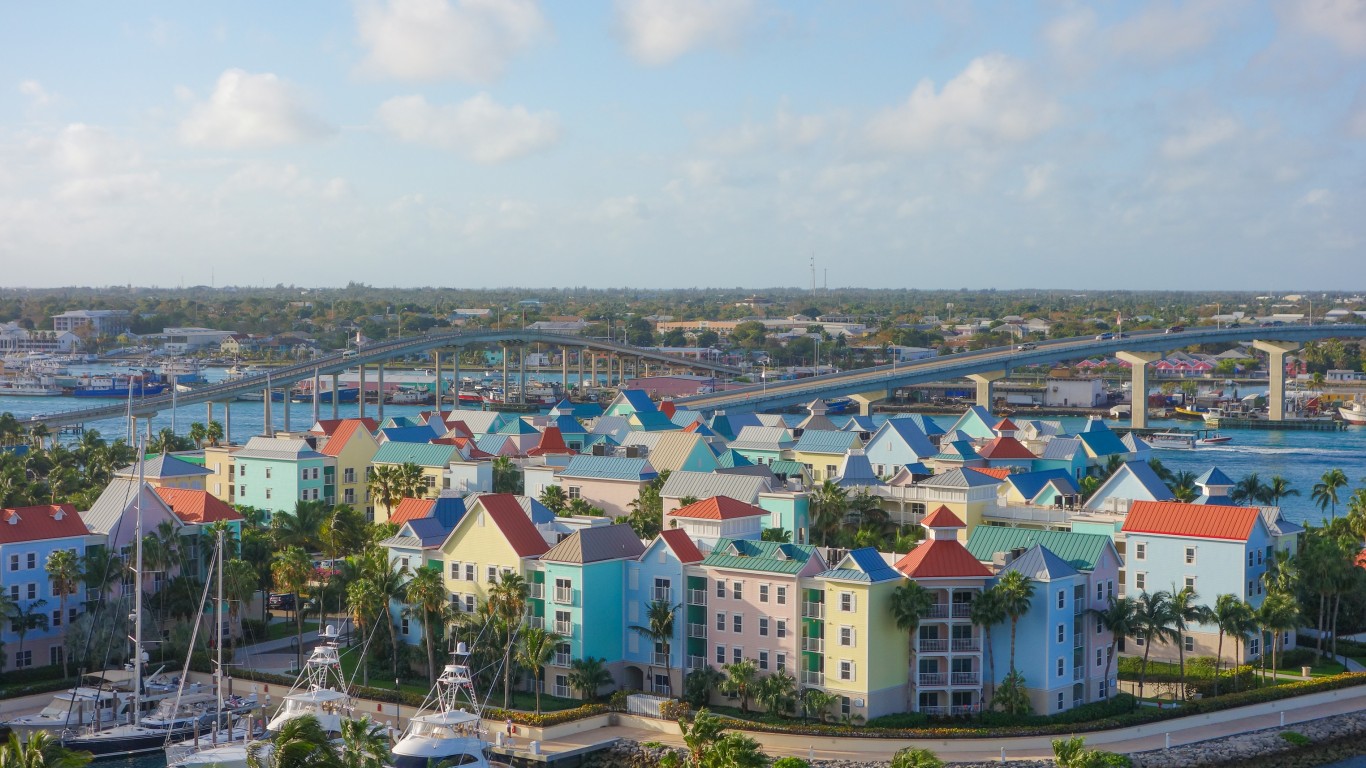
22. Nassau County, New York
> Income needed to buy a house: $160,010
> Average annual wages: $61,360
> Q4 median sales price: $520,000
> Housing units: 467,127

21. Los Angeles County, California
> Income needed to buy a house: $167,182
> Average annual wages: $63,947
> Q4 median sales price: $600,000
> Housing units: 3,490,118

20. Westchester County, New York
> Income needed to buy a house: $193,332
> Average annual wages: $72,566
> Q4 median sales price: $550,000
> Housing units: 369,925
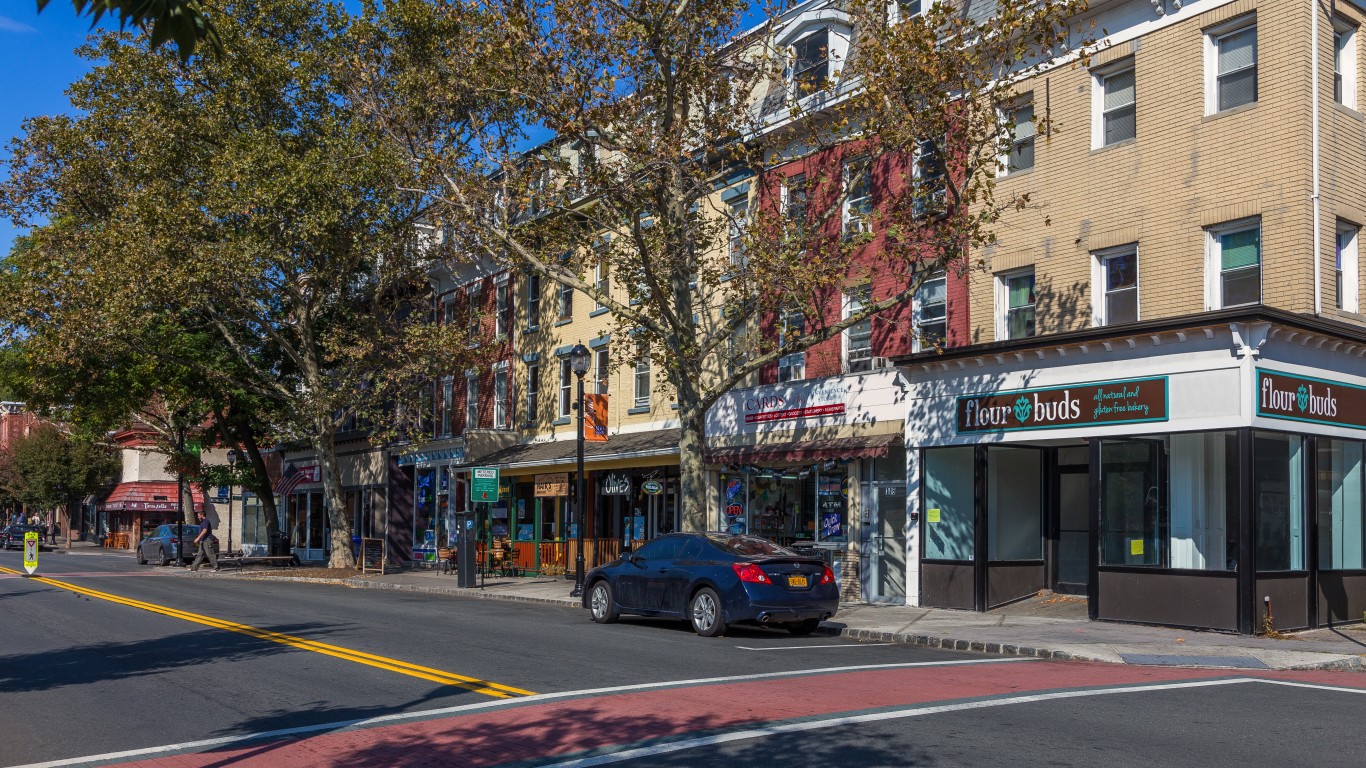
19. Rockland County, New York
> Income needed to buy a house: $144,536
> Average annual wages: $52,819
> Q4 median sales price: $415,000
> Housing units: 104,651
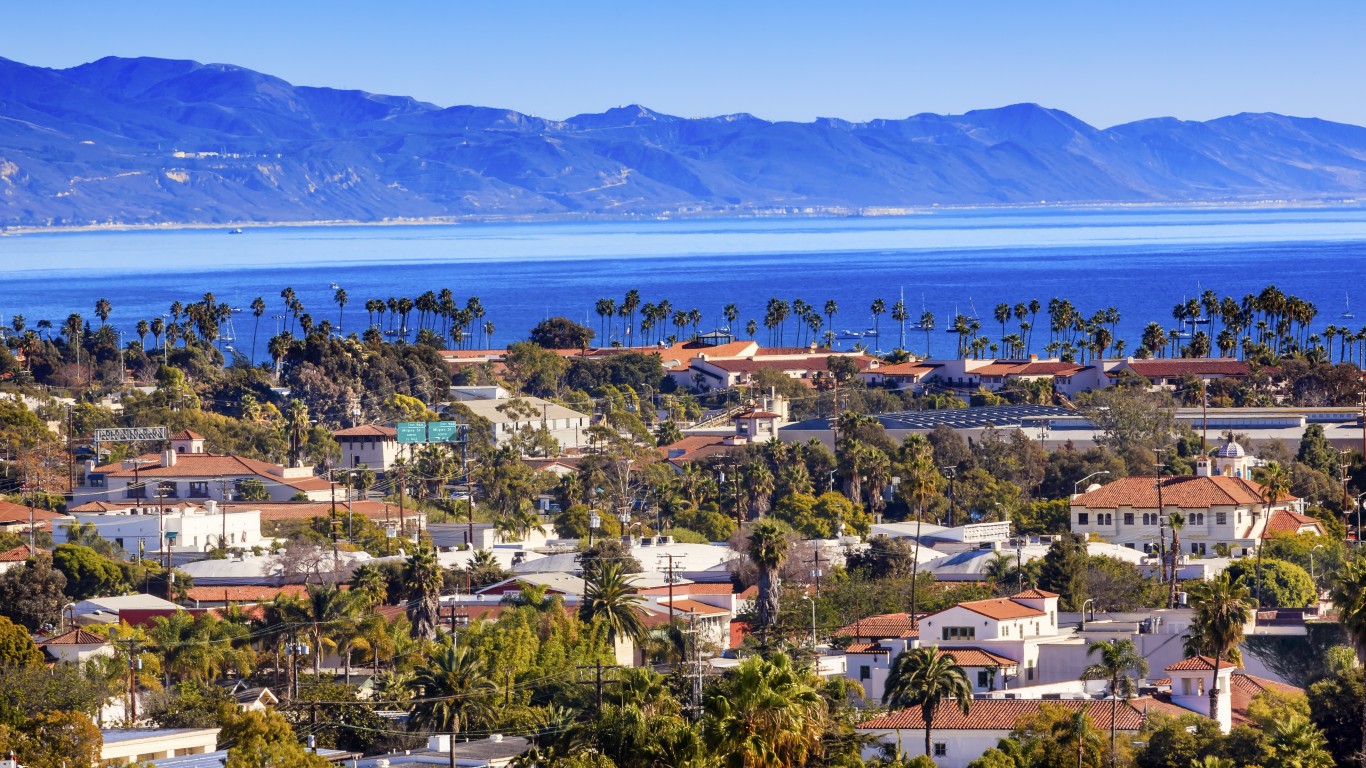
18. Santa Barbara County, California
> Income needed to buy a house: $146,990
> Average annual wages: $53,196
> Q4 median sales price: $525,000
> Housing units: 154,574

17. Richmond County, New York
> Income needed to buy a house: $141,594
> Average annual wages: $50,440
> Q4 median sales price: $500,000
> Housing units: 178,603

16. Alameda County, California
> Income needed to buy a house: $219,464
> Average annual wages: $75,192
> Q4 median sales price: $800,000
> Housing units: 592,796

15. Honolulu County, Hawaii
> Income needed to buy a house: $155,922
> Average annual wages: $52,364
> Q4 median sales price: $572,875
> Housing units: 342,982

14. San Mateo County, California
> Income needed to buy a house: $368,242
> Average annual wages: $122,551
> Q4 median sales price: $1,350,000
> Housing units: 273,798
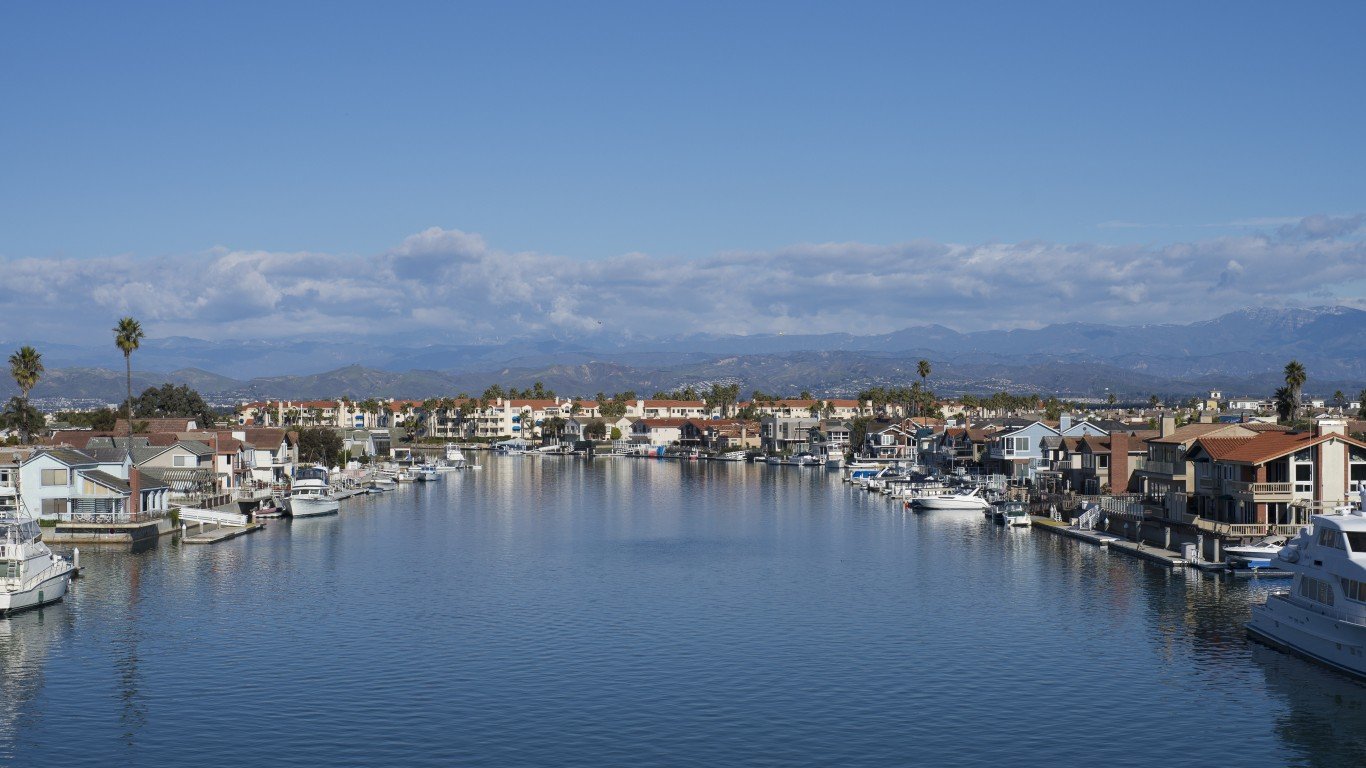
13. Ventura County, California
> Income needed to buy a house: $165,499
> Average annual wages: $54,600
> Q4 median sales price: $595,250
> Housing units: 284,759

12. Napa County, California
> Income needed to buy a house: $169,587
> Average annual wages: $55,042
> Q4 median sales price: $617,500
> Housing units: 55,301
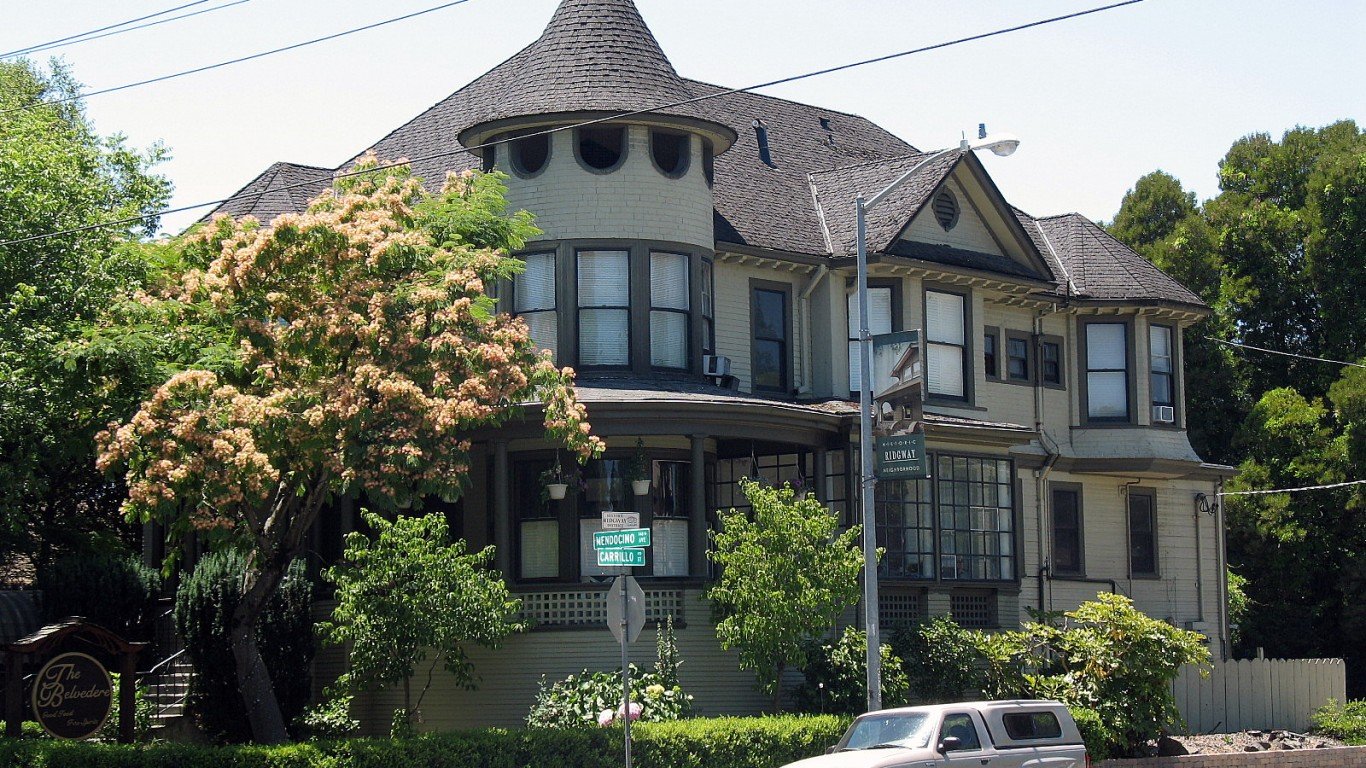
11. Sonoma County, California
> Income needed to buy a house: $166,090
> Average annual wages: $53,404
> Q4 median sales price: $600,000
> Housing units: 207,058

10. Orange County, California
> Income needed to buy a house: $196,136
> Average annual wages: $62,192
> Q4 median sales price: $690,000
> Housing units: 1,072,121
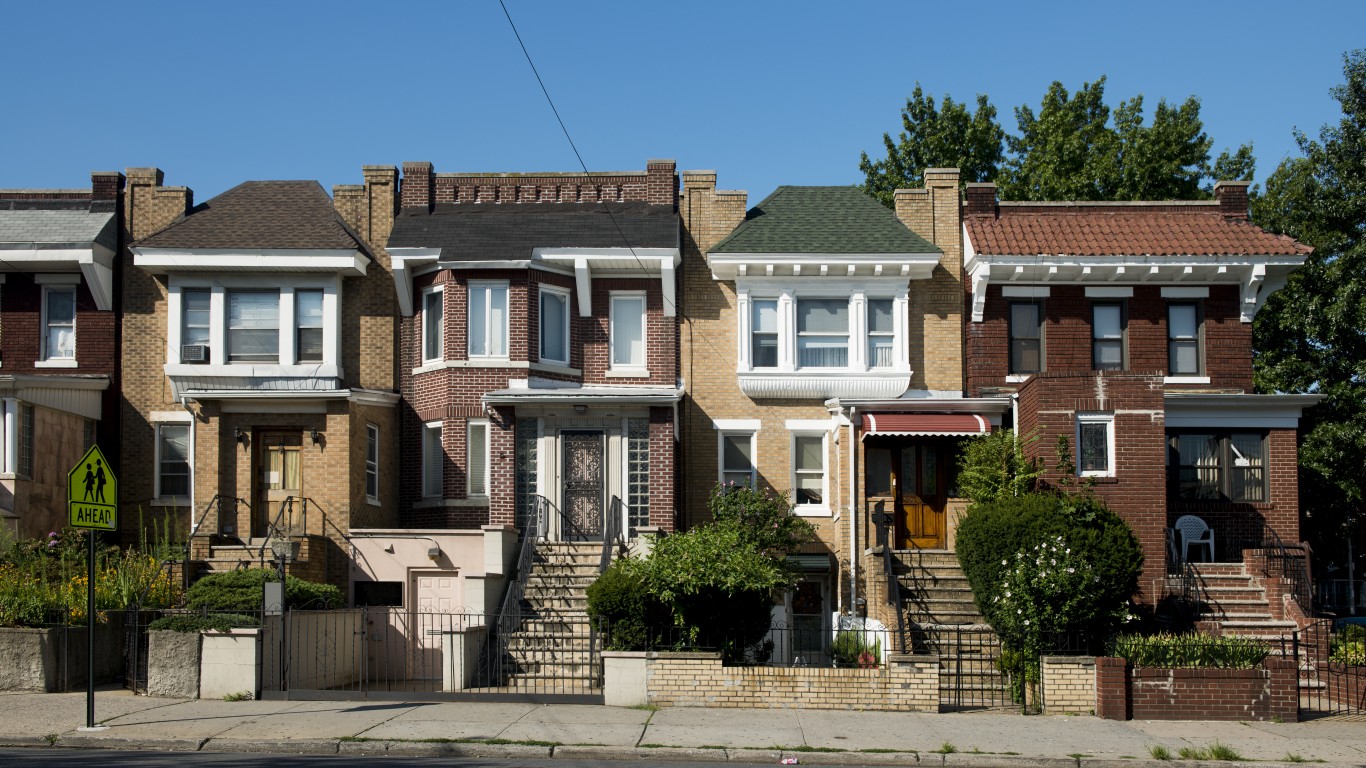
9. Queens County, New York
> Income needed to buy a house: $175,941
> Average annual wages: $53,872
> Q4 median sales price: $625,000
> Housing units: 846,689

8. Maui County, Hawaii
> Income needed to buy a house: $149,143
> Average annual wages: $45,565
> Q4 median sales price: $549,225
> Housing units: 71,493

7. San Francisco County, California
> Income needed to buy a house: $375,491
> Average annual wages: $113,802
> Q4 median sales price: $1,340,000
> Housing units: 386,755

6. New York County, New York
> Income needed to buy a house: $408,977
> Average annual wages: $122,720
> Q4 median sales price: $1,426,000
> Housing units: 866,644

5. San Luis Obispo County, California
> Income needed to buy a house: $158,489
> Average annual wages: $47,034
> Q4 median sales price: $570,000
> Housing units: 119,399

4. Monterey County, California
> Income needed to buy a house: $164,426
> Average annual wages: $47,528
> Q4 median sales price: $585,000
> Housing units: 140,169

3. Santa Cruz County, California
> Income needed to buy a house: $212,239
> Average annual wages: $50,297
> Q4 median sales price: $750,500
> Housing units: 105,255
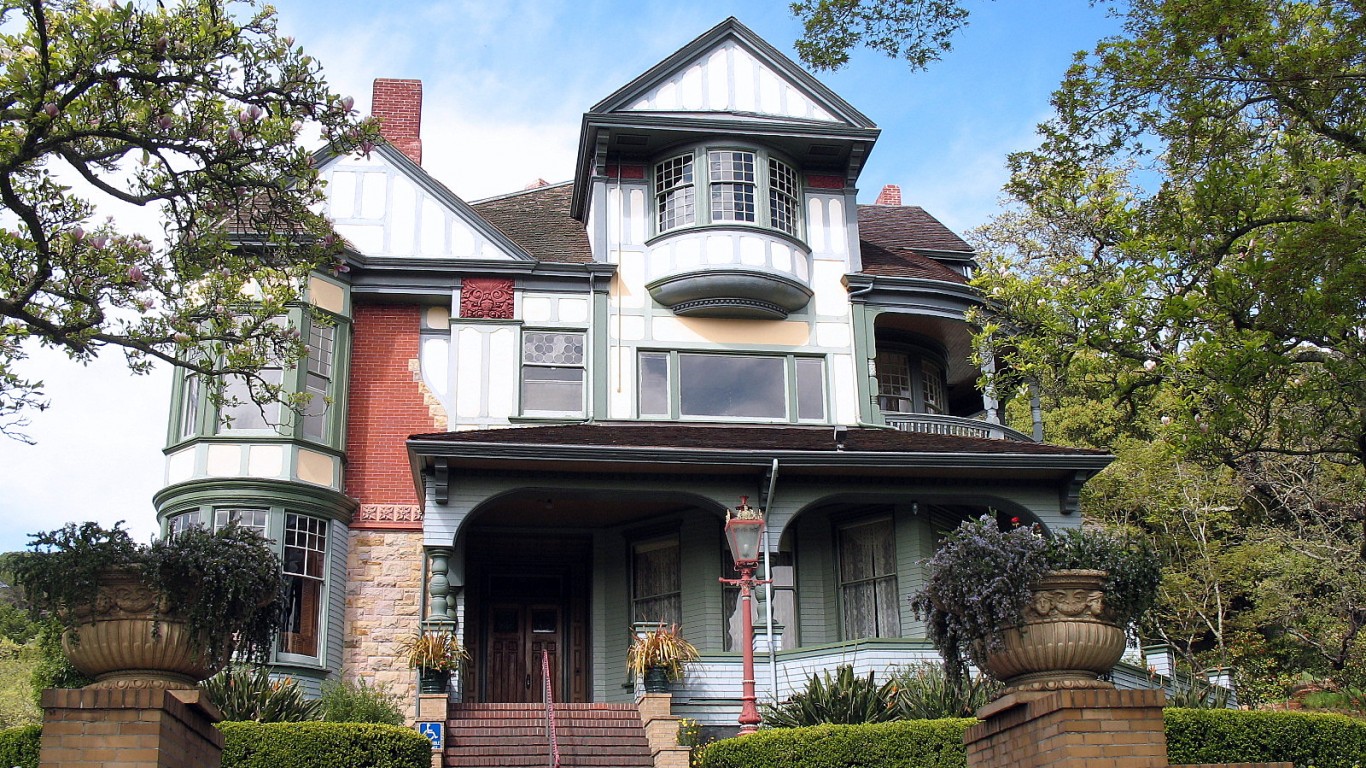
2. Marin County, California
> Income needed to buy a house: $315,524
> Average annual wages: $71,162
> Q4 median sales price: $1,125,000
> Housing units: 112,259
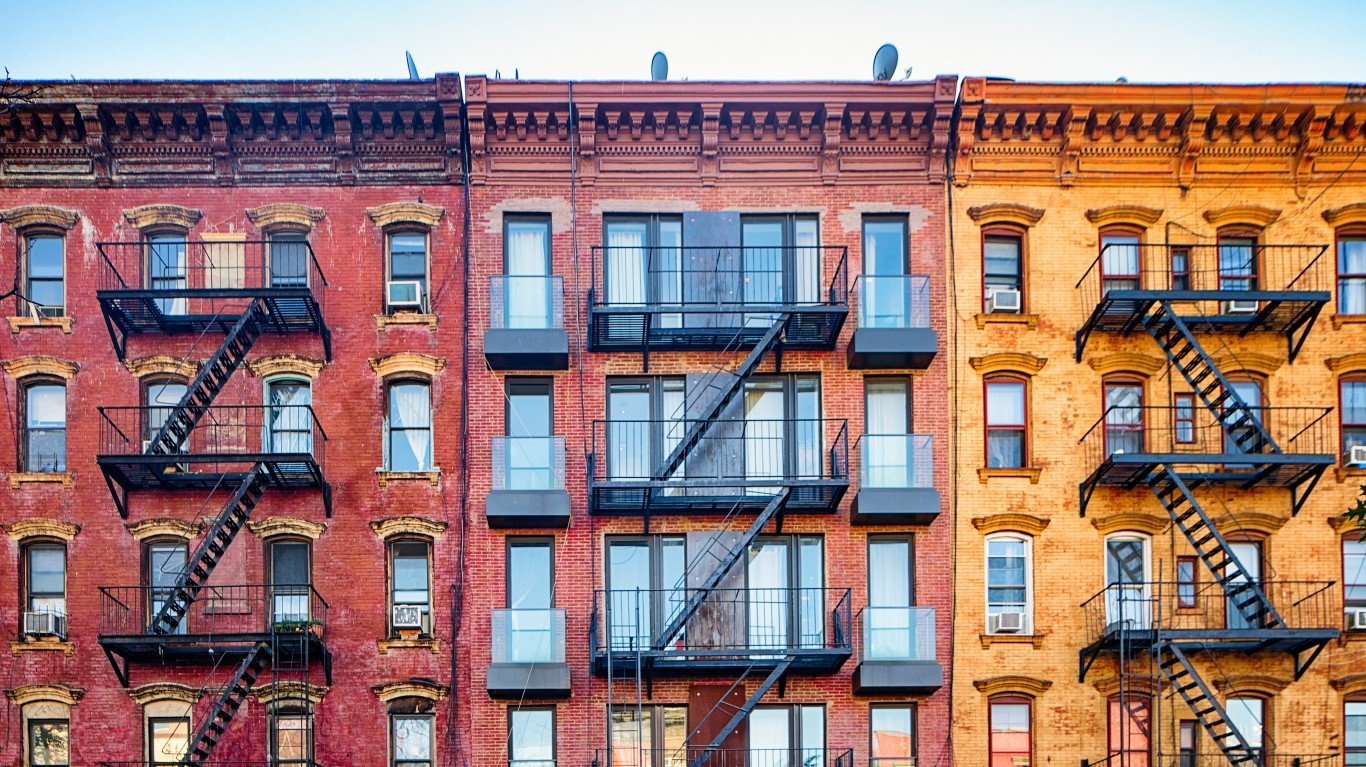
1. Kings County, New York
> Income needed to buy a house: $216,146
> Average annual wages: $46,982
> Q4 median sales price: $792,500
> Housing units: 1,021,747
Contact [email protected] for any questions or corrections.
Grant Suneson is a senior editor at 24/7 Wall St. He was previously a digital content creator at Newsy and a reporter at NPR member station KBIA, where he contributed to their Edward R. Murrow Award-winning coverage. He graduated from the University of Missouri with a degree in journalism.
Grant’s work has been published and referenced in many major outlets such as MSN, USA Today, Yahoo Finance, Detroit Free Press, Milwaukee Journal Sentinel, Austin American-Statesman, The Tennessean, The Cincinnati Enquirer, The Indianapolis Star, The Clarion-Ledger, WSB-TV, Des Moines Register, Asbury Park Press, KMGH-TV, and many others.