The median home listing price in May 2023 rose to $441,000, a 0.9% annual increase. Despite the increase, the price is down from a record high of $449,000 in June 2022. This cooling trend is hopeful for those looking to buy, especially after the surge in home prices in 2021. (These are the states where home values increased the most during COVID.)
Another sign of improvement for home buyers is that the percentage of average wages needed to cover homeownership expenses has fallen slightly to nearly 30% in the first quarter, according to property data provider ATTOM. However, this is still higher than the common lending standard, which allows for a debt-to-income ratio of 28%, that is, home-related expenses should not exceed 28% of wages.
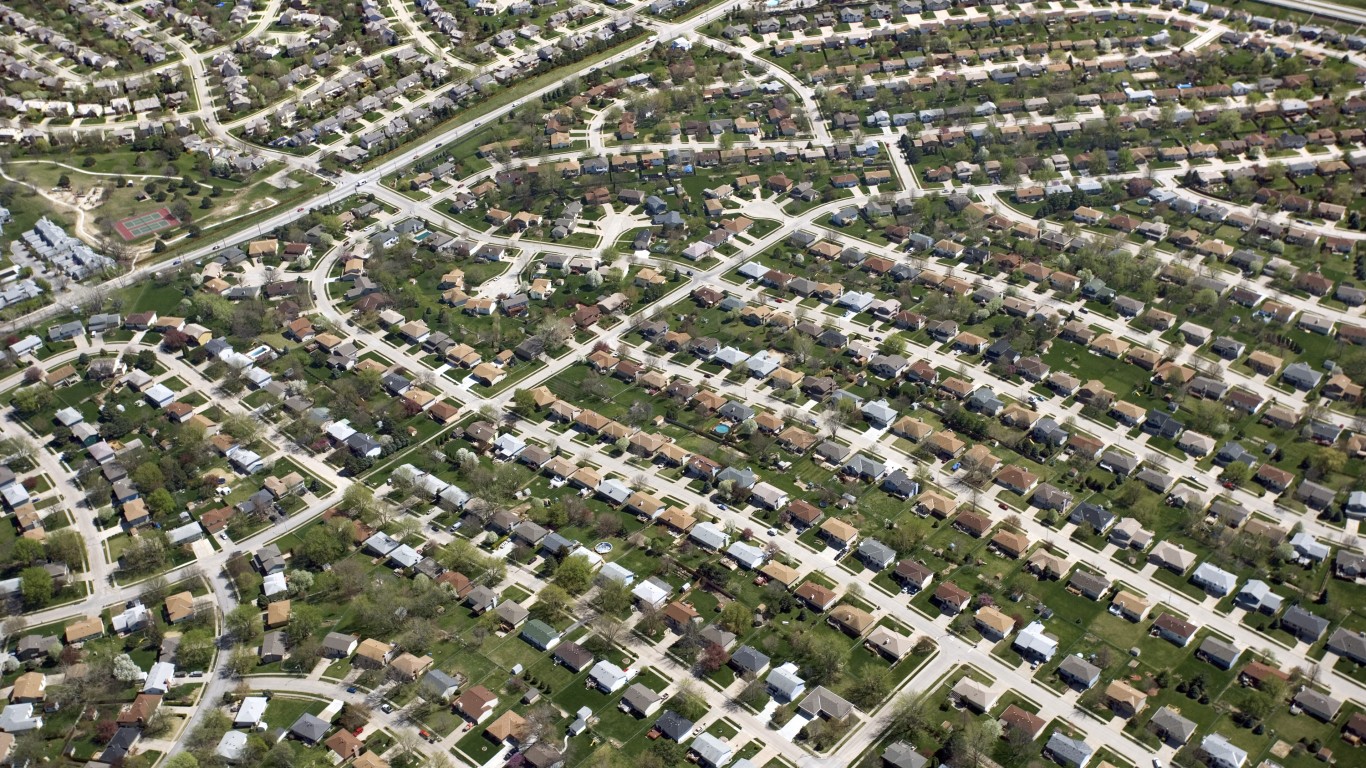
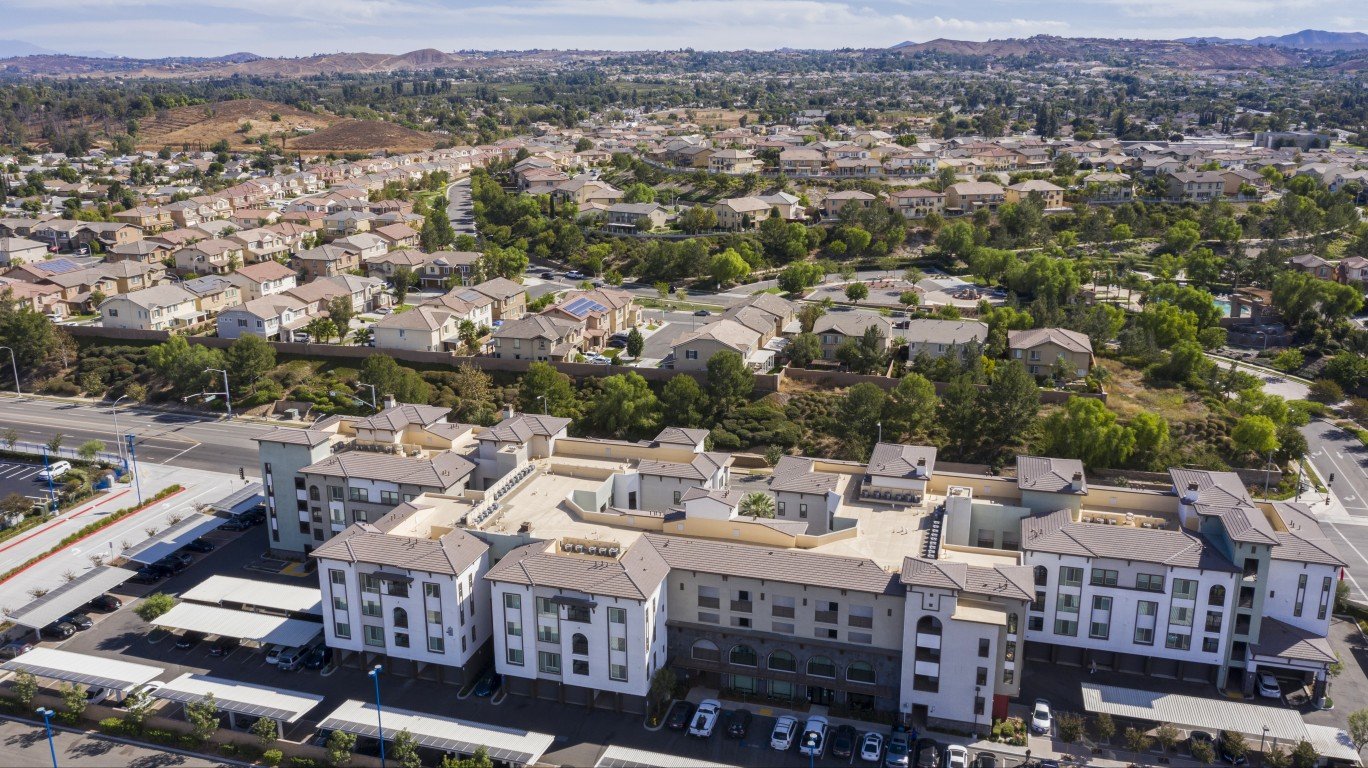
The higher than standard ratio means that purchasing a new home may be out of reach for an increasing number of house hunters. Depending on the region, some home prices remain completely unaffordable to the average resident.
To find the 25 counties where homes are least affordable, 24/7 Wall St. reviewed U.S. Home Affordability Report for the first quarter of 2023 ATTOM, a property data provider. The report determined affordability for average wage earners in 572 counties by calculating the amount of income needed for major home ownership expenses on a median-priced home, assuming a loan of 80% of the purchase price and a 28% maximum “front-end” debt-to-income ratio. Counties are ranked by the percent of annual wages needed to afford median monthly housing costs.
While nationwide average wage earners (earning $70,460 annually) need 29.9% of their income to afford a median home price of $320,000, the percentage of average local wages needed to cover homeownership expenses is above 61% in the 25 least affordable counties. The percentage is over 100% in the two least affordable counties, Santa Cruz, California, and Kings, New York, which is coextensive with the borough of Brooklyn. Nearly half of the counties are in California, and five are in New York. (The cost of housing has skyrocketed in these major U.S. cities.)
The report also calculated the wage required to afford a median-priced home. The median home price of $320,000 in the first quarter of 2023 requires an annual wage of $78,416, based on the same assumptions. In all the counties on this list, the required annual wage is above the local average wage and is over $100,000. The required wage is over $200,000 in seven counties, including two where the required annual wage to afford a home is over $300,000.
Click here to see the counties with the least affordable homes in America.
Click here to read our detailed methodology.

25. Barnstable County, Massachusetts (Cape Cod)
> Pct. of local avg. wages needed to afford monthly housing costs: 61.8%
> Annual wages: $60,216 – #218 highest (6.2% YOY growth)
> Median home sales price, Q1 2023: $590,000 – #36 highest (5.4% YOY growth)
> Annual wages needed to buy a median priced home: $150,133
> Population: 227,942
> Part of: Barnstable Town, MA, metro area
[in-text-ad]

24. Hays County, Texas
> Pct. of local avg. wages needed to afford monthly housing costs: 62.4%
> Annual wages: $50,427 – #97 lowest (10.1% YOY growth)
> Median home sales price, Q1 2023: $442,200 – #106 highest (5.2% YOY growth)
> Annual wages needed to buy a median priced home: $110,691
> Population: 234,573
> Part of: Austin-Round Rock, TX, metro area
[recirclink id=1257792]

23. Kootenai County, Idaho
> Pct. of local avg. wages needed to afford monthly housing costs: 62.5%
> Annual wages: $51,168 – #114 lowest (8.2% YOY growth)
> Median home sales price, Q1 2023: $520,495 – #59 highest (-4.2% YOY growth)
> Annual wages needed to buy a median priced home: $122,968
> Population: 168,317
> Part of: Coeur d’Alene, ID, metro area

22. Washington County, Utah
> Pct. of local avg. wages needed to afford monthly housing costs: 62.6%
> Annual wages: $44,785 – #14 lowest (8.1% YOY growth)
> Median home sales price, Q1 2023: $454,410 – #99 highest (-7.8% YOY growth)
> Annual wages needed to buy a median priced home: $117,529
> Population: 176,533
> Part of: St. George, UT, metro area
[in-text-ad-2]

21. San Diego County, California
> Pct. of local avg. wages needed to afford monthly housing costs: 62.7%
> Annual wages: $78,026 – #50 highest (4.2% YOY growth)
> Median home sales price, Q1 2023: $765,000 – #14 highest (-4.4% YOY growth)
> Annual wages needed to buy a median priced home: $183,132
> Population: 3,296,317
> Part of: San Diego-Carlsbad, CA, metro area

20. Los Angeles County, California
> Pct. of local avg. wages needed to afford monthly housing costs: 63.7%
> Annual wages: $79,248 – #45 highest (4.2% YOY growth)
> Median home sales price, Q1 2023: $785,000 – #12 highest (-4.0% YOY growth)
> Annual wages needed to buy a median priced home: $192,951
> Population: 10,019,635
> Part of: Los Angeles-Long Beach-Anaheim, CA, metro area
[in-text-ad]

19. New York County, New York
> Pct. of local avg. wages needed to afford monthly housing costs: 63.9%
> Annual wages: $161,070 – #4 highest (2.8% YOY growth)
> Median home sales price, Q1 2023: $1,526,000 – #1 highest (-7.8% YOY growth)
> Annual wages needed to buy a median priced home: $393,132
> Population: 1,669,127
> Part of: New York-Newark-Jersey City, NY-NJ-PA, metro area
[recirclink id=1253818]

18. Gallatin County, Montana
> Pct. of local avg. wages needed to afford monthly housing costs: 64.2%
> Annual wages: $58,578 – #244 highest (8.4% YOY growth)
> Median home sales price, Q1 2023: $586,375 – #37 highest (4.7% YOY growth)
> Annual wages needed to buy a median priced home: $150,149
> Population: 116,725
> Part of: Bozeman, MT, metro area

17. Washington County, Rhode Island
> Pct. of local avg. wages needed to afford monthly housing costs: 65.1%
> Annual wages: $57,928 – #262 highest (4.1% YOY growth)
> Median home sales price, Q1 2023: $576,375 – #41 highest (9.8% YOY growth)
> Annual wages needed to buy a median priced home: $117,529
> Population: 129,735
> Part of: Providence-Warwick, RI-MA, metro area
[in-text-ad-2]

16. Sonoma County, California
> Pct. of local avg. wages needed to afford monthly housing costs: 65.2%
> Annual wages: $69,303 – #95 highest (2.3% YOY growth)
> Median home sales price, Q1 2023: $698,375 – #21 highest (-6.9% YOY growth)
> Annual wages needed to buy a median priced home: $182,022
> Population: 492,498
> Part of: Santa Rosa, CA, metro area
15. Riverside County, California
> Pct. of local avg. wages needed to afford monthly housing costs: 65.4%
> Annual wages: $55,471 – #242 lowest (4.6% YOY growth)
> Median home sales price, Q1 2023: $550,000 – #49 highest (-2.7% YOY growth)
> Annual wages needed to buy a median priced home: $136,179
> Population: 2,409,331
> Part of: Riverside-San Bernardino-Ontario, CA, metro area
[in-text-ad]

14. Nassau County, New York
> Pct. of local avg. wages needed to afford monthly housing costs: 65.4%
> Annual wages: $74,646 – #60 highest (4.9% YOY growth)
> Median home sales price, Q1 2023: $675,000 – #24 highest (2.3% YOY growth)
> Annual wages needed to buy a median priced home: $188,749
> Population: 1,391,678
> Part of: New York-Newark-Jersey City, NY-NJ-PA, metro area
[recirclink id=1234766]

13. Coconino County, Arizona
> Pct. of local avg. wages needed to afford monthly housing costs: 66.7%
> Annual wages: $49,751 – #81 lowest (3.6% YOY growth)
> Median home sales price, Q1 2023: $544,810 – #54 highest (-0.9% YOY growth)
> Annual wages needed to buy a median priced home: $124,642
> Population: 144,942
> Part of: Flagstaff, AZ, metro area

12. Rockland County, New York
> Pct. of local avg. wages needed to afford monthly housing costs: 68.8%
> Annual wages: $63,323 – #175 highest (6.2% YOY growth)
> Median home sales price, Q1 2023: $570,000 – #44 highest (5.5% YOY growth)
> Annual wages needed to buy a median priced home: $167,561
> Population: 336,485
> Part of: New York-Newark-Jersey City, NY-NJ-PA, metro area
[in-text-ad-2]

11. Ventura County, California
> Pct. of local avg. wages needed to afford monthly housing costs: 72.3%
> Annual wages: $66,742 – #130 highest (2.3% YOY growth)
> Median home sales price, Q1 2023: $750,000 – #17 highest (-5.7% YOY growth)
> Annual wages needed to buy a median priced home: $186,094
> Population: 845,255
> Part of: Oxnard-Thousand Oaks-Ventura, CA, metro area

10. Santa Barbara County, California
> Pct. of local avg. wages needed to afford monthly housing costs: 74.5%
> Annual wages: $64,350 – #159 highest (5.3% YOY growth)
> Median home sales price, Q1 2023: $750,000 – #17 highest (-2.6% YOY growth)
> Annual wages needed to buy a median priced home: $176,445
> Population: 447,651
> Part of: Santa Maria-Santa Barbara, CA, metro area
[in-text-ad]
9. Queens County, New York
> Pct. of local avg. wages needed to afford monthly housing costs: 75.4%
> Annual wages: $65,260 – #147 highest (4.1% YOY growth)
> Median home sales price, Q1 2023: $760,000 – #16 highest (-1.0% YOY growth)
> Annual wages needed to buy a median priced home: $190,115
> Population: 2,393,104
> Part of: New York-Newark-Jersey City, NY-NJ-PA, metro area
[recirclink id=1200217]
8. Orange County, California
> Pct. of local avg. wages needed to afford monthly housing costs: 78.5%
> Annual wages: $77,259 – #52 highest (3.7% YOY growth)
> Median home sales price, Q1 2023: $950,000 – #7 highest (-3.1% YOY growth)
> Annual wages needed to buy a median priced home: $222,942
> Population: 3,182,923
> Part of: Los Angeles-Long Beach-Anaheim, CA, metro area

7. Napa County, California
> Pct. of local avg. wages needed to afford monthly housing costs: 80.5%
> Annual wages: $67,925 – #110 highest (3.7% YOY growth)
> Median home sales price, Q1 2023: $825,000 – #11 highest (-5.2% YOY growth)
> Annual wages needed to buy a median priced home: $212,056
> Population: 138,795
> Part of: Napa, CA, metro area
[in-text-ad-2]

6. San Luis Obispo County, California
> Pct. of local avg. wages needed to afford monthly housing costs: 85.0%
> Annual wages: $57,668 – #273 highest (1.3% YOY growth)
> Median home sales price, Q1 2023: $763,500 – #15 highest (-2.6% YOY growth)
> Annual wages needed to buy a median priced home: $191,075
> Population: 282,771
> Part of: San Luis Obispo-Paso Robles-Arroyo Grande, CA, metro area

5. Marin County, California
> Pct. of local avg. wages needed to afford monthly housing costs: 87.8%
> Annual wages: $90,194 – #20 highest (2.7% YOY growth)
> Median home sales price, Q1 2023: $1,209,625 – #5 highest (-10.4% YOY growth)
> Annual wages needed to buy a median priced home: $328,712
> Population: 262,387
> Part of: San Francisco-Oakland-Hayward, CA, metro area
[in-text-ad]

4. Monterey County, California
> Pct. of local avg. wages needed to afford monthly housing costs: 88.3%
> Annual wages: $56,199 – #263 lowest (2.2% YOY growth)
> Median home sales price, Q1 2023: $775,500 – #13 highest (0.1% YOY growth)
> Annual wages needed to buy a median priced home: $176,178
> Population: 438,953
> Part of: Salinas, CA, metro area
[recirclink id=1188754]

3. Maui County, Hawaii
> Pct. of local avg. wages needed to afford monthly housing costs: 96.4%
> Annual wages: $56,134 – #259 lowest (7.1% YOY growth)
> Median home sales price, Q1 2023: $881,250 – #10 highest (3.7% YOY growth)
> Annual wages needed to buy a median priced home: $203,073
> Population: 164,568
> Part of: Kahului-Wailuku-Lahaina, HI, metro area

2. Santa Cruz County, California
> Pct. of local avg. wages needed to afford monthly housing costs: 100.8%
> Annual wages: $63,622 – #171 highest (4.7% YOY growth)
> Median home sales price, Q1 2023: $1,010,000 – #6 highest (-10.2% YOY growth)
> Annual wages needed to buy a median priced home: $252,064
> Population: 272,138
> Part of: Santa Cruz-Watsonville, CA, metro area
[in-text-ad-2]
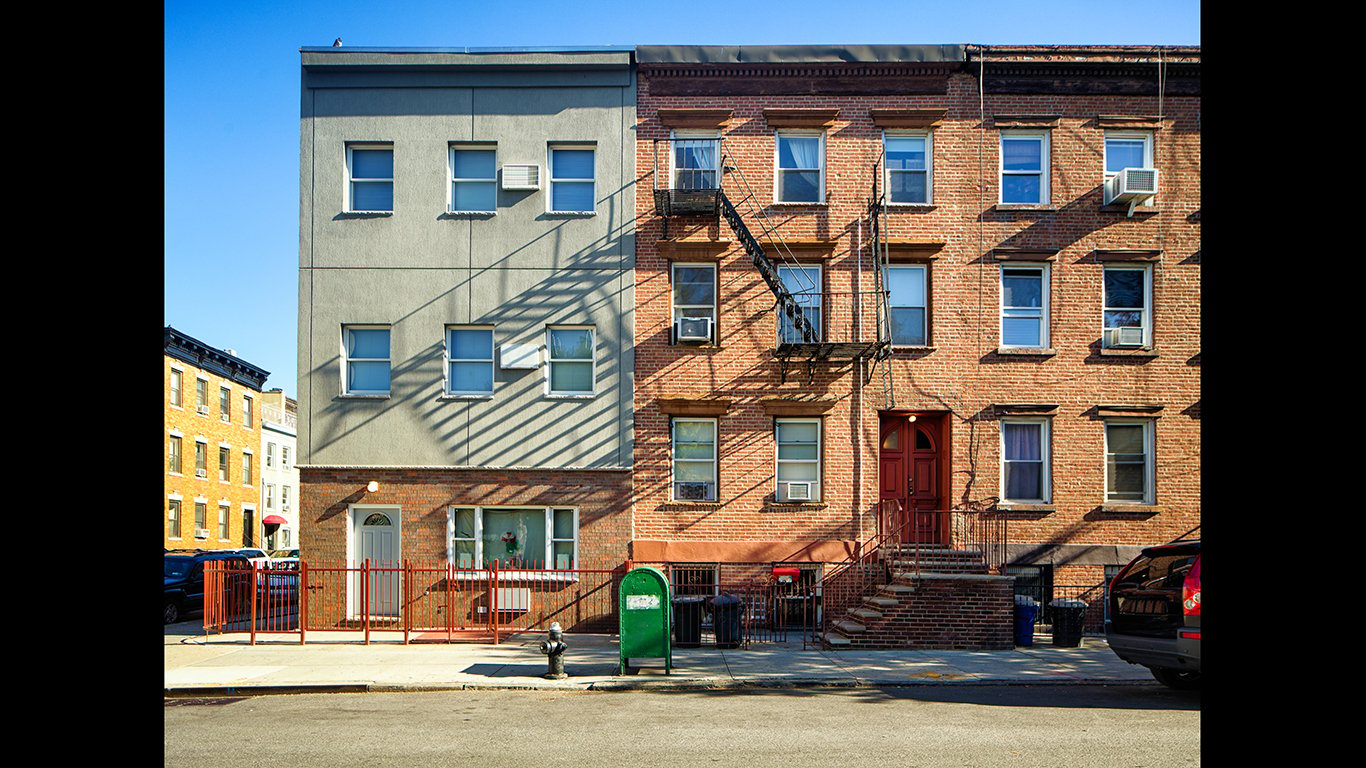
1. Kings County, New York
> Pct. of local avg. wages needed to afford monthly housing costs: 110.0%
> Annual wages: $57,850 – #263 highest (4.3% YOY growth)
> Median home sales price, Q1 2023: $941,200 – #8 highest (4.3% YOY growth)
> Annual wages needed to buy a median priced home: $232,521
> Population: 2,712,360
> Part of: New York-Newark-Jersey City, NY-NJ-PA, metro area
Methodology
To find the 25 counties where homes are least affordable, 24/7 Wall St. reviewed U.S. Home Affordability Report for the first quarter of 2023 from property data provider ATTOM, which considered 572 U.S. counties. Counties are ranked by the percent of annual wages needed to afford median monthly housing costs. All data is from the report for the first quarter of 2023. For annual wages, Attom annualized weekly wages from the U.S. Bureau of Labor Statistics.
The report determined affordability for average wage earners by calculating the amount of income needed for major homeownership expenses — such as property taxes, home insurance, mortgage payments, and mortgage insurance — on a median-priced home, assuming a loan of 80% of the purchase price (20% down payment) and a 28% maximum “front-end” debt-to-income ratio. Attom used average 30-year fixed interest rates from the Freddie Mac Primary Mortgage Market Survey to calculate monthly house payments.
Contact [email protected] for any questions or corrections.