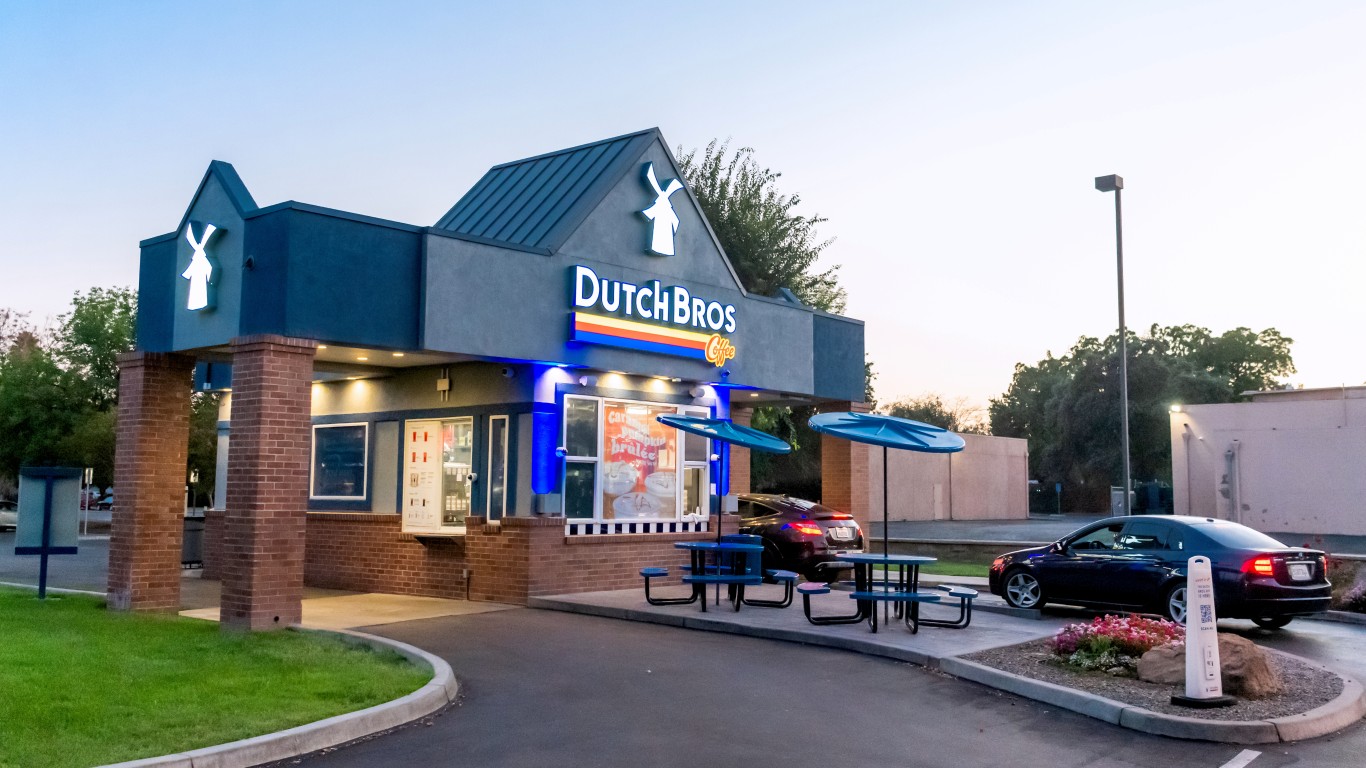
Dutch Bros (NASDAQ: BROS | BROS Price Prediction) delivered a third-quarter beat on both earnings and revenue Wednesday, with the drive-thru coffee chain posting $0.19 adjusted EPS against expectations of $0.17 and revenue of $423.58M versus the $413.60M consensus. The company raised full-year guidance on the strength of Q3 results and continued momentum through October, signaling confidence in its expansion and same-store sales trajectory.
Growth Accelerates Across the Board
Dutch Bros’ top and bottom lines both expanded significantly year over year. Revenue climbed 25.2% to $423.58M from $338.21M in Q3 2024, while net income more than doubled to $27.28M from $12.64M. Same-store sales growth reached 7.4% for company-operated locations and 5.7% across the system, demonstrating consistent traffic and transaction strength as the chain pushes deeper into new markets.
The company opened 38 new shops during the quarter across 17 states, bringing its total footprint to 1,081 locations. CEO Christine Barone emphasized the durability of the model in her remarks: “Based on our results through the third quarter and the strength that has continued through October, we are raising our full-year guidance for total revenues and same shop sales growth, reflecting the confidence we have in the long-term durability of our model and the effectiveness of our transaction driving initiatives.”
Margin Pressure Tempers the Upside
One area worth watching: gross profit declined 8.5% year over year to $82.44M despite the 25% revenue surge. This suggests cost pressures in labor, commodities, or supply chain operations are offsetting top-line gains. Operating income did expand 27.6% to $41.49M, and adjusted EBITDA rose 22.3% to $78M, indicating that operational discipline and scale are helping offset some margin headwinds. Still, the gross profit decline deserves attention as the chain continues its aggressive expansion.
Key Figures
Revenue: $423.58M vs. $413.60M expected; up 25.2% YoY
Adjusted EPS: $0.19 vs. $0.17 expected; up 11.8%
Net Income: $27.28M, up 115.8% YoY from $12.64M
Operating Income: $41.49M, up 27.6% YoY
Adjusted EBITDA: $78M, up 22.3% YoY
Company-operated same-store sales: +7.4%
System same-store sales: +5.7%
The earnings acceleration is the standout here. Net income growth of 116% far outpaces revenue growth, showing operational leverage kicking in as the business scales. Transaction-driving initiatives, which management highlighted in their commentary, appear to be working.
Management Signals Confidence
Dutch Bros raised guidance for full-year revenues and same-store sales growth, a move that typically signals management comfort with near-term demand. The company cited strength continuing through October as the primary driver of the increase. Barone’s language focused on execution and the durability of the model rather than any external tailwinds, suggesting confidence rooted in operational fundamentals rather than market conditions.
What Investors Should Monitor
The raised guidance sets a higher bar for Q4 and full-year results. You’ll want to track whether the company can sustain same-store sales growth as it cycles through a period of rapid new unit openings. Additionally, keep an eye on gross margin trends in the next quarter. If cost pressures persist while the chain continues expanding, that could signal a need for pricing or operational adjustments down the road. The earnings call will likely provide more color on unit economics and the sustainability of the current growth rate.
Contact [email protected] for any questions or corrections.