Lululemon Athletica (NASDAQ: LULU | LULU Price Prediction) spent years building a reputation as the premium athleisure brand. From yoga studios to city streets, the Vancouver-based company carved out a dominant position in high-margin athletic wear. The business model worked: combine technical innovation with lifestyle branding, charge premium prices, and watch customers line up.
The Premium Athleisure Dream Turned Nightmare
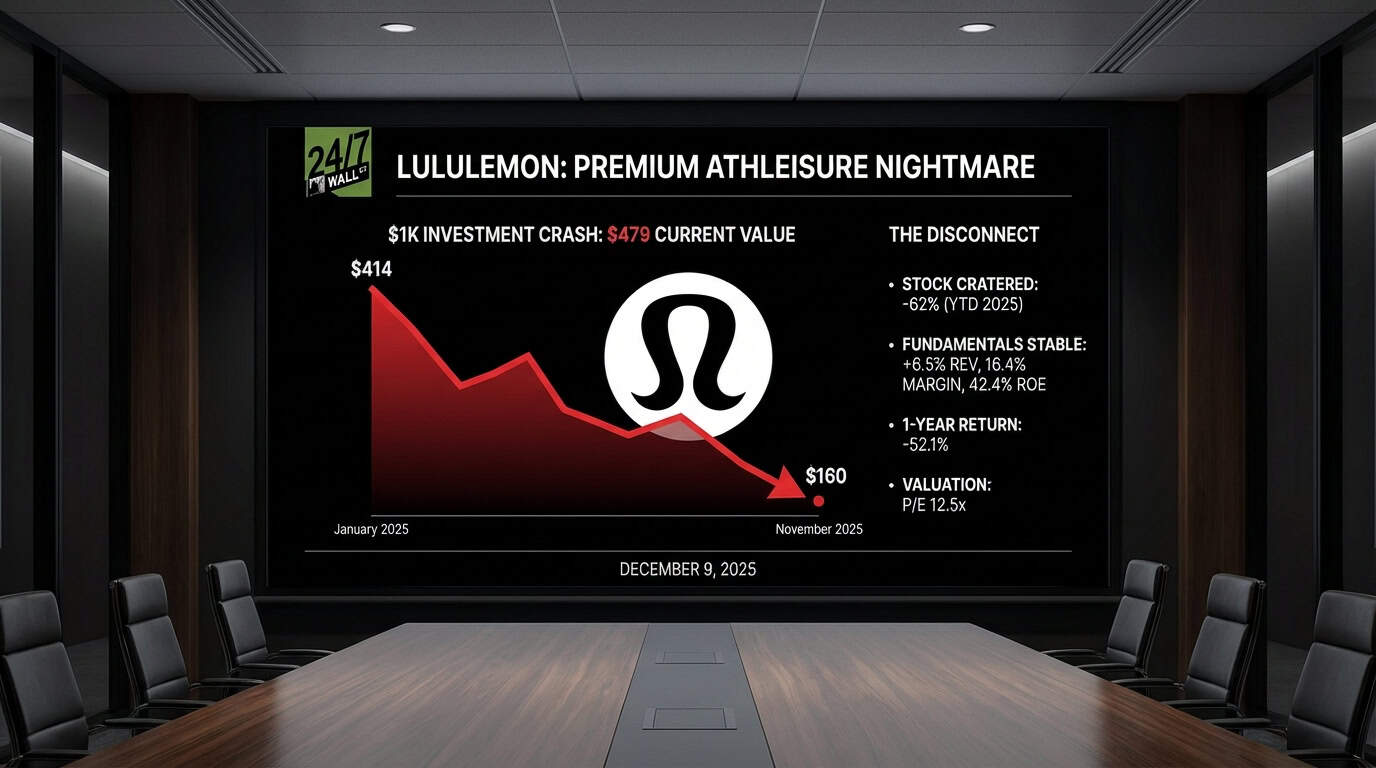
Then 2025 happened. What started as a stock trading at $414 in January collapsed to $160 by November, a 62% freefall that destroyed billions in market value. The company didn’t implode. Revenue still grew 6.5% year over year. Earnings dipped just 1.6%. Lululemon beat analyst estimates in eight of the last ten quarters, including a 7.3% surprise in its most recent report. The fundamentals stayed remarkably stable while the stock price cratered.
The disconnect between business performance and stock performance defines the Lululemon story of 2025. While competitors struggled with margin pressure, LULU maintained a 16.4% profit margin and 42.4% return on equity. The company generated nearly $11 billion in trailing revenue. Yet investors fled anyway, treating the stock like a failing retailer rather than a profitable growth company trading at just 12.5 times earnings.
Your $1,000 Became $479
1-Year Return
- Initial Investment: $1,000
- Current Value: $479
- Total Return: -52.1%
- S&P 500 (same period): Data unavailable for comparison
3-Year Return
- Initial Investment: $1,000
- Current Value: $571
- Total Return: -42.9%
- Annualized Return: -16.9%
- S&P 500 (same period): Data unavailable for comparison
The numbers are brutal. A $1,000 investment made one year ago would be worth $479 today. Extend that to three years and you’re at $571. The peak-to-trough decline erased over $250 per share in ten months.
What drove the collapse? Not earnings misses. Not revenue declines. The market simply stopped believing in the growth story. When a premium-priced stock loses its premium multiple, the math gets ugly fast.

The Bull and Bear Case
The bull case centers on valuation: investors are buying a profitable, cash-generating business at 12.5 times earnings with a 42% ROE. Wall Street’s average price target of $190 suggests potential upside if the company can prove it can reignite growth and the multiple re-rates higher. The argument rests on the athleisure category still having runway and the company’s ability to accelerate international expansion.
The bear case argues that premium athleisure has peaked and competition from cheaper alternatives continues eroding pricing power. What appears as a discount at $183 could prove to be a value trap if Lululemon’s best growth days are behind it. Notably, insiders aren’t buying the dip—the only recent transaction was a sale at $178.
The disconnect between business performance and stock price remains significant, though accelerating growth in coming quarters would provide more clarity on the company’s trajectory.
Contact [email protected] for any questions or corrections.