Better Buy: Comparing the SPY and EQL ETF

Photo of Michael Williams
By Michael Williams Published

Quick Read

  • SPY allocates 34.2% to technology while the top three holdings exceed 20% of the fund.

  • EQL charges 0.27% versus SPY’s 0.09%. That costs an extra $180 annually per $100K invested.

  • SPY returned 234% over ten years compared to EQL’s 217%.

  • Are you ahead, or behind on retirement? SmartAsset's free tool can match you with a financial advisor in minutes to help you answer that today. Each advisor has been carefully vetted, and must act in your best interests. Don't waste another minute; learn more here.(Sponsor)
This post may contain links from our sponsors and affiliates, and Flywheel Publishing may receive compensation for actions taken through them.
Better Buy: Comparing the SPY and EQL ETF

© bigjom jom / Shutterstock.com

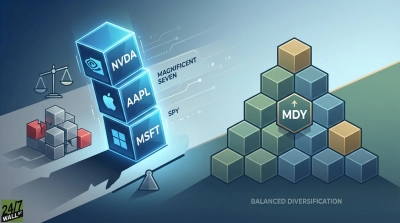
When investors buy the S&P 500, they assume they’re getting balanced exposure to America’s largest companies. But SPDR S&P 500 ETF Trust (NYSEARCA:SPY) delivers something different: a portfolio where technology commands over one-third of assets, and the top three holdings represent more than 20% of the fund. For investors seeking actual sector balance, ALPS Equal Sector Weight ETF (NYSEARCA:EQL) treats all eleven S&P 500 sectors equally, regardless of market capitalization.

Two Philosophies for Accessing the Same 500 Companies

SPY’s market-cap weighting creates dramatic concentration. Technology receives 34.2% allocation while energy gets just 2.8%. This structure amplifies whatever sectors are winning, letting profits compound as successful companies grow larger. The fund’s $700 billion in assets and 0.09% expense ratio make it the default choice for passive investors.

EQL holds equal positions in eleven sector-specific ETFs. Technology gets the same 9.1% allocation as utilities, energy, and materials. This prevents any single sector from dominating returns, creating a defensive posture that reduces reliance on continued mega-cap tech outperformance.

An infographic titled 'ALPS Equal Sector Weight ETF (EQL): A Balanced Approach.' Section 1, 'How the ETF Works,' displays 11 colored 3D cubes representing sector ETFs (XLE, XLV, XLU, XLI, XLK, XLC, XLP, XLRE, XLY, XLF, XLB) each with approximately 9.1% weight, arranged in a circular flow with arrows and a rebalancing gear icon. Text explains EQL holds equal positions in S&P 500 sector-specific ETFs and systematically rebalances. Section 2, 'Best Use Case for Investors,' features a balance scale icon and text describing EQL as ideal for sector diversification, reducing concentration risk, and hedging against tech dominance. Section 3, 'Pros & Cons,' lists four pros with a green checkmark (Lower Concentration Risk, Higher Dividend Yield, Reduced Tech Exposure, Potential for Outperformance) and four cons with a red X (Higher Expense Ratio, Higher Portfolio Turnover, Historical Underperformance, Volatile Dividend Payments), with comparative data to SPY provided for many points.
24/7 Wall St.
This infographic details how the ALPS Equal Sector Weight ETF (EQL) works, its ideal use cases, and a comparative analysis of its pros and cons against traditional S&P 500 funds like SPY.
 

The Performance Reality Check

Over the past decade, SPY’s concentration strategy proved superior, returning 234% compared to EQL’s 217%. The five-year gap is narrower at 85% versus 81%, while year-to-date performance in early 2026 shows EQL slightly ahead. This reveals the fundamental tradeoff: market-cap weighting rewards investors when dominant sectors continue winning, but equal-weighting provides ballast when leadership rotates.

EQL’s 0.27% expense ratio costs nearly three times SPY’s fee. On a $100,000 investment, that’s an extra $180 annually, adding up to roughly $5,400 over 30 years before compounding effects.

The Income Consideration

EQL’s 1.69% yield appears attractive compared to SPY’s 1.03%, though investors should research the consistency of each fund’s dividend payments when evaluating income potential.

Who Should Avoid Each Fund

SPY is wrong for investors convinced that technology’s dominance will fade or those uncomfortable with nearly 40% of their S&P 500 exposure concentrated in ten companies. It’s also problematic for contrarians seeking to benefit from sector rotation away from mega-cap growth stocks.

EQL doesn’t fit investors focused on maximizing total returns. The fund’s structural underperformance during tech-led rallies makes it unsuitable for those prioritizing maximum capital appreciation.

Consider RSP for True Equal-Weighting

Invesco S&P 500 Equal Weight ETF (NYSEARCA:RSP) offers a more direct equal-weight approach by holding all 500 stocks at equal weights rather than using sector ETFs as intermediaries. This provides finer-grained diversification and has historically delivered stronger performance than EQL during value and small-cap rallies, though it comes with a 0.20% expense ratio and higher turnover from constant rebalancing.

SPY remains the better buy for most investors seeking S&P 500 exposure, delivering superior returns with lower costs and reliable income, though its technology concentration creates meaningful risk if sector leadership shifts.

Photo of Michael Williams
About the Author Michael Williams →

I am a long time investor and student of business, and believe finding good companies that can become great investments is the best game on earth. After 20 years of writing and researching the public markets it is clear that individuals have never had more tools and information to take control of their financial lives. From ETFs and $0 commissions to cryptos and prediction markets there has never been a greater democratization of access to investing. 

I write to help people understand the investments available to them so they can make the best choice for their portfolio, whether they're starting out or looking for income in retirement. 

Featured Reads

Our top personal finance-related articles today. Your wallet will thank you later.

Continue Reading

Top Gaining Stocks

SBAC Vol: 6,561,861
+$32.48
+18.93%
$204.04
INTC Vol: 116,652,552
+$2.35
+4.89%
$50.38
CCI Vol: 6,077,367
+$3.95
+4.89%
$84.78
DASH Vol: 5,049,148
+$5.95
+3.95%
$156.45
GLW Vol: 11,551,797
+$5.54
+3.89%
$147.92

Top Losing Stocks

ENPH Vol: 6,407,914
-$3.36
8.78%
$34.92
TSLA Vol: 82,683,008
-$20.67
5.42%
$360.59
GE Vol: 5,319,306
-$11.52
3.94%
$281.16
LKQ
LKQ Vol: 4,320,217
-$1.12
3.82%
$28.19
SWK Vol: 2,144,477
-$2.53
3.55%
$68.64