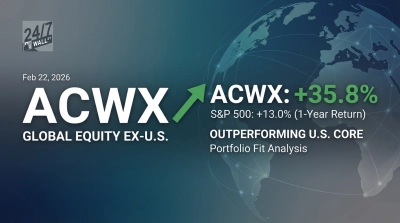
After a decade of US equity dominance, the iShares MSCI EAFE ETF (NYSEARCA:EFA) has shown strong recent performance, marking a potential turning point for investors who watched international developed markets trail US counterparts during the past ten years. With major investment firms highlighting international equities as attractive for 2026, the fund offers valuation discounts, higher dividend yields, and geographic diversification compared to US equities.
What EFA Provides: Developed International Exposure
EFA provides access to over 1,000 companies across Europe, Japan, Australia, and other developed markets outside North America. The fund’s $68.6 billion in assets and 24-year track record make it one of the most established international equity options. Top holdings include ASML Holding (NASDAQ:ASML | ASML Price Prediction), Roche Holding (OTC:RHHBY), Novartis (NYSE:NVS), and HSBC Holdings (NYSE:HSBC), offering exposure to quality businesses generating substantial revenue worldwide.
The fund generates returns through capital appreciation from established multinationals trading at lower valuations than US peers, combined with dividend income from regions where shareholder payouts remain a cultural priority. EFA’s 2.39% dividend yield provides roughly 100 basis points more income than typical US equity funds.
Performance After Years of Underperformance
The fund’s recent momentum reflects what several 2026 investment outlooks emphasized. James Investment Research noted international equities appear attractive with valuation discounts and potential dollar weakness as tailwinds. International developed markets have shown strong performance, outpacing US equities and demonstrating a shift from years of American exceptionalism.
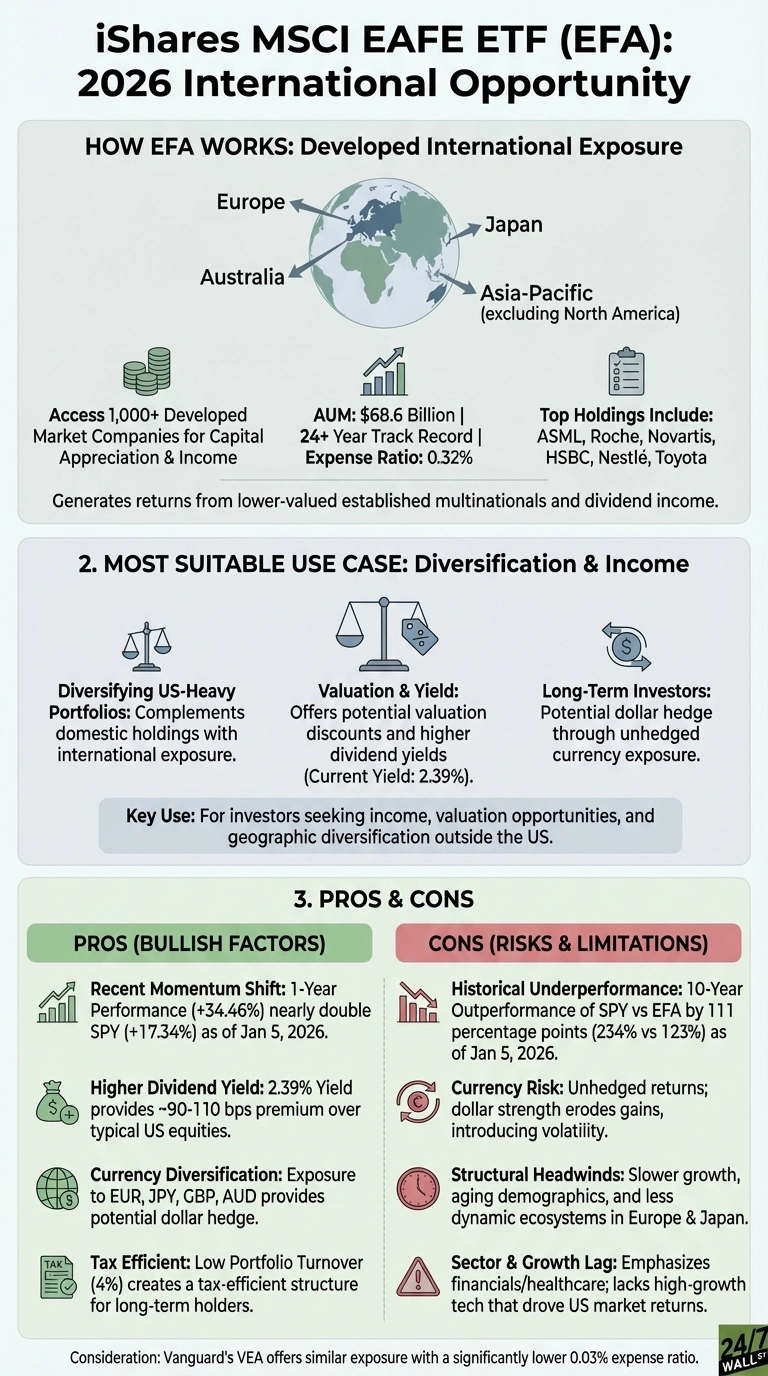
EFA’s 0.32% expense ratio and minimal 4% portfolio turnover create a tax-efficient structure for long-term holders. The fund has delivered outperformance while maintaining broad diversification across sectors and countries, reducing concentration risk compared to US equity indexes dominated by a handful of technology giants.
The Tradeoffs Investors Accept
Currency exposure cuts both ways. While a weakening dollar can boost returns for US investors holding international stocks, dollar strength erodes gains. EFA is unhedged, meaning returns reflect both underlying stock performance and currency movements against the US dollar.
Growth rates in developed international markets typically lag US economic expansion. Europe and Japan face structural headwinds including aging demographics, slower productivity growth, and less dynamic entrepreneurial ecosystems. These markets also carry geopolitical risks, from European energy dependence to tensions in Asia-Pacific.
The fund’s recent strong performance doesn’t guarantee continuation. Mean reversion works in both directions, and if US markets resume dominance, EFA could again trail domestic alternatives.
Understanding EFA’s Limitations
The fund emphasizes financials, healthcare, and industrials over high-growth technology names that drove US market returns. The fund’s structure favors multi-year holding periods rather than tactical positions, with currency fluctuations and slower-moving developed international markets affecting shorter timeframes.
Consider Vanguard’s Lower-Cost Alternative
The Vanguard FTSE Developed Markets ETF (NYSEARCA:VEA) offers nearly identical exposure with a 0.03% expense ratio, one-tenth of EFA’s cost. VEA tracks a slightly different index with similar holdings. For long-term investors, that 0.29% annual savings compounds meaningfully over decades. VEA’s $260 billion in assets also provides superior liquidity for larger positions.
EFA is a core international holding tracking developed markets outside North America, with currency risk and structural growth challenges requiring patience and a long time horizon.
Contact [email protected] for any questions or corrections.