
India’s economy is projected to grow between 6.6% and 7.4% in 2026, outpacing most developed markets and positioning the country as a compelling alternative to China for investors seeking emerging market exposure. For those wanting a simple way to capture this growth, iShares India ETF (NYSEARCA:INDA) offers broad access to Indian equities through a single ticker. But recent performance raises questions about whether this ETF delivers on India’s promise.
A Diversification Play, Not a Growth Champion
The iShares India ETF holds 165 companies spanning India’s equity market, from financial giants like HDFC Bank and Reliance Industries to industrial and technology firms. With $9.6 billion in assets and a 0.62% expense ratio, INDA provides liquid, cost-efficient exposure to a market that many investors can’t easily access otherwise.
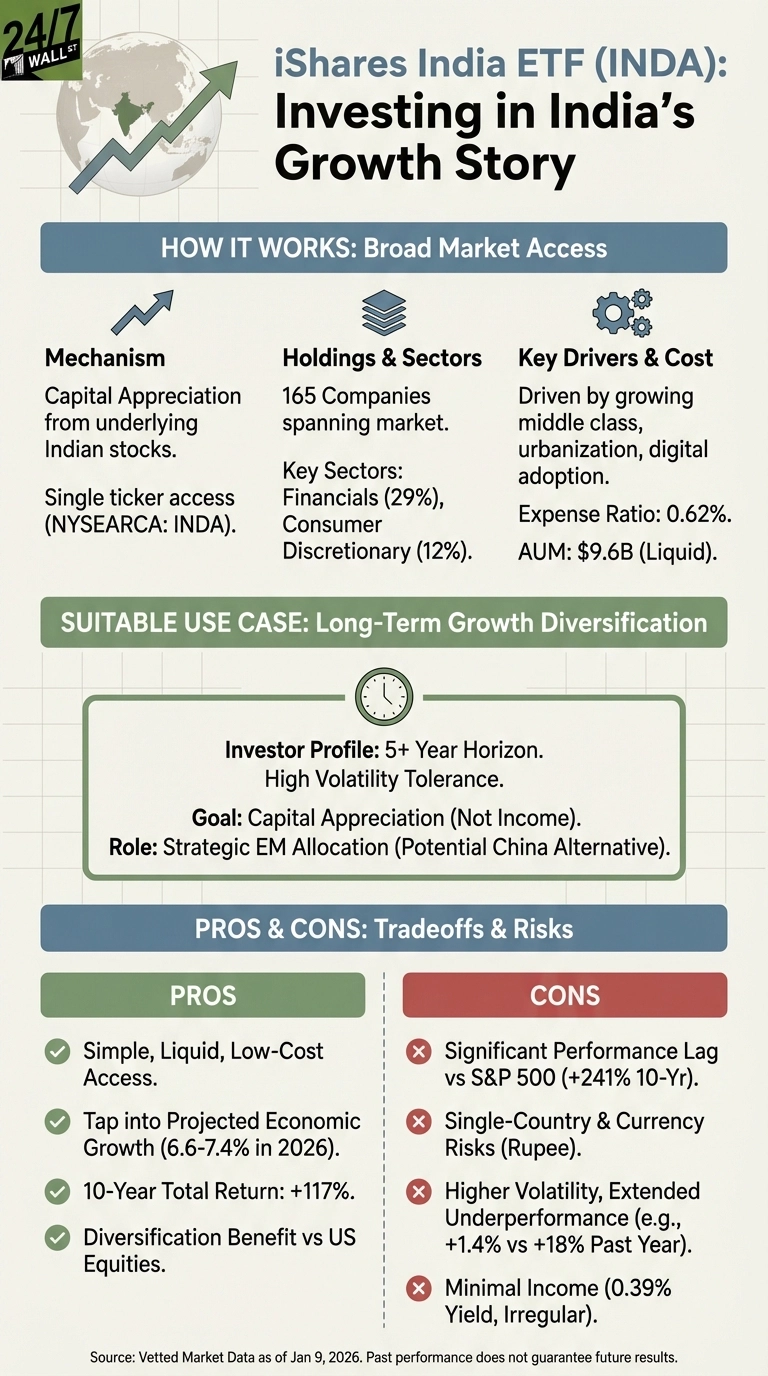
The ETF’s return engine is straightforward: capital appreciation from underlying Indian stocks. With financials comprising 29% of holdings and consumer discretionary another 12%, INDA essentially bets on India’s growing middle class and expanding credit markets. These sectors benefit directly from rising incomes, urbanization, and digital financial services adoption.
However, INDA’s 10-year total return of 117% significantly trails the S&P 500’s 241% over the same period. Even more concerning, the ETF gained just 1.4% over the past year while U.S. markets rose 18%. This gap reflects both India-specific challenges and the reality that emerging market returns don’t always match GDP growth rates.
What You’re Trading Away
Investors choosing INDA accept several tradeoffs. First, single-country concentration means no diversification across emerging markets. If India stumbles, there’s no offset from growth in other regions. Recent tariff threats from the U.S. administration highlight this vulnerability, as MarketWatch noted that Trump’s shift on India “hurts Prime Minister Narendra Modi politically and India economically.”
Second, currency risk cuts both ways. The Indian rupee’s movements against the dollar can amplify or diminish returns regardless of underlying stock performance. Third, the minimal 0.39% dividend yield makes this purely a capital appreciation play, offering no income cushion during volatile periods.
Who Should Avoid INDA
Income-focused investors should look elsewhere. The negligible yield and irregular dividend payments won’t support retirees or those building income streams. Similarly, investors with short time horizons face heightened risk. Emerging market volatility means INDA can underperform for extended periods, as the recent 12-month results demonstrate.
Consider the Concentrated Alternative
The iShares India 50 ETF (NYSEARCA:INDY) tracks India’s Nifty 50 index with just 50 holdings versus INDA’s 165. This concentration on India’s largest, most liquid companies reduces small and mid-cap exposure but may offer more stability. INDY’s expense ratio of 0.65% is marginally higher than INDA’s 0.62%, making the cost difference negligible. The key distinction is portfolio construction: INDY focuses exclusively on giant-cap stocks, which may appeal to investors prioritizing liquidity and brand recognition over broader market exposure.
INDA serves best as a long-term diversification tool for investors with at least a five-year horizon and tolerance for emerging market volatility, but recent underperformance suggests India’s growth story doesn’t automatically translate to superior equity returns.